

Abstract
Insulin resistance is an important risk factor for diabetes and other diseases. It has been important to estimate insulin resistance in epidemiological and genetic studies involving significant number of individuals. Complex and invasive protocols are impractical. Therefore insulin sensitivity indices based upon the oral glucose tolerance test have been introduced. The aim of the present study was to assess the accuracy with which OGTT-derived indices would reflect changes in insulin sensitivity in the face of changes in other factors, such as rate of glucose absorption and/or B-cell function. A computer model was employed to predict excursions of plasma glucose and insulin after a 75g oral glucose load. The model was then used to predict changes in these excursions which would be observed with altered insulin resistance, with alterations in b-cell sensitivity to glucose, and/or alterations in glucose absorption rates. Published indices of insulin sensitivity could then be calculated from the predicted curves, to ask whether changes in b-cell function or glucose absorptions rates might be misinterpreted (using the indices) as changes in insulin sensitivity. The model accurately represented OGTT data for a normal glucose tolerant subject, closely matching published data. Imposed 50% reductions or increases in insulin sensitivity alone in the model were reflected in only small changes in OGTT-derived insulin sensitivity values. More important, imposed alterations in beta-cell sensitivity and glucose absorption without simulated changes in insulin sensitivity did change previously published insulin sensitivity indices. These results indicate that caution is required for the interpretation of differences in OGTT-derived values of insulin sensitivity, because variation in factors other than insulin sensitivity per se appear to have the greatest effects on indices calculated from the OGTT alone.
Introduction
Insulin resistance is a central feature of the metabolic syndrome, the clustering of central body obesity, impaired glucose tolerance, hypertension and dyslipidemia. The syndrome is associated with a several-fold increase in diabetes and cardiovascular morbidity and mortality. Incidence of the metabolic syndrome has been rapidly growing and is reaching epidemic proportions with a major impact on public health. Consequently many research projects are focused on insulin resistance and its complications. A fundamental requirement for this research is the ability to accurately assess insulin sensitivity in large cohorts.
Methods developed in the research laboratory are often not applicable in large populations. One example is the hyperinsulinemic-euglycemic clamp test. Although considered the “gold standard” for in vivo quantification of insulin sensitivity (1) this technique is time consuming, costly and experimentally demanding. Another widely applied technique is the minimal model (2), which determines insulin sensitivity from analysis of a frequently-sampled intravenous glucose tolerance test (FSIGT). The latter method is less labor-intensive than the euglycemic clamp and has been used for large studies (3,4). However, the FSIGT can also be expensive, as glucose and insulin measurements usually are made from multiple blood samples taken over a 3-h period.
There has been a search for simpler but still accurate methods for the quantification of insulin sensitivity, which are applicable in large cohorts. The most widely used surrogate measures of insulin action in epidemiologic studies of cardiovascular disease and diabetes are based upon fasting blood measurements only; among these are fasting insulin per se, the homeostatic model assessment (HOMA (5)) and the quantitative insulin sensitivity check index (QUICKI (6)). However, there are problems associated with the use of fasting-based measures. HOMA and QUICKI are mathematically related and provide essentially identical information (7). HOMA reflects hepatic rather than peripheral insulin resistance (8). Also, the genetic basis of HOMA has been differentiated from that of insulin sensitivity measured directly from the FSIGT, suggesting that HOMA and the minimal model do not measure genetic contribution to insulin resistance per se, but capture shared environmental components (9). One possible reason that fasting insulin-based indices appear different from direct measures of insulin action is that fasting insulin reflects not only insulin sensitivity, but also insulin secretion as well as metabolic clearance of the hormone. Therefore the plasma measurement alone will not accurately reflect insulin sensitivity in subjects with beta-cell dysfunction (7,10). The accuracy of indices of insulin sensitivity purely based on fasting measures has not been fully proven and is still a matter for discussion.
Given the previously stated limitations, it would be attractive to exploit the oral glucose tolerance test (OGTT) to measure insulin sensitivity. A multiplicity of mathematical representations calculating insulin sensitivity from glucose and insulin excursions after oral glucose ingestion have been introduced (11-15). These published relations exploit the time courses of glucose and insulin following glucose ingestion to calculate insulin action by a variety of formulae. However, not only insulin sensitivity per se, but other biological processes also affect plasma patterns of glucose and insulin after glucose ingestion. These include the rate of glucose absorption, endogenous insulin secretion in response to glucose and incretins, as well as insulin-independent effects of glucose on glucose uptake and production (16,17). Thus in contrast to insulin sensitivity calculated from the glucose clamp, insulin sensitivity derived from an OGTT could potentially be confounded by physiologic factors separate from insulin resistance itself.
It is difficult experimentally to determine the relative importance of factors other than insulin resistance per se on surrogate insulin resistance indices, which are based upon the oral glucose tolerance test. One approach to assessment of the important of other factors compared to insulin resistance itself is to use computer modeling. One can accurately simulate the OGTT with a physiologically based model. Then, using the model, one examines the predicted effects of various physiological processes (e.g., glucose absorption) on the shape of the OGTT, and insulin resistance calculated from specific formulas. Here we introduce such a model, and predict the effects of changes in various physiological parameters upon OGTT indices proposed to reflect insulin resistance per se. The study model suggests that it is difficult if not impossible to interpret changes in the OGTT in terms of a single metabolic process such as insulin sensitivity itself. Therefore, indices of insulin resistance from the OGTT must be employed with extreme caution and under limited conditions.
Methods
Mathematical simulation of in vivo glucose and insulin metabolism during an OGTT
The computer model we used is based upon previously validated mathematical models of glucose kinetics (18) and insulin kinetics (19) which incorporate known physiology. The complete model is shown in Figure 1. Glucose kinetics were described using the model of Ni et al. (18) which was based on the work from Cobelli and colleagues (20). This model assumes a two-compartment configuration with hepatic glucose output (HGO) described as a linear function dependent on both the ambient glucose concentration and the effect of insulin.
Figure 1.

Simulation Model. Pre-hepatic insulin secretion and glucose absorption rates are “given” inputs to the model. See text for details.
Equations 1, 2 and 3, below, represent factors, which control the plasma glucose concentration. That is, the rate of change of plasma glucose is given by
| (1) |
Compartment G1 represents the concentration of glucose in plasma and tissues that rapidly equilibrate with plasma (mg/dl, insulin insensitive), while G2 represents the mass of glucose in tissues that slowly equilibrate with plasma (mg, insulin sensitive). VG is the volume of the extracellular space (glucose distribution volume). Abs(t) is the rate of absorption of glucose from the gastrointestinal tract and HGO(t) is the endogenous glucose production rate. K parameters are fractional transfer coefficients as shown in Figure 1 (min-1). The rate of appearance of glucose in the extravascular compartment is given by
| (2) |
FX represents the fraction of the effect of interstitial insulin that acts to suppress endogenous glucose output, while (1-FX) is the remaining fraction which accelerates glucose disposal from the peripheral compartment. The rate of endogenous glucose production is limited by plasma glucose (G1(t)) and interstitial insulin (X(t)).
| (3) |
HGO0 is the endogenous glucose output, which would obtain in the absence of effects of interstitial insulin and/or plasma glucose to restrain glucose production. Rate of change of plasma insulin is given by
| (4) |
S(t) is the moment-by-moment secretion rate of insulin from the pancreatic islets; FI is the fractional clearance rate of secreted insulin by the liver. VI is the distribution volume of insulin in the body. Ib is the basal (fasting) insulin concentration.
| (5) |
The effect of insulin on glucose kinetics was modeled as a remote insulin effect, and was partitioned into two components. As previously noted, parameter FX describes that fraction of the remote insulin effect that suppresses hepatic glucose output by the liver, while (1-FX) describes the effect to activate glucose utilization by insulin-sensitive tissues.
Plasma insulin kinetics were described using a one-compartment model as described by Watanabe et al. (21). Pre-hepatic insulin secretion is a known input to this model. The insulin secretion rate changes in proportion to the ambient glucose concentration, with Kβ representing β-cell sensitivity to glucose.
The term (1-FI) describes the fraction of insulin secretion that survives hepatic transit, with FI representing fractional hepatic insulin extraction. The plasma insulin concentration above basal determined by this model is used to determine the effect of interstitial insulin, X(t).
Model parameters were derived for man from the literature (21,22). The model was used to describe insulin and glucose excursions after a 75 g oral glucose load under various simulated metabolic conditions; isolated 50% changes of various parameters (see below) were imposed. Simulated glucose and insulin concentrations and their respective incremental area under the curve (AUC) were compared with simulated OGTT-data representative for the parametrically unaltered “normal” state.
Simulation 1
Normal glucose tolerant subjects
We used parameter values representative for the normal state (Table 1). To evaluate whether the model predictions are consistent with experimental data representing an “average” human subject, the glucose and insulin data produced by the simulation were compared to real oral tolerance data obtained from the literature (Figure 2, 23).
Table 1.
Parameter values used for simulation of OGTT insulin and glucose concentrations in the normal state.
| Model Parameter | Unit | Value |
|---|---|---|
| F | fraction | 0.5 |
| KI | min-1 | 0.175 |
| VI | L | 4.55 |
| KG | fraction per mg/dl | 0.009 |
| K21 | min-1 | 0.043 |
| K12 | min-1 | 0.059 |
| K01 | min-1 | 0.012 |
| K02 | min-1 | 0.0055 |
| KL | min-1 | 0.00917 |
| p2 | min-1 | 0.02 |
| p3 | min-2 per μU/ml | 0.00001 |
| FX | fraction | 0.01 |
| VG | dl | 11.4 |
| HGO(0) | mg/min | 274.4 |
Figure 2.

Plasma glucose and insulin excursions in response to an OGTT as predicted by our model (solid line) closely matches the “real” glucose and insulin data (23). Residuals are shown in the inserts.
Simulation 2
Insulin sensitivity
We examined the impact of changes in insulin sensitivity alone on OGTT-data. Changes in insulin sensitivity were accomplished by modifying the effect of insulin in the remote (interstitial) compartment on glucose disposal (Figure 1). Alterations in insulin sensitivity were imposed by changing the value of p3 in Equation 5.
Simulation 3
Beta-cell sensitivity
The stimulatory effect of a change in glucose on beta-cell secretion is described by Kβ. A 50% enhancement or reduction in parameter Kβ was imposed on the model in order to simulate isolated changes in pancreatic insulin response to glucose.
Simulation 4
Intestinal glucose absorption
While the total rate of glucose absorption was scaled by 50%, insulin sensitivity, beta-cell sensitivity to glucose and glucose effectiveness were kept constant.
Simulation 5
Constant intestinal load absorbed, with change in absorption profile
To illustrate the impact of changing the glucose absorption profile without affecting the total glucose load absorbed, two profiles of glucose absorption were extracted from literature (23,24). These profiles were chosen because the individuals were normal, and frequent samples of blood had been taken during the OGTT. On average, the rate of glucose absorption in normal patients obtained by Tillil et al (23) was faster than the rate of absorption extracted from Basu et al. (24). The slower glucose absorption rate resulted in longer absorption time interval in the latter study (400 minutes) for the same amount of glucose load (75 g glucose) to be absorbed. Thus, use of the two profiles allowed us to examine effect of absorption in separate individuals. The total glucose load absorbed was 99% identical between the two studies
OGTT-derived indices of insulin sensitivity
Based on the simulated glucose and insulin excursions, published indices of insulin sensitivity (Table 2) were calculated. Indices applied here have been used in 10 or more published articles. The indices used were the following:
Table 2.
OGTT-derived indices of insulin sensitivity and their coefficient of correlation (r) between SIOGTT and Siclamp from the study that introduced the respective composite (n= total number of subject in the study).
Insulin120 min
The plasma insulin concentration [mU/l] 120 minutes after the oral glucose challenge (11).
Matsuda-index
This index combines two terms that account for insulin sensitivity of the hepatic as well as the peripheral tissues. One part of the equation consists of a hyperbolic conversion of the product of fasting plasma glucose and insulin as a measure of hepatic sensitivity. The second term accounts for whole-body insulin sensitivity, which is described by the inverse product of the mean glucose and insulin concentration after the glucose load (14).
ISI(0,120)-index
In this mathematical relation, insulin sensitivity is expressed as the ratio between glucose uptake rate and the logarithmic transformation of serum insulin concentration. Glucose uptake rate in peripheral tissue is expressed as the difference between the administered glucose and the remaining glucose in the glucose space after 120 minutes. Effects of glucose on glucose disposal are accommodated by dividing glucose uptake rate by the mean plasma glucose concentration (13).
OGIS120
Mari et al. developed a model based OGTT-index. The equations are derived from a simplified physiological model of insulin and glucose dynamics, which is constructed on established principles of glucose kinetics and insulin action (11).
Results
Simulation of OGTT
The model-simulated glucose and insulin time courses accurately mimicked average OGTT glucose and insulin profiles derived from normal glucose tolerant individuals (Figure 2, 23). Residual patterns indicate the model-simulated glucose accurately reflected the average glucose and insulin data (data not shown).
Results of changes in individual variables on OGTT profiles
Insulin Sensitivity
Imposing a 50% reduction of insulin sensitivity increased predicted plasma glucose during the OGTT (Figure 3A, Table 3). The incremental area under the curve (AUC) for glucose increased 31% leading to a concomitant 10% increase in insulin AUC, even though sensitivity of the beta-cell to glucose was not altered in this simulation. Conversely, a simulated 50% increase in insulin sensitivity lowered predicted incremental glucose (incremental AUCglucose: -17%) and plasma insulin excursions (incremental AUCinsulin: -5%).
Figure 3.
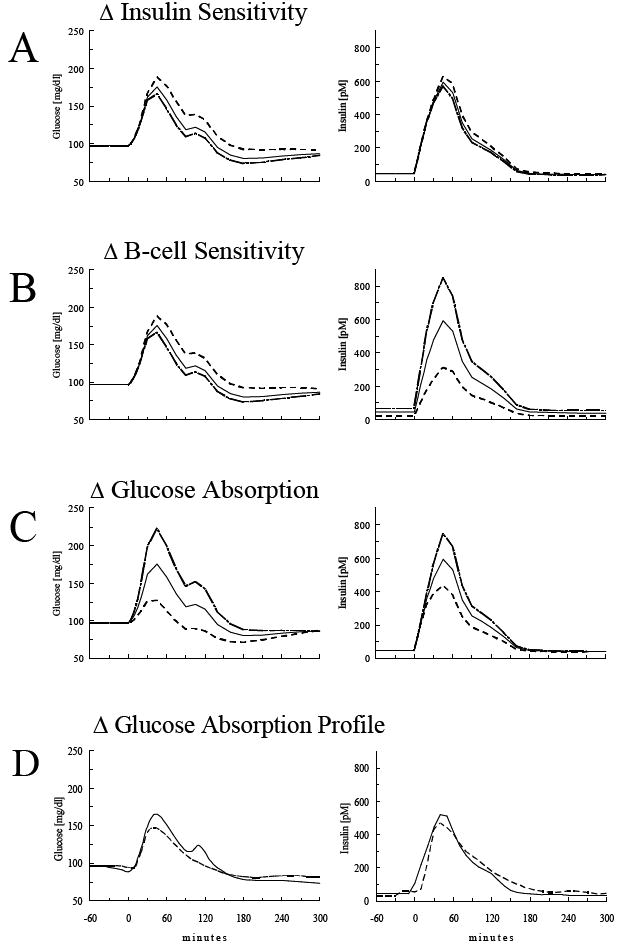
Model simulation of plasma glucose and insulin concentrations in response to an oral glucose load (75 g) under the assumption of a 50% increase (dashed line) or reduction (dot-dashed line) in insulin sensitivity (A), beta-cell sensitivity (B), glucose absorption from the intestine (C), or change in glucose absorption profile (D).
Table 3.
Insulin and glucose area under the curve (AUC) and their relative changes in the individual simulations.
| AUC120min, above baseline | Relative changes | ||||
|---|---|---|---|---|---|
| Insulin [mU/l] | Glucose [mg/dl] | Insulin [%] | Glucose [%] | ||
| Normal values | 6170 | 4721 | 100 | 100 | |
| Imposed changes | Absolute changes In AUC 120 min | Relative changes In AUC 120 min | |||
| Isolated Δ Insulin Sensitivity | +50% | 5840 | 3907 | -5 | -17 |
| -50% | 6762 | 6182 | 10 | 31 | |
| Isolated Δ β-cell Sensitivity | +50% | 8759 | 3907 | 42 | -17 |
| -50% | 3381 | 6282 | -45 | 33 | |
| Isolated Δ Glucose Absorption | -50% | 4564 | 987 | -26 | -79 |
| Isolated Δ Glucose Absorption Profile | N/A | 4498 | 3195 | -27 | -32 |
Beta-cell sensitivity to glucose
When the simulated sensitivity of the beta-cell to glucose was independently raised or reduced by 50%, the impact was proportionately higher or lower plasma insulin excursions respectively (Figure 3B,Table 3). Thus, with a 50% reduction of beta-cell sensitivity, incremental AUC for insulin was reduced by 45% accompanied by a 33% increase in the incremental AUC for plasma glucose due to reduced glucose clearance and increased liver glucose production.
On the other hand, a simulated 50% increase in beta-cell sensitivity increased predicted AUC for insulin by 42%, with a resultant 17% decline in the incremental AUC for glucose, reflecting the simulated enhancement of glucose tolerance in the face of increased β-cell function on glucose tolerance.
Glucose Absorption
The simulation of a reduction in glucose absorption resulted in the most pronounced reduction of glucose and insulin plasma concentrations (Figure 3C, Table 3). Incremental AUC for glucose was reduced by as much as 79%. Because glucose levels were diminished the insulin concentrations were also reduced (incremental AUCinsulin: -26%). An alternative published pattern of glucose absorption (24) resulted in reduction of the incremental AUC of insulin by 27%, and reduction of the glucose AUC by 32% (Figure 3D, Table 3).
Indices of insulin sensitivity
Values of the various indices of insulin action calculated from the simulated OGTT for a normal individual (Simulation 1) were in agreement with published values: Sensitivity values were 4.1 10-4 U*l-1ml*mg-1*ml for the Matsuda-index (2.9 to 6.0, (32-34)), 80.0 mg*l-2*mmol-1*mU*min for the ISI(0,120)-index (56 to 89, (14;34;35)), and 403.1 ml*min-1*m-2 for the OGIS120 (362 to 492, (12;36)).
Insulin Sensitivity
Table 4 summarizes the insulin sensitivity values calculated from OGTT-data resembling a normal glucose tolerant individual and the relative changes in the calculated insulin sensitivity indices. When a 50% reduction in insulin sensitivity only was imposed OGTT-derived sensitivity indices showed decreased sensitivity (Table 4). However, the changes were not proportional, and generally underestimated the magnitude of the changes in resistance. The Matsuda-index and the ISI(0,120)-index fell by 9% and 13.5% respectively, and the simple index measuring insulin concentration at 120 minutes increased 14.4%. The OGIS index decreased by 2.5%. When an isolated 50% rise in insulin sensitivity was imposed on the model the calculated OGTT-indices increased by an average of only 2% (ranging from -5.9 (I120 index) to +6.8 % (ISI(0,120)-index)).
Table 4.
Relative changes of the SI-values calculated from the different OGTT-derived insulin sensitivity indices. Isolated changes in Insulin sensitivity imposed on the computer model had less impact on the SIOGTT than changes in factors other than insulin sensitivity.
| I120 | Matsuda-index | ISI(0,120)-index | OGIS120 | ||
|---|---|---|---|---|---|
| Normal values | 30.6 | 4.1 | 80.0 | 403.1 | |
| Imposed changes | |||||
| Isolated Δ Insulin Sensitivity | +50% | -5.9 | 5.6 | 6.8 | 1.4 |
| -50% | 14.4 | -9.1 | -13.5 | -2.5 | |
| Isolated Δ β-cell Sensitivity | +50% | 41.1 | -29.6 | -6.3 | -2.9 |
| -50% | -42.8 | 81.7 | 11.8 | 3.3 | |
| Isolated Δ Glucose Absorption | -50% | -25.8 | 32.6 | 32.7 | 7.4 |
| Isolated Δ Glucose Absorption Profile | N/A | -47.3 | 36.7 | 17 | 9.1 |
Beta-cell sensitivity to glucose
Isolated alterations in beta-cell sensitivity to glucose (Simulation 3) led to striking and widely varied changes in the calculated sensitivity values, even though simulated sensitivity per se did not change at all (Table 4). The 50% reduction of beta-cell sensitivity was given as an 82% increase in insulin sensitivity by the Matsuda index and given as a 43% decrease by the I120. The ISI(0,120) index went up by 12% while the OGIS120 was only marginally affected (+3.3%). Simulation of a 50% increase in beta-cell sensitivity led to pronounced changes in the I120 and the Matsuda-index (41% and −30% respectively) but did not markedly affect the OGIS120.
Glucose Absorption
When simulated intestinal glucose absorption was reduced by 50% (Simulation 4), we observed pronounced increments in most of the calculated insulin sensitivity indices, despite no change in the actual insulin sensitivity value (Table 4). Lowering the amount of intestinal glucose absorption was misinterpreted as clear increase in OGTT-based indices ranging from 7.4% (OGIS120) to 33% (ISI(0,120)- and Matsuda-index)). Changing the profile of glucose absorption without a change in the total amount of glucose absorbed also impacted the insulin sensitivity as calculated by the OGTT-derived indices; despite the fact that the only change was in the shape of the glucose absorption profile. However the insulin sensitivity change was not concordant among various indices. For example, I120 insulin sensitivity index indicated 47% decrease of insulin sensitivity, while Matsuda index quantified the change in the glucose absorption profile as 36.7% improvement in insulin sensitivity.
Discussion
The use of the OGTT for measuring insulin sensitivity bears several potential advantages: OGTT is a widely used, straightforward test which given its simplicity, could in principle be applicable in large populations. Another advantage is that the OGTT is performed under rather physiological conditions with dynamic changes in glucose and insulin concentrations.
Several previous studies have shown significant correlations between insulin sensitivity values derived from the OGTT and insulin sensitivity derived from the euglycemic clamp (11,14,15). However, these previous studies were usually performed in metabolically normal subjects, in whom insulin sensitivity was known to be correlated with adiposity as well as insulin response. Therefore, previously reported correlations between OGTT indices and direct sensitivity measurements by the glucose clamp may well reflect epiphenomena wherein the adiposity and beta-cell compensation for resistance itself increased OGTT indices due to compensation for resistance. If so, differences in beta-cell responsiveness between ethnic groups, for example could render conclusions regarding insulin resistance per se questionable.
Supporting the latter concept, several groups found somewhat weak correlations between insulin sensitivity values derived from direct measurements and various OGTT-based indices (11,25,26). In a cohort of 77 Japanese individuals with varying degrees of glucose tolerance, Matsuda’s (r= 0.45) and ISI(0,120) (r= 0.53) formulas correlated only modestly with clamp insulin sensitivity values (25). Also OGTT-derived indices were less likely to detect differences in insulin sensitivity among different ethnic groups (Asian-, African-, Caucasian-, and Mexico-Americans), while differences had been clearly established by euglycemic clamp measurements (27). Furthermore, a recently published study reported that the estimations of insulin sensitivity and beta-cell function by OGTT derived methods failed to reproduce the hyperbolic relation between the latter factors (28), which has been well established (29).
Beta-cell function is an important determinant of oral glucose tolerance in vivo. Indeed, in the present study, 50% changes of beta-cell sensitivity resulted in almost equivalent changes in integrated plasma insulin response (Table 3). Plasma insulin is a quantitatively important component of most of the applied OGTT-formulae (Table 3). In the present study a simulated reduction in beta-cell sensitivity only caused an attenuation of insulin excursions, which resulted in a substantial overestimation of insulin sensitivity from published indices. Conversely an increase in beta-cell sensitivity was misinterpreted as insulin resistance. This indicates that the use of OGTT-derived indices will be confounded by differences in beta-cell function.
It is established that a curvilinear relationship exists between insulin response and insulin sensitivity (29). For any amount of insulin secreted by the pancreas, the biological response of a given effector is dependent on its insulin sensitivity. Any decrease in insulin sensitivity could result in increases in blood glucose concentrations that will act on the beta-cell to produce a compensatory stimulus of insulin secretion, leading to a degree of hyperinsulinemia that is approximately proportional to the degree of resistance. Thus, plasma insulin concentrations during an OGTT simultaneously reflect these two interdependent physiological processes (insulin secretion and insulin sensitivity). Therefore it could be argued that in individuals with comparable beta-cell function, insulin response during an OGTT can be used as a surrogate for insulin sensitivity. However we also found that a 50% reduction of beta-cell sensitivity resulted in pronounced overestimation of insulin sensitivity by the OGTT-indices. These findings suggest OGTT-based indices will be less capable of accurately measuring insulin sensitivity in subjects with even a subtle beta-cell defect.
In the present simulation insulin “sensitivity” indices I120 and the Matsuda-index were most vulnerable to isolated changes in beta-cell sensitivity. The I120 directly measures insulin response during the OGTT and is therefore fully dependent on changes in insulin secretion. The Matsuda-index contains the product of glucose and insulin concentrations (fasting and during the OGTT) in the denominator. Therefore a fall in plasma insulin levels due to beta-cell dysfunction will incorrectly increase the calculated sensitivity value, if the reduction in insulin is not directly accompanied by an increase in plasma glucose levels. It has been demonstrated that a reduction of plasma insulin levels is not necessarily translated into a rise in glucose concentrations since other compensatory mechanisms attempt to maintain glucose homeostasis. The impact of beta-cell function on the Matsuda index demonstrated in the present study is confirmed by a number of previous investigations. When the Matsuda-index was tested against the clamp in type 2 diabetic patients either no significant correlation (11) or considerably lower coefficient of correlation (16) was found.
Recently, the Matsuda-index was used to estimate insulin sensitivity in children with cystic fibrosis (30). Due to the underlying disease there was a 62% reduction in insulin areas under the curve during the OGTT 13 years after diagnosis. The Matsuda index indicated a 175% increased insulin sensitivity. But, recent clamp measurements in patients with cystic fibrosis have documented decreased insulin sensitivity as the disease progresses (31-33). Therefore it is likely that the reported apparent improvement of insulin sensitivity was an artifact of the reduction of the insulin response to glucose due to beta-cell dysfunction.
The amount of glucose absorbed into the systemic circulation has a large impact on glucose and insulin concentrations during the OGTT. It has been demonstrated that variation in gastric emptying accounts for ~35% of the variance in peak blood glucose concentrations after ingestion of oral glucose (16). Additional factors that determine the appearance of glucose include mucosal absorption of glucose, small-intestinal motor patterns, and splanchnic blood flow. Insulin levels are also dependent on the rate of glucose absorption since glucose is a stimulus for insulin secretion. Additionally, insulin concentration after oral glucose is influenced by incretins.
We found that a simulated isolated reduction in glucose absorption resulted in diminished post-load glucose and insulin excursions. As a consequence, OGTT-based indices misinterpreted a reduction of intestinal glucose absorption as an increase in insulin sensitivity. The strong effect of glucose absorption on OGTT-derived insulin sensitivity values in the present study is supported by OGTT-data from human subjects: Intestinal glucose absorption was reduced by a one-time administration of the alpha-glucosidase inhibitor acarbose both in healthy subjects (34) and in patients with type 2 diabetes (35). Calculated OGTT-derived sensitivity indices were up to 50% higher in the acarbose experiments (Table 5) even though a single dose of acarbose does not affect insulin sensitivity (36). Moreover, a change in the absorption profile without changing the total intestinally absorbed load had a similar impact on the OGTT-derived indices as the 50% reduction in total absorbed glucose. A majority of OGTT-derived indices inaccurately reported the change in the absorption profile as a change in insulin sensitivity.
Table 5.
OGTT-indices of insulin sensitivity overestimate insulin sensitivity when glucose absorption is reduced by a single dose of acarbose.
Table shows SIOGTT-values calculated from OGTT data (100g of sucrose) in normal (34) and type 2 diabetic (35) subjects after placebo and the relative changes of the SIOGTT values after the administration of 100 mg acarbose.
| Acarbose-Studies in human subjects | I120 | Matsuda-index | ISI(0,120)-index | OGIS120 | |
|---|---|---|---|---|---|
| Healthy Subject | Placebo | 100 | 1.6 | 63.3 | 351 |
| Subject with T2DM | Placebo | 20 | 3.6 | 36.6 | 295 |
| Healthy Subject | Acarbose | -42 | 49 | 11 | 13 |
| Subject with T2DM | Acarbose | -25 | 31 | 39 | 2 |
In the present study we employed a computer model to investigate effects of various metabolic factors on OGTT-derived insulin sensitivity. We found that OGTT-derived indices presently available largely underestimate isolated changes in insulin sensitivity. Also, the simulation indicates that beta-cell function and patterns and/or amounts of intestinal glucose absorption have a very large impact on insulin sensitivity values calculated from the OGTT.
The present study points out the limitations of OGTT-indices: Caution is required for the interpretation of OGTT-derived insulin sensitivity values in clinical research because differences in SIOGTT might reflect variations in beta-cell function, adiposity, and/or glucose absorption rather than variations in insulin sensitivity. It is not clear that OGTT based indices are superior to fasting insulin alone for measuring insulin sensitivity when direct methods such as the euglycemic clamp, the minimal model or the pancreatic suppression test cannot be used.
Figure 4.

Known glucose absorption and insulin secretion rates. Top panel shows the assumed gut glucose absorption rate over the course of the OGTT. Bottom panel shows the pre-hepatic insulin secretion rates.
Figure 5.
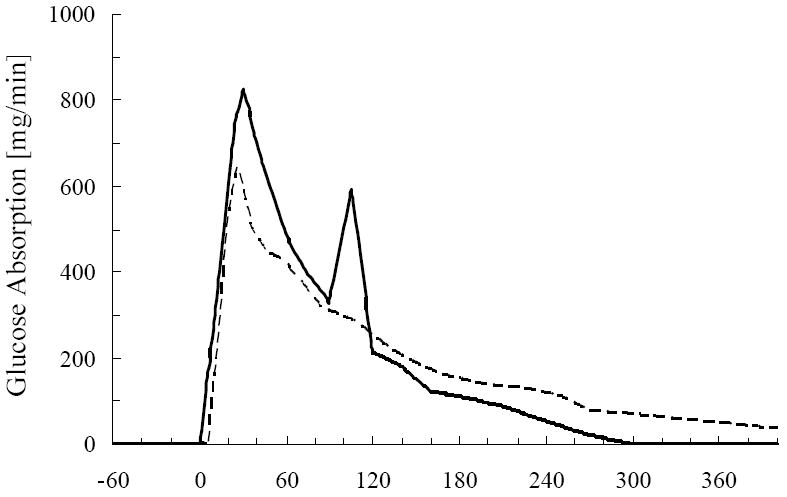
Two different glucose absorption profiles pertaining to normal population of humans. Glucose absorption aquired from Tillil et al. (23), solid line, and glucose absorption profile extracted from Basu et al. (24), dashed line.
Acknowledgments
This work was supported by grants to RNB from the National Institutes of health (DK27619 and DK29867). Dr. Hücking was supported by a Mentor Grant to RNB from the American Diabetes Association. RW is a grantee of the American Diabetes Assn.
Reference List
- 1.DeFronzo RA, Tobin JD, Andres R. Glucose clamp technique: a method for quantifying insulin secretion and resistance. Am J Physiol. 1979;237:E214–E223. doi: 10.1152/ajpendo.1979.237.3.E214. [DOI] [PubMed] [Google Scholar]
- 2.Bergman RN. Lilly lecture 1989. Toward physiological understanding of glucose tolerance. Minimal-model approach. Diabetes. 1989;38:1512–1527. doi: 10.2337/diab.38.12.1512. [DOI] [PubMed] [Google Scholar]
- 3.Haffner SM, Howard G, Mayer E, Bergman RN, Savage PJ, Rewers M, Mykkanen L, Karter AJ, Hamman R, Saad MF. Insulin sensitivity and acute insulin response in African-Americans, non-Hispanic whites, and Hispanics with NIDDM: the Insulin Resistance Atherosclerosis Study. Diabetes. 1997;46:63–69. doi: 10.2337/diab.46.1.63. [DOI] [PubMed] [Google Scholar]
- 4.Buchanan TA, Xiang A, Kjos SL, Lee WP, Trigo E, Nader I, Bergner EA, Palmer JP, Peters RK. Gestational diabetes: antepartum characteristics that predict postpartum glucose intolerance and type 2 diabetes in Latino women. Diabetes. 1998;47:1302–1310. doi: 10.2337/diab.47.8.1302. [DOI] [PubMed] [Google Scholar]
- 5.Wallace TM, Matthews DR. The assessment of insulin resistance in man. Diabet Med. 2002;19:527–534. doi: 10.1046/j.1464-5491.2002.00745.x. [DOI] [PubMed] [Google Scholar]
- 6.Katz A, Nambi SS, Mather K, Baron AD, Follmann DA, Sullivan G, Quon MJ. Quantitative insulin sensitivity check index: a simple, accurate method for assessing insulin sensitivity in humans. J Clin Endocrinol Metab. 2000;85:2402–2410. doi: 10.1210/jcem.85.7.6661. [DOI] [PubMed] [Google Scholar]
- 7.Bergman RN, Hucking K, Watanabe RM. International Textbook of Diabetes Mellitus. 3. Wiley; United Kingdom: 2004. Measuring insulin action in vivo; pp. 303–318. [Google Scholar]
- 8.Hoffman RP. Indices of insulin action calculated from fasting glucose and insulin reflect hepatic, not peripheral, insulin sensitivity in African-American and Caucasian adolescents. Pediatr Diabetes. 2008 Jan 19; doi: 10.1111/j.1399-5448.2007.00350.x. Epub ahead of print.? [DOI] [PubMed] [Google Scholar]
- 9.Bergman RN, Zaccaro DJ, Watanabe RM, Haffner SM, Saad MF, Norris JM, Wagenknecht LE, Hokanson JE, Rotter JI, Rich SS. Minimal model-based insulin sensitivity has greater heritability and a different genetic basis than homeostasis model assessment or fasting insulin. Diabetes. 2003;52:2168–2174. doi: 10.2337/diabetes.52.8.2168. [DOI] [PubMed] [Google Scholar]
- 10.Katsuki A, Sumida Y, Urakawa H, Gabazza EC, Murashima S, Morioka K, Kitagawa N, Tanaka T, Araki-Sasaki R, Hori Y, Nakatani K, Yano Y, Adachi Y. Neither homeostasis model assessment nor quantitative insulin sensitivity check index can predict insulin resistance in elderly patients with poorly controlled type 2 diabetes mellitus. J Clin Endocrinol Metab. 2002;87:5332–5335. doi: 10.1210/jc.2002-020486. [DOI] [PubMed] [Google Scholar]
- 11.Mari A, Pacini G, Murphy E, Ludvik B, Nolan JJ. A model-based method for assessing insulin sensitivity from the oral glucose tolerance test. Diabetes Care. 2001;24:539–548. doi: 10.2337/diacare.24.3.539. [DOI] [PubMed] [Google Scholar]
- 12.Cederholm J, Wibell L. Insulin release and peripheral sensitivity at the oral glucose tolerance test. Diabetes Res Clin Pract. 1990;10:167–175. doi: 10.1016/0168-8227(90)90040-z. [DOI] [PubMed] [Google Scholar]
- 13.Gutt M, Davis CL, Spitzer SB, Llabre MM, Kumar M, Czarnecki EM, Schneiderman N, Skyler JS, Marks JB. Validation of the insulin sensitivity index (ISI(0,120)): comparison with other measures. Diabetes Res Clin Pract. 2000;47:177–184. doi: 10.1016/s0168-8227(99)00116-3. [DOI] [PubMed] [Google Scholar]
- 14.Matsuda M, DeFronzo RA. Insulin sensitivity indices obtained from oral glucose tolerance testing: comparison with the euglycemic insulin clamp. Diabetes Care. 1999;22:1462–1470. doi: 10.2337/diacare.22.9.1462. [DOI] [PubMed] [Google Scholar]
- 15.Soonthornpun S, Setasuban W, Thamprasit A, Chayanunnukul W, Rattarasarn C, Geater A. Novel insulin sensitivity index derived from oral glucose tolerance test. J Clin Endocrinol Metab. 2003;88:1019–1023. doi: 10.1210/jc.2002-021127. [DOI] [PubMed] [Google Scholar]
- 16.Horowitz M, Edelbroek MA, Wishart JM, Straathof JW. Relationship between oral glucose tolerance and gastric emptying in normal healthy subjects. Diabetologia. 1993;36:857–862. doi: 10.1007/BF00400362. [DOI] [PubMed] [Google Scholar]
- 17.Bergman RN, Watanabe R, Rebrin K, Ader M, Steil G. Toward an integrated phenotype in pre-NIDDM. Diabet Med. 1996;13:S67–S77. [PubMed] [Google Scholar]
- 18.Ni TC, Ader M, Bergman RN. Reassessment of glucose effectiveness and insulin sensitivity from minimal model analysis: a theoretical evaluation of the single-compartment glucose distribution assumption. Diabetes. 1997;46:1813–1821. doi: 10.2337/diab.46.11.1813. [DOI] [PubMed] [Google Scholar]
- 19.Watanabe RM, Bergman RN. Accurate measurement of endogenous insulin secretion does not require separate assessment of C-peptide kinetics. Diabetes. 2000;49:373–382. doi: 10.2337/diabetes.49.3.373. [DOI] [PubMed] [Google Scholar]
- 20.Cobelli C, Toffolo G, Ferrannini E. A model of glucose kinetics and their control by insulin, compartmental and noncompartmental approaches. Math Biosci. 1984;72:291–315. [Google Scholar]
- 21.Watanabe RM, Steil GM, Bergman RN. Critical evaluation of the combined model approach for estimation of pre-hepatic insulin secretion. Am J Physiol. 1998;274:E172–E183. doi: 10.1152/ajpendo.1998.274.1.E172. [DOI] [PubMed] [Google Scholar]
- 22.Ferrannini E, Smith JD, Cobelli C, Toffolo G, Pilo A, DeFronzo RA. Effect of insulin on the distribution and disposition of glucose in man. J Clin Invest. 1985;76:357–364. doi: 10.1172/JCI111969. [DOI] [PMC free article] [PubMed] [Google Scholar]
- 23.Tillil H, Shapiro ET, Miller MA, Karrison T, Frank BH, Galloway JA, Rubenstein AH, Polonsky KS. Dose-dependent effects of oral and intravenous glucose on insulin secretion and clearance in normal humans. Am J Physiol. 1988;254:E349–E357. doi: 10.1152/ajpendo.1988.254.3.E349. [DOI] [PubMed] [Google Scholar]
- 24.Basu R, Breda E, Oberg AL, Powell CC, Dalla Man C, Basu A, Vittone JL, Klee GG, Arora P, Jensen MD, Toffolo G, Cobelli C, Rizza RA. Mechanisms of the age-associated deterioration in glucose tolerance: contribution of alterations in insulin secretion, action, and clearance. Diabetes. 2003 Jul;52(7):1738–48. doi: 10.2337/diabetes.52.7.1738. Erratum in: Diabetes. 2003 Dec;52(12):3014. [DOI] [PubMed] [Google Scholar]
- 25.Kanauchi M, Tsujimoto N, Hashimoto T. Validation of simple indices to assess insulin sensitivity based on the oral glucose tolerance test in the Japanese population. Diabetes Res Clin Pract. 2002;55:229–235. doi: 10.1016/s0168-8227(01)00313-8. [DOI] [PubMed] [Google Scholar]
- 26.Cagnacci A, Arangino S, Renzi A, Cagnacci P, Volpe A. Insulin sensitivity in women: a comparison among values derived from intravenous glucose tolerance tests with different sampling frequency, oral glucose tolerance test or fasting. Eur J Endocrinol. 2001;145:281–287. doi: 10.1530/eje.0.1450281. [DOI] [PubMed] [Google Scholar]
- 27.Chiu KC, Chuang LM, Yoon C. Comparison of measured and estimated indices of insulin sensitivity and beta cell function: impact of ethnicity on insulin sensitivity and beta cell function in glucose-tolerant and normotensive subjects. J Clin Endocrinol Metab. 2001;86:1620–1625. doi: 10.1210/jcem.86.4.7432. [DOI] [PubMed] [Google Scholar]
- 28.Albareda M, Rodriguez-Espinosa J, Murugo M, de Leiva A, Corcoy R. Assessment of insulin sensitivity and beta-cell function from measurements in the fasting state and during an oral glucose tolerance test. Diabetologia. 2000;43:1507–1511. doi: 10.1007/s001250051561. [DOI] [PubMed] [Google Scholar]
- 29.Bergman RN, Ader M, Huecking K, Van Citters G. Accurate assessment of beta-cell function: the hyperbolic correction. Diabetes. 2002;51(Suppl 1):S212–S220. doi: 10.2337/diabetes.51.2007.s212. [DOI] [PubMed] [Google Scholar]
- 30.Lombardo F, De Luca F, Rosano M, Sferlazzas C, Lucanto C, Arrigo T, Messina MF, Crisafulli G, Wasniewska M, Valenzise M, Cucinotta D. Natural history of glucose tolerance, beta-cell function and peripheral insulin sensitivity in cystic fibrosis patients with fasting euglycemia. Eur J Endocrinol. 2003;149:53–59. doi: 10.1530/eje.0.1490053. [DOI] [PubMed] [Google Scholar]
- 31.Hardin DS, Leblanc A, Marshall G, Seilheimer DK. Mechanisms of insulin resistance in cystic fibrosis. Am J Physiol Endocrinol Metab. 2001;281:E1022–E1028. doi: 10.1152/ajpendo.2001.281.5.E1022. [DOI] [PubMed] [Google Scholar]
- 32.Hardin DS, Leblanc A, Lukenbough S, Seilheimer DK. Insulin resistance is associated with decreased clinical status in cystic fibrosis. J Pediatr. 1997;130:948–956. doi: 10.1016/s0022-3476(97)70282-8. [DOI] [PubMed] [Google Scholar]
- 33.Holl RW, Heinze E, Wolf A, Rank M, Teller WM. Reduced pancreatic insulin release and reduced peripheral insulin sensitivity contribute to hyperglycaemia in cystic fibrosis. Eur J Pediatr. 1995;154:356–361. [PubMed] [Google Scholar]
- 34.Ranganath L, Norris F, Morgan L, Wright J, Marks V. Delayed gastric emptying occurs following acarbose administration and is a further mechanism for its anti-hyperglycaemic effect. Diabet Med. 1998;15:120–124. doi: 10.1002/(SICI)1096-9136(199802)15:2<120::AID-DIA529>3.0.CO;2-I. [DOI] [PubMed] [Google Scholar]
- 35.Seifarth C, Bergmann J, Holst JJ, Ritzel R, Schmiegel W, Nauck MA. Prolonged and enhanced secretion of glucagon-like peptide 1 (7-36 amide) after oral sucrose due to alpha-glucosidase inhibition (acarbose) in Type 2 diabetic patients. Diabet Med. 1998;15:485–491. doi: 10.1002/(SICI)1096-9136(199806)15:6<485::AID-DIA610>3.0.CO;2-Y. [DOI] [PubMed] [Google Scholar]
- 36.Fischer S, Patzak A, Rietzsch H, Schwanebeck U, Kohler C, Wildbrett J, Fuecker K, Temelkova-Kurktschiev T, Hanefeld M. Influence of treatment with acarbose or glibenclamide on insulin sensitivity in type 2 diabetic patients. Diabetes Obes Metab. 2003;5:38–44. doi: 10.1046/j.1463-1326.2003.00239.x. [DOI] [PubMed] [Google Scholar]