

Abstract
Non-coding RNAs (ncRNAs) are transcripts that do not code for proteins. Recent findings have shown that RNA-mediated regulatory mechanisms influence a substantial portion of typical microbial genomes. We present an efficient method for finding potential ncRNAs in bacteria by clustering genomic sequences based on homology inferred from both primary sequence and secondary structure. We evaluate our approach using a set of predominantly Firmicutes sequences. Our results showed that, though primary sequence based-homology search was inaccurate for diverged ncRNA sequences, through our clustering method, we were able to infer motifs that recovered nearly all members of most known ncRNA families. Hence, our method shows promise for discovering new families of ncRNA.
Keywords: ncRNAs, noncoding RNA, RNA discovery, hierarchical clustering, motif discovery
1. Introduction
1.1. Motivation and related work
Non-coding RNAs (ncRNAs) are functional transcripts that do not code for proteins. Recent findings have shown that RNA-mediated regulatory mechanisms influence a substantial portion of typical microbial genomes,1 drawing increasing attention to their study. A major approach for computational detection of ncRNAs is through comparative genomics,2 where conserved structures are predicted from sequences of multiple species. The key difficulty with this approach is that homologous ncRNAs are often dissimilar in sequence because compensatory mutation preserves structure while changing the sequence. Unfortunately, existing algorithms that infer local structured RNA alignments considering secondary structure are impractical for genome-scale searches since they are computationally expensive, and work best when applied to datasets in which homologous ncRNAs predominate. Together, these considerations suggest the following strategy: gather clusters of sequences so that each cluster is sufficiently small and enriched in homologous elements for successful computational motif prediction.
Recently, Yao et al.3 applied this strategy to search for bacterial cis-regulatory RNAs. Because cis-regulatory RNAs are often upstream of genes, they clustered regions upstream of homologous genes. We call this approach a “gene-oriented” pipeline. They avoided the need for accurate alignment by using a tool called CMfinder4 that can predict RNA motifs in unaligned sequences in the face of low sequence conservation, extraneous flanking regions and unrelated sequences. The method successfully recovered most known RNA families in Firmicutes annotated in the Rfam5 database and elsewhere. Coupled with careful manual evaluation of top-ranking results, this paper and Weinberg et al.6 identified 29 novel RNAs including several candidate riboswitches, most of which subsequently have been experimentally validated.7–11 However, this approach will detect ncRNAs only if they are well-represented upstream of homologous genes. For example, ncRNA genes that are independently transcribed (e.g. SRP, RNaseP, tRNAs) will tend to maintain particular neighboring genes only through a narrow phylogenetic range. This is true of some ncRNAs in the Firmicutes (and Yao et al.3 generally recovered these), but others will be missed. Another important example of ncRNAs that might be missed by a gene-oriented approach are cis-regulatory RNAs that regulate several non-homologous genes in a phylogenetically narrow range of species. One such example is the purine riboswitch family discussed below.
The main contribution of this paper is the development of an “IGR-oriented pipeline” that clusters intergenic regions (IGRs) based on a combination of sequence and structure similarity, independent of gene context, for purposes of ncRNA discovery. We believe it can identify ncRNAs that are difficult to find with a gene-oriented strategy. For example, our IGR-oriented approach (unpublished data) correctly predicted seven related riboswitches regulating purine biosynthesis genes in Mesoplasma florum12 with no close relatives in other sequenced species, exactly the second scenario outlined above.
The key challenge with an IGR-oriented approach is identifying and clustering homologous segments of IGRs. Traditional structure-based methods can perform well but are extremely slow,13 making them impractical for genome-scale searches. On the other hand, sequence-based methods like BLAST are poor at detecting remote homologs of RNAs, with performance dropping sharply as sequence similarity falls below roughly 60% identity.13 Unfortunately, most RNA families of interest have sequence identities of 50% or less. The main contribution of this paper is to show that, despite these difficulties, IGR-oriented approaches are feasible. In particular, although individual BLAST matches may be of indifferent quality, we find that the aggregate information in clusters of such matches is sufficient to recover strong RNA motifs in many cases, especially when coupled with a clustering procedure that exploits the patchy nature of these weak matches and some secondary structure information.
1.2. Efficient pipeline for detecting ncRNAs
Our approach to detecting ncRNAs computationally starts with identifying homologous RNA sequences. To do this without gene context, we search through entire intergenic regions (IGRs) of several species for homology. Homologous ncRNAs usually exhibit some conservation in primary sequence, so the most obvious approach is to cluster IGRs based on sequence similarity as detected by programs such as BLAST or SSEARCH.14–16
Detection of similarity, however, is often difficult without exploiting the significant conservation of RNA structure seen in many ncRNAs, yet traditional structure-based methods are impractically slow. We design a novel lightweight approach that incorporates both secondary structure information and primary sequence homology via BLAST, referred to as the folded-BLAST approach. The goal is to achieve the best sensitivity possible, while maintaining feasible search time.
A significant additional complication in the clustering step is that RNAs may contain multiple domains with recognizable homology, but these domains may be separated by dissimilar regions. To account for this, we design a hierarchical clustering method that, given a set of pairwise homology hits, heuristically merges and clusters overlapping sequences. Finally, as in Yao et al.'s pipeline,3 the clusters can be used to predict motifs, which in turn can be used to scan genomes for more motif instances (motif scan).
Our proposed pipeline for a given input set of genomic sequences, then, consists of the following steps: (1) intergenic region extraction, (2) homology search, (3) hierarchical clustering, (4) motif discovery, and (5) motif scan.
Our pipeline shares high level goals with the work of Will et al.,17 but differs in emphasis, and is somewhat complementary to it. Both cluster intergenic sequences based on homology, then attempt to predict RNA motifs in these clusters. Will et al., building on Missal et al.'s work,18 need reliable sequence alignments for their motif prediction step, so they use a stringent BLAST E-value threshold for this phase. To recover broader RNA families, they apply a second clustering step to cluster the RNA motifs produced in the first step. The number of RNA predictions is much smaller than the number of IGRs, and they can afford to apply sophisticated but computationally expensive structure-based clustering methods here, and their paper develops such a method (LocARNA).17 In contrast, we use an RNA motif prediction tool (CMfinder) that tolerates unaligned inputs and allows us to be more aggressive in trying to gather more (and more remote) homologs, on the premise that more examples will allow inference of more accurate models. Hence, we cluster intergenic sequences based on relatively permissive homology searches. One novelty of our approach is incorporating secondary structure information in homology search. Neither method attempts direct pairwise structure comparison among all intergenic sequences, that appears prohibitively expensive on datasets of this scale.
2. Methods
2.1. Extracting intergenic regions (IGRs)
Given an input genomic sequence, we remove regions annotated in biological databases as coding regions, repeat regions, tRNAs or rRNAs. Both strands are removed when one strand contains one of the above annotations. This breaks a genomic sequence into a set of intergenic regions (IGRs). We discard all IGRs shorter than 15 nts and those immediately adjacent to an annotated rRNA region, for rRNA 5′ and 3′ borders are known to be frequently misannotated. Removing genomic regions encoding for genes or known RNA elements on either strand reduces search space, yet might risk missing RNAs. We discuss this influence on our pipeline in the Results section.
2.2. Homology search
To compare performance, we used several popular search programs, including WU-BLAST,15 NCBI-BLAST,14 and SSEARCH.16 SSEARCH implements the Smith-Waterman local alignment algorithm; it is 10 times slower than BLAST programs, but is thought to be more sensitive. NCBI-BLAST and WU-BLAST are both heuristic approximations to Smith-Waterman, and begin alignment by matching exact short words (seeds). In this study, we use the smallest seed length possible, which is one for WU-BLAST and four for NCBI-BLAST.
2.3.Homology search with predicted secondary structure (folded-BLAST)
To implement folded-BLAST, we use RNALfold from the Vienna package19 to compute locally stable RNA secondary structures with a maximal base span L (empirically set to 150). Given an input sequence and a defined L, RNALfold lists predicted secondary structure components. However, we cannot fully trust the boundaries and structures predicted by folding programs, nor do we want to deal with overlapping but inconsistent predictions. Hence, we developed a heuristic procedure to merge RNALfold's components: we iteratively merge components if they overlap significantly (at least 80% or 100 bps) unless one of the components is already longer than a threshold length (1000 bps); these thresholds were determined empirically. Then we feed each resulting sequence to RNAfold. The intent is to obtain a unified structure prediction for each region in which RNALfold finds significant structure potential. For each input sequence, we extract RNAfold's prediction as to whether each nucleotide is paired upstream, downstream or unpaired. To take advantage of fast primary sequence homology search programs, we map these sequences into a 12 letter alphabet representing nucleotide plus pairing direction. The resulting sequences are treated like protein sequences, but we search using a handmade scoring matrix that is partially based on scores trained from ncRNA alignments. In the scoring matrix, nucleotide identity (match) is favored, but when the predicted structures are the same, nucleotide mismatch penalty is mitigated. The matrix is available in the online supplement.a
2.4. Clustering
Prior to clustering, we process homology hits into nodes and edges. A node represents an IGR segment (a subsequence of the IGR sequence), and an edge represents a homology hit. Edge weights are initially defined as homology bit scores. For all homology output, hits with bit scores below a certain threshold are ignored. The threshold was determined empirically by looking for a peak in the distribution of bit scores (data not shown), and was set to 45 for WU-BLAST and NCBI-BLAST, and 35 for folded-BLAST and SSEARCH. Low-score homology hits are likely to be random, and our preliminary tests on BLAST programs (unpublished) show that most random hits have scores below 35.
Homology hits often capture portions of ncRNA motifs, not full motifs. To counteract this undesired fragmentation of the IGRs' we merge nodes in two cases depicted in Fig. 1: (1) Two nodes representing segments from the same IGR that overlap significantly will be merged [Fig. 1(a)]. In this study we consider an overlap to be significant if the two segments overlap by more than 70% of the smaller of two lengths; (2) Alternatively, suppose two segments of IGR x overlap and two segments of IGR y also overlap, but the overlap between neither pair is significant. Hence neither pair would be merged under rule (1). If, however, the corresponding x–y pairs are joined by homology edges, as depicted in Fig. 1(b), we merge the x pairs and (separately) merge the y pairs. The merged nodes are connected by an edge whose weight is calculated by combining the two original edge weights in proportion to segment lengths. In practice, we rarely observe case 2.
Fig. 1.

Merging nodes. (a) Segment x1–x3 and x2–x4 overlap significantly, so they are merged into a single node representing x1–x4 (b) segment x1–x3 has a homologous hit with segment y1–y3, and x2–x4 with y2–y4, the result is two nodes, one representing x1–x4, and one for y1–y4.
The clustering step uses WPGMA (Weight Pair Group Method using Arithmetic averaging), also known as average-linkage clustering. Non-existent edges are considered as having edge scores of 0.
The output of the hierarchical clustering is a forest of trees. Some trees can be as small as having only two leaves, which means that the homology search program did not find any other IGR segments significantly homologous to the two segments represented by the two leaf nodes. The largest possible tree will contain all of the input nodes; such a supersized cluster is impractical for any further evaluation, and given that most of our ncRNA families have no more than 100 instances in our species sets, for this study, we use a cluster size cutoff of 50. In the future, instead of a rigid size cutoff, we will use adaptive methods for refining clusters (see Discussion).
2.5. Motif prediction and scan
Motif prediction and scan are done as in Yao et al.3 excluding the (subjective) manual evaluation steps. Briefly, CMfinder folds each sequence in its input set, and constructs an initial heuristic alignment attempting to match similar sequence and structural features between sequences. Next, it builds a covariance model (CM) from the alignment, exploiting both mutual information and single-sequence structure predictions to arrive at a consensus structure prediction. Finally, it performs an EM-like iteration, alternately realigning the sequences to the model and rebuilding the model from the refined alignment. It is robust to non-motif containing sequences and extraneous regions flanking the motifs. Parts of CMfinder use the Infernal software package,20 which is also used for the scanning step in our evaluation. For motif/CM scans, we use Infernal's cmsearch with the CP9 HMM filter and an HMM E-value cutoff of 10.
3. Results
108 full genomic bacterial sequences (90 Firmicutes, 10 Cyanobacteria, and 8 other) were used as input to the pipeline. RefSeq21 (version 25) was used for IGR extraction. The extracted IGRs total approximately 13 Mbps. The entire set contains 1344 known ncRNAs. As mentioned in Sec. 2.1, by looking only at IGRs where neither strand has certain functional annotations, we might lose some ncRNA candidates. If we only consider ncRNAs that have an overlap with an IGR such that the overlap is at least 50% of the ncRNA length or 50 nts (whichever is smaller), then we are reduced to 1120 known ncRNAs.b If we extend our IGR extraction 50 nucleotides in each direction into annotated regions, the number increases from 1120 to 1148 while expanding the search space by around 5 Mb. Extending IGRs by 200 bps doubles the search space while covering only seven more known ncRNAs than extending 50 bps. For this study, we chose to have a smaller search space, and did not extend IGRs. Missed family members can be recovered by motif scans if the family has sufficient representation in the IGRs to form clusters that can be used by CMfinder to predict representative motifs.
Primary sequence homology data were obtained using NCBI-BLAST, WU-BLAST, and SSEARCH. To incorporate structure into our homology searches (folded-BLAST), we used WU-BLAST since it allows convenient usage of arbitrary scoring matrices. We evaluated our clustering against a set of known ncRNAs, most of which are riboswitches. Known ncRNAs were annotated based on alignments5,6,22,23 updated with ncRNA homologs found in RefSeq 25 (Z.W., unpublished data), with Ref. 22 alignments being used preferentially. Our alignment updates used previously described procedures.6
Details regarding input species and program parameters are available in the online supplement.
3.1.Cluster evaluation
Table 1 shows the average cluster performance for each ncRNA family for each homology search method. Cluster performance is evaluated as follows: for each family and each homology search method, average sensitivity and positive predictive value (PPV) are calculated by averaging over all clusters of size at least 3 in which a plurality of annotated ncRNAs are from that particular family. We ignore clusters of size 2 since these small clusters rarely lead to a useful structure prediction, even though they almost always have a PPV of 1.0. It must be noted here that of the tens of thousands of clusters produced after the size-50 tree-cutting in this study, only a small fraction of them contain known ncRNAs. We cannot evaluate the clusters that do not contain any known ncRNAs easily: they could contain undiscovered ncRNAs, repeat regions, or misannotated (and hence not excluded) coding genes. For simplicity of evaluation, we focus only on clusters that do contain known ncRNAs. For each cluster C and each ncRNA family F, sensitivity is defined as the fraction of members in F that are covered by some sequence in C, and PPV is defined as the fraction of sequences in C that cover members in F. For example, the first row in Table 1 shows that there are a total of 29 6S RNAs that are covered by our IGR input, and with folded-BLAST homology prediction, each cluster (of size ≥3) containing 6S RNAs covers an average of about seven 6S RNAs and they constitute about 45% of the members of each cluster. One should note that PPV calculated here is a lower bound, since we cannot rule out the possibility that an unknown sequence is an undiscovered ncRNA. One should also be careful in extrapolating these results to a real-use scenario, wherein the proportions of positive and negative examples might be quite different from our test set.
Table 1.
Average cluster evaluation per ncRNA family for each homology program. Only clusters of size ≥ 3 are considered. count = total number of ncRNAs of a particular family covered by IGR input, sens = average sensitivity, ppv = average positive predictive value.
|
folded-BLAST |
WU-BLAST |
NCBI-BLAST |
SSEARCH |
||||||
|---|---|---|---|---|---|---|---|---|---|
| Family | count | sens | ppv | sens | ppv | sens | ppv | sens | ppv |
| 6S | 29 | 0.25 | 0.45 | 0.16 | 0.27 | 0.22 | 0.58 | 0.26 | 0.61 |
| AdoCbl | 34 | 0.38 | 0.40 | 0.32 | 0.41 | 0.26 | 0.28 | 0.23 | 0.27 |
| COG4708 | 2 | 0.75 | 0.33 | 1.00 | 0.40 | 1.00 | 0.40 | 0.75 | 0.30 |
| FMN | 36 | 0.94 | 0.86 | 0.64 | 0.51 | 0.65 | 0.52 | 0.36 | 0.34 |
| GEMM | 11 | 0.82 | 0.23 | 0.73 | 0.22 | 0.45 | 0.17 | 0.68 | 0.79 |
| glmS | 17 | 0.79 | 0.40 | 0.36 | 0.19 | 0.55 | 0.28 | 0.27 | 0.22 |
| glycine | 16 | 0.38 | 0.25 | 0.24 | 0.14 | 0.45 | 0.38 | 0.39 | 0.34 |
| lysine | 37 | 0.16 | 0.23 | 0.15 | 0.18 | 0.17 | 0.21 | 0.20 | 0.56 |
| OLE | 5 | 1.00 | 0.83 | 1.00 | 0.53 | 1.00 | 0.53 | 1.00 | 0.63 |
| preQ1-I | 26 | 0.05 | 0.19 | 0.11 | 0.050 | 0.08 | 0.32 | 0.10 | 0.59 |
| purine | 38 | 0.18 | 0.22 | 0.15 | 0.15 | 0.15 | 0.27 | 0.26 | 0.35 |
| RnaseP | 37 | 0.45 | 0.72 | 0.46 | 0.47 | 0.46 | 0.47 | 0.25 | 0.32 |
| SAM-I | 88 | 0.09 | 0.71 | 0.09 | 0.56 | 0.10 | 0.77 | 0.12 | 0.73 |
| SMK23 | 9 | 0.11 | 0.05 | 0.11 | 0.08 | 0.11 | 0.07 | 0.11 | 0.11 |
| SRP-bact | 32 | 0.20 | 0.40 | 0.27 | 0.32 | 0.3 | 0.35 | 0.33 | 0.36 |
| tbox | 379 | 0.02 | 0.53 | 0.02 | 0.38 | 0.02 | 0.54 | 0.03 | 0.57 |
| tmRNA | 44 | 0.41 | 0.61 | 0.31 | 0.48 | 0.45 | 0.60 | 0.22 | 0.36 |
| TPP | 78 | 0.09 | 0.32 | 0.12 | 0.36 | 0.12 | 0.44 | 0.11 | 0.39 |
| ydaO | 15 | 0.37 | 0.44 | 0.77 | 0.70 | 0.83 | 0.58 | 0.73 | 0.63 |
| ykkC | 6 | 0.92 | 1.00 | 0.67 | 0.89 | 0.75 | 1.00 | 0.83 | 1.00 |
| ykoK | 21 | 0.95 | 0.95 | 0.91 | 0.72 | 0.63 | 0.66 | 0.86 | 0.66 |
| ylbH | 5 | 0.80 | 0.80 | 0.80 | 0.47 | 0.80 | 0.80 | 0.60 | 0.44 |
| yybP | 24 | 0.15 | 0.61 | 0.14 | 0.50 | 0.13 | 0.31 | 0.15 | 0.38 |
| median | 0.38 | 0.44 | 0.31 | 0.41 | 0.45 | 0.44 | 0.26 | 0.39 | |
At first glance, the results in Table 1 appear discouraging. The table shows that, with a few exceptions like ykkC, ykoK, and ylbH, most families have relatively low average cluster performance. We were also surprised to see that SSEARCH did not show a major improvement over other homology search methods since it does not use heuristics to speed up the search. These results emphasize the difficulty of the ncRNA discovery problem: primary sequence similarity alone is not sufficient to cleanly cluster family members, at least with the parameter settings used here. However, since our goal is to detect novel ncRNA families, we turn our attention to individual clusters with good PPV, since a few good clusters may suffice to recover strong motifs. For example, folded-BLAST has five clusters containing glycine riboswitches, three of which have sensitivity below 0.2, contributing to the low average in Table 1. The remaining clusters, however, have sensitivity/PPV 0.88/0.78 and 0.75/0.25 respectively. If CMfinder can find a good representative motif from one or both of these, a motif scan will likely recover other glycine riboswitches. Thus, what is more important is our ability to produce clusters that permit RNA alignment tools like CMfinder to correctly predict strucured RNAs. In the following section, we show results of predicted motifs from selected clusters.
3.2. Motif discovery and scanning
We ran CMfinder on all clusters containing at least one known ncRNA. Here we ignore again clusters not containing any known ncRNAs for simplicity of evaluation. For each cluster input, CMfinder predicts zero or more motifs. For each motif, we do a CM scan using the resulting covariance models (CMs). The CMs scan a dataset that consists of our entire ncRNA set: ~ 5 Mb of ncRNAs from all available bacterial species, not limited to the ones that served as input to the pipeline, plus a control set of ~16 Mb of randomly selected IGRs (from various species) not containing known ncRNAs. Strictly speaking, we cannot be sure that our randomly selected IGRs indeed do not contain any undiscovered ncRNAs, but for the purpose of this evaluation, we assume there to be none.
Table 2 shows the best CM scan result for each ncRNA family for each homology search method. Sensitivity is defined as the fraction of ncRNAs for that particular family that were recovered by the CM scan. In this CM scan test, a sequence hit is considered a true positive only if it is an ncRNA (regardless of strand) and belongs to the family from which the motif was predicted. We ignore strand since our clustering procedure can equally well assemble clusters of reverse-strand sequences or clusters of forward-strand sequences, and inference programs including CMfinder can generally build motif models from either. To see why, note that a putative secondary structure on one strand consisting entirely of Watson-Crick pairs will always be mirrored on the opposite strand, since the complement of a Watson-Crick pair is also one. Small differences in stacking energy and presence of G·U wobble pairs, which are mirrored by unfavorable A·C pairs, may cause the motif on one strand to score slightly better that its reverse-complement, but these are second order effects. In particular, the reverse-complement motifs generally do not significantly impair scan efficacy. For example, of the four AdoCbl clusters built with folded-BLAST, one included 25 of the 34 AdoCbl sequences, all forward strand, and another included a slightly different set of 25 reverse strand sequences (i.e. sensitivity 0.74 for each; PPV's were 0.63 and 0.89, respectively). Scan results were good for both: sensitivities/PPVs of 0.60/0.99 and 0.71/1.00, respectively, across the 1983 AdoCbl examples in the test set. Presumably the reverse strand model did slightly better since its training cluster contained fewer false positives.
Table 2.
Best CM scan result per ncRNA family for each homology program. Only the scan result for the cluster having the best sensitivity is shown. The shaded cells are the ones in which sensitivity was highest for that particular family, regardless of ppv. count = total number of ncRNAs of a particular family in the scanned database, len = average sequence length, pcid = percent identity in our structure-based alignments.
| folded-BLAST | WU-BLAST | NCBI-BLAST | SSEARCH | ||||||||
|---|---|---|---|---|---|---|---|---|---|---|---|
| family | count | len | pcid | sens | ppv | sens | ppv | sens | ppv | sens | ppv |
| 6S | 1025 | 198 | 0.36 | 0.20 | 0.99 | 0.15 | 0.99 | 0.12 | 0.98 | 0.15 | 0.98 |
| AdoCbl | 1983 | 199 | 0.36 | 0.71 | 1.00 | 0.73 | 1.00 | 0.40 | 1.00 | 0.72 | 1.00 |
| COG4708 | 12 | 89 | 0.61 | 0.92 | 0.85 | 0.92 | 0.85 | 0.75 | 0.90 | 0.92 | 0.92 |
| FMN | 526 | 146 | 0.52 | 1.00 | 0.98 | 1.00 | 0.98 | 0.99 | 0.98 | 1.00 | 0.98 |
| GEMM | 455 | 76 | 0.51 | 0.64 | 0.98 | 0.71 | 0.98 | 0.45 | 0.98 | 0.57 | 0.97 |
| glmS | 150 | 185 | 0.45 | 0.97 | 0.97 | 0.97 | 0.97 | 0.96 | 0.97 | 0.96 | 0.97 |
| glycine | 1370 | 176 | 0.54 | 1.00 | 1.00 | 1.00 | 1.00 | 1.00 | 1.00 | 1.00 | 1.00 |
| lysine | 314 | 182 | 0.44 | 0.86 | 0.97 | 0.71 | 0.97 | 0.79 | 0.97 | 0.74 | 0.97 |
| OLE | 24 | 604 | 0.58 | 1.00 | 1.00 | 1.00 | 0.86 | 1.00 | 1.00 | 1.00 | 1.00 |
| preQ1-I | 81 | 68 | 0.48 | 0.28 | 0.96 | 0.49 | 0.98 | 0.32 | 1.00 | 0.44 | 1.00 |
| purine | 235 | 102 | 0.52 | 0.96 | 0.97 | 0.98 | 0.97 | 0.98 | 0.97 | 0.99 | 0.97 |
| RNaseP | 4253 | 296 | 0.50 | 0.85 | 1.00 | 0.82 | 1.00 | 0.84 | 1.00 | 0.86 | 1.00 |
| SAM-I | 705 | 124 | 0.50 | 0.95 | 0.99 | 0.94 | 0.99 | 0.92 | 0.99 | 0.91 | 0.99 |
| SMK | 34 | 196 | 0.30 | 0.09 | 0.60 | 0.09 | 0.38 | 0.09 | 0.50 | 0.09 | 0.60 |
| SRP-bact | 1823 | 99 | 0.43 | 0.61 | 0.99 | 0.65 | 0.99 | 0.14 | 0.98 | 0.65 | 0.99 |
| tbox | 2378 | 229 | 0.37 | 0.80 | 0.97 | 0.70 | 0.97 | 0.83 | 0.97 | 0.88 | 0.98 |
| tmRNA | 1486 | 360 | 0.38 | 0.84 | 0.98 | 0.84 | 0.94 | 0.85 | 0.98 | 0.83 | 0.98 |
| TPP | 2341 | 103 | 0.45 | 0.85 | 0.99 | 0.98 | 0.99 | 0.93 | 0.99 | 0.84 | 0.99 |
| ydaO | 223 | 166 | 0.40 | 0.98 | 1.00 | 0.98 | 1.00 | 0.98 | 0.95 | 0.97 | 0.96 |
| ykkC | 171 | 145 | 0.45 | 0.81 | 0.99 | 0.79 | 0.97 | 0.75 | 1.00 | 0.58 | 1.00 |
| ykoK | 108 | 179 | 0.56 | 1.00 | 0.99 | 0.99 | 0.99 | 1.00 | 0.99 | 1.00 | 0.99 |
| ylbH | 21 | 157 | 0.60 | 1.00 | 1.00 | 0.95 | 1.00 | 1.00 | 1.00 | 0.95 | 1.00 |
| yybP | 582 | 129 | 0.35 | 0.14 | 0.99 | 0.15 | 0.99 | 0.09 | 0.98 | 0.15 | 0.99 |
| median | 0.85 | 0.99 | 0.84 | 0.98 | 0.84 | 0.98 | 0.86 | 0.99 | |||
| Number of shaded rows | 13 | 13 | 7 | 11 | |||||||
As Table 2 shows, almost all of the best CM scans had > 90% PPV, meaning that there were very few false positives. All four homology search methods did exceptionally well on FMN, glycine, OLE, ydaO, ykoK, and ylbH, recovering almost 100% of the known ncRNAs despite having the scanning motifs predicted from only a small subset of them. As shown in Table 3, the best glycine riboswitch-containing cluster in all four homology search methods contained no more than 14 glycine riboswitches, and the cluster PPVs were approximately 0.80, yet that was sufficient for CMfinder to find a strong motif allowing essentially perfect recovery of all 1370 known instances (Fig. 2). SMK had poor CM scan results, and it was discovered that none of the SMK-containing clusters had more than one SMK instance present, making the motif-finding task impossible. yybP also did poorly, and two possible contributing factors are low conservation (percent identity is 0.35, the second lowest in the Table) and small representation in the training set (only 24 examples). However, besides SMK and yybP, all other families gave encouraging results. A look at the glmS clusters in Table 3 that produced the best CM scans shows that CMfinder was capable of predicting good motifs even when the fraction of ncRNA-containing sequences was low, except for SSEARCH, the cluster PPV was below 0.5. As another interesting example, none of the BLAST-based methods puts more than 15–19 of the 379 tboxes into a single cluster (a notable case where SSEARCH excelled), yet the CMfinder motif in all cases achieved at least 70% sensitivity on the 2378 tboxes in the full test set.
Table 3.
Clusters that gave the best CM scan result in Table 2. count = number of ncRNAs of that family in the particular cluster (TP), ppv= positive predictive value.
|
folded-BLAST |
WU-BLAST |
NCBI-BLAST |
SSEARCH |
|||||
|---|---|---|---|---|---|---|---|---|
| Family | count | ppv | count | ppv | count | ppv | count | ppv |
| 6S | 23 | 0.68 | 13 | 0.62 | 13 | 0.81 | 17 | 0.94 |
| AdoCbl | 25 | 0.89 | 14 | 0.57 | 28 | 0.74 | 21 | 0.91 |
| COG4708 | 2 | 0.40 | 2 | 0.40 | 2 | 0.40 | 2 | 0.40 |
| FMN | 34 | 0.85 | 20 | 0.81 | 35 | 0.80 | 28 | 0.65 |
| GEMM | 9 | 0.20 | 9 | 0.19 | 6 | 0.24 | 7 | 0.78 |
| glmS | 13 | 0.50 | 7 | 0.41 | 14 | 0.38 | 12 | 0.86 |
| glycine | 14 | 0.78 | 9 | 0.71 | 14 | 0.82 | 12 | 0.63 |
| lysine | 19 | 0.83 | 14 | 0.65 | 24 | 0.83 | 20 | 0.83 |
| OLE | 5 | 0.83 | 5 | 0.50 | 5 | 0.83 | 5 | 0.63 |
| preQ1-I | 3 | 0.75 | 3 | 0.60 | 3 | 1.00 | 3 | 0.60 |
| purine | 19 | 0.53 | 15 | 0.85 | 21 | 0.60 | 27 | 0.66 |
| RNaseP | 8 | 0.80 | 8 | 0.36 | 8 | 0.31 | 7 | 0.44 |
| SAM-I | 14 | 0.82 | 8 | 1.00 | 48 | 0.91 | 46 | 0.88 |
| SMK | 1 | 0.04 | 1 | 0.08 | 1 | 0.08 | 1 | 0.03 |
| SRP-bact | 12 | 0.75 | 22 | 0.52 | 4 | 0.11 | 28 | 0.78 |
| tbox | 15 | 0.65 | 15 | 0.63 | 19 | 0.95 | 45 | 0.94 |
| tmRNA | 24 | 0.77 | 24 | 0.75 | 25 | 0.76 | 24 | 0.77 |
| TPP | 19 | 0.79 | 26 | 1.00 | 51 | 0.94 | 41 | 0.87 |
| ydaO | 9 | 0.82 | 8 | 0.65 | 15 | 0.33 | 14 | 0.82 |
| ykkC | 6 | 1.00 | 2 | 0.75 | 4 | 1.00 | 5 | 1.00 |
| ykoK | 21 | 0.95 | 10 | 0.63 | 19 | 0.83 | 18 | 0.86 |
| ylbH | 4 | 0.80 | 2 | 0.17 | 4 | 0.80 | 3 | 0.50 |
| yybP | 3 | 0.99 | 4 | 0.99 | 2 | 0.98 | 4 | 0.99 |
Fig. 2.
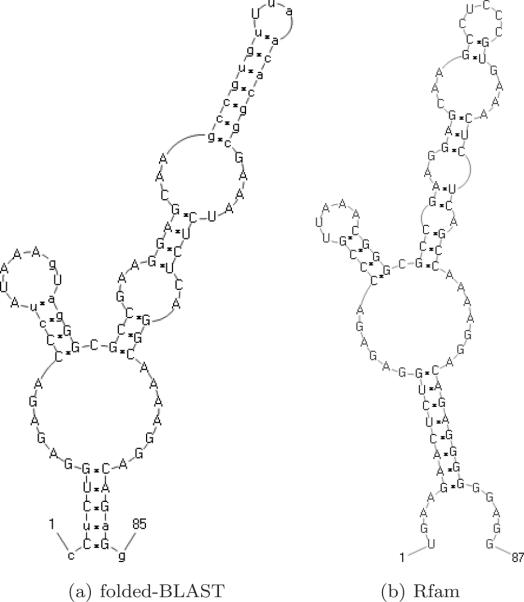
Consensus motif comparison. (a) Predicted structure of best glycine riboswitch cluster for folded-BLAST. Other homology methods produced highly similar structures and are therefore omitted. (b) Rfam annotated consensus structure.
Except for the preQ1-1 family, folded-BLAST had CM scan results that were comparable to if not better than the other three homology search methods. However, most CM scan results were relatively good and different methods failed on different families, making it difficult to declare that one method had a significant edge over the others.
4. Discussion and Future Work
We designed an IGR-oriented pipeline for discovering ncRNAs on a genomic scale and evaluated it against a known set of ncRNAs. Results indicate that the pipeline is capable of producing clusters of homologous sequences that are sufficiently homogeneous for productive motif prediction and scanning. We have also designed a novel method for incorporating secondary structure information efficiently in homology search, and have shown that it at least marginally improves performance. Below we address several aspects of the pipeline that could benefit from improvement.
4.1. Maximum cluster size
In this study, we use a fixed maximum cluster size of 50 for motif-finding. An alternative idea would be to define clusters by a score threshold. However, in the pre-cluster processing we merge nodes and change edge weights, so some scores are no longer the original homology bit scores. We also observe that the cluster scores vary greatly, and it would probably be difficult to determine a score threshold that works for all trees. Another approach is to use CMfinder results as feedback to iteratively add or remove members until most cluster members are predicted as containing a motif instance. One approach we are currently working on, somewhat akin to Will et al.,17 is to use small clusters (say, 5 or 10), run those through CMfinder to produce motifs, and cluster the motifs using a heuristic alignment algorithm. This approach has the advantage of not being confined to the topology of the tree. If two clusters are far apart in the tree yet produce similar motifs, they can be combined to refine the consensus structure.
4.2. Merging and clustering
In pre-processing the homology hits, we merged overlapping homologous segments based on the assumption that either algorithmic heuristics or evolutionary divergence caused the programs to fail to capture full length homologous ncRNAs. We have neither deeply investigated this assumption nor determined an optimal merging strategy. It is also not certain that WPGMA, or any hierarchical clustering method, is the right approach.
4.3. Combining different phyla
The set of input genomic sequences we used for evaluating our pipeline contained species from different phyla. It is not clear whether combining sequences from different phyla will benefit ncRNA discovery, although some preliminary work (not shown) seemed to indicate no advantage. We observed a few clusters from our evaluation that contained riboswitches from different phyla. However, since the input set was predominantly Firmicutes, and there were very few known ncRNAs in Cyanobacteria and other non-Firmicutes species, we do not yet have a clear answer.
4.4.Incorporating secondary structure in homology searches
Evaluation of our folded-BLAST against pure primary sequence homology search methods shows its potential, but there is much room for improvement. A major challenge for this approach is the unreliability of structure predicted from a single sequence. Sliding windows were used to account for alternative base pairings, and prediction must be done on both forward and reverse strand, increasing the search space greatly. Another issue is scoring the homology. We used a handmade scoring matrix that was partially based on scores trained from curated ncRNA alignments. Preliminary tests of homology searches using scoring matrices trained completely from ncRNA alignments, without modification, showed poor results, but perhaps could be improved with better training data.
5. Conclusion
In summary, we have shown that our IGR-oriented pipeline is a promising practical and efficient approach for discovering ncRNAs that requires very little biological information (functional annotations were used only to narrow the search space). It leverages the aggregate information in clusters, even ones built from weak homology matches based only on primary sequence information, often finding this sufficient for effective motif discovery by CMfinder. Although evaluation of the pipeline using different homology search methods did not reveal any program to be consistently better than the others, we observed that our novel method for incorporating secondary structure in homology searches improves discovery for many families, and feel that further investigation of such strategies, as well as strategies for merging and clustering, are warranted.
Supplementary Material
Acknowledgments
This research was funded in part by NIH grant GM 068819 and the Howard Hughes Medical Institute. Thanks to the University of Washington computer architecture group for computing resources.
Biographies

Huei-Hun Tseng received her B.S. in Computer Science and Information Engineering from National Taiwan University in 2004, and worked on biological databases as a research assistant at the National Health Research Institute of Taiwan under Dr. Chi-Ying Huang. She is a Ph.D. student at the Department of Computer Science and Engineering at the University of Washington, and her current work is focused on discovering noncoding RNAs.

Zasha Weinberg received his B.A. in Computer Science from New York University in 1995 and his Ph.D. also in Computer Science from the University of Washington in 2005. His postdoctoral work in the laboratory of Ronald Breaker is focused on the use of bioinformatics to discover novel structured RNA elements.

Jeremy Gore received his B.S. in Botany from the University of Texas in 1997 and his Ph.D. in Biology from Yale in 2005. He is currently an Analyst Programmer with Tessella Inc., providing analysis, design, development, and support for scientific research in industry.
Ronald R. Breaker holds the Henry Ford II Professorship in the Department of Molecular, Cellular and Developmental Biology at Yale University, is jointly appointed as a Professor in the Department of Molecular Biophysics and Biochemistry, and is an Investigator with the Howard Hughes Medical Institute. He received his B.S. degree in Biology from the University of Wisconsin–Stevens Point (1987) and his Ph.D. degree in Biochemistry from Purdue University (1992). After completing his postdoctoral research at the Scripps Research Institute (1995), Dr. Breaker established his laboratory at Yale University where he conducts research on the biochemical functions of nucleic acids.

Walter L. Ruzzo received his B.S. in Mathematics from the California Institute of Technology in 1968, his Ph.D. in Computer Science from the University of California at Berkeley in 1978, and has been with the University of Washington since 1977, where he is Professor of Computer Science and Engineering, Adjunct Professor of Genome Sciences and a Joint Member of the Fred Hutchinson Cancer Research Center. His research is focused on development of computational methods and tools applicable to practical problems in molecular biology, most recently focusing on discovery of noncoding RNAs.
Footnotes
Online supplement at http://bio.cs.washington.edu/supplements/lachesis/ncRNA_JBCB_Supp
We use this definition throughout the evaluation: we refer to ncRNAs as being “covered” or “contained” by sequences if and only if the overlap is at least 50% of the ncRNA length or 50 nts (whichever is smaller).
References
- 1.Winkler WC. Riboswitches and the role of noncoding RNAs in bacterial metabolic control. Curr Opin Chem Biol. 2005;9:594–602. doi: 10.1016/j.cbpa.2005.09.016. [DOI] [PubMed] [Google Scholar]
- 2.Rivas E, Eddy SR. Noncoding RNA gene detection using comparative sequence analysis. BMC Bioinformatics. 2001;2 doi: 10.1186/1471-2105-2-8. [DOI] [PMC free article] [PubMed] [Google Scholar]
- 3.Yao Z, Barrick J, Weinberg Z, Neph S, Breaker RR, Tompa M, Ruzzo WL. A computational pipeline for high-throughput discovery of cis-regulatory noncoding RNA in prokaryotes. PLoS Comput Biol. 2007;3(7) doi: 10.1371/journal.pcbi.0030126. [DOI] [PMC free article] [PubMed] [Google Scholar]
- 4.Yao Z, Weinberg Z, Ruzzo WL. CMfinder — a covariance model based RNA motif finding algorithm. Bioinformatics. 2006;22(4):445–452. doi: 10.1093/bioinformatics/btk008. [DOI] [PubMed] [Google Scholar]
- 5.Griffiths-Jones S, Moxon S, Marshall M, Khanna A, Eddy SR, Bateman A. Rfam: annotating non-coding RNAs in complete genomes. Nucleic Acids Res. 2005;33(Database issue):121–124. doi: 10.1093/nar/gki081. [DOI] [PMC free article] [PubMed] [Google Scholar]
- 6.Weinberg Z, Barrick JE, Yao Z, Roth A, Kim JN, Gore J, Wang JX, Lee ER, Block KF, Sudarsan N, Neph S, Tompa M, Ruzzo WL, Breaker RR. Identification of 22 candidate structured RNAs in bacteria using the CMfinder comparative genomics pipeline. Nucleic Acids Res. 2007;35(14):4809–4819. doi: 10.1093/nar/gkm487. [DOI] [PMC free article] [PubMed] [Google Scholar]
- 7.Meyer MM, Roth A, Chervin SM, Garcia GA, Breaker RR. Confirmation of a second natural preQ1 aptamer class in Streptococcaceae bacteria. RNA. 2008;14(4):685–695. doi: 10.1261/rna.937308. [DOI] [PMC free article] [PubMed] [Google Scholar]
- 8.Sudarsan N, Lee ER, Weinberg Z. A riboswitch class in eubacteria senses the second messenger cyclic di-GMP. 2008 doi: 10.1126/science.1159519. submitted. [DOI] [PMC free article] [PubMed] [Google Scholar]
- 9.Regulski EE, Moy RH, Weinberg Z, Barrick JE, Yao Z, Ruzzo WL, Breaker RR. A widespread riboswitch candidate that controls bacterial genes involved in molybdenum cofactor and tungsten cofactor metabolism. Mol Microbiol. 2008;68(4):918–932. doi: 10.1111/j.1365-2958.2008.06208.x. [DOI] [PMC free article] [PubMed] [Google Scholar]
- 10.Wang JX, Lee ER, Morales DR, Lim J, Breaker RR. Riboswitches that sense S-adenosylhomocysteine and activate genes involved in coenzyme recycling. Mol Cell. 2008;29(6):691–702. doi: 10.1016/j.molcel.2008.01.012. [DOI] [PMC free article] [PubMed] [Google Scholar]
- 11.Weinberg Z, Regulski EE, Hammond MC, Barrick JE, Yao Z, Ruzzo WL, Breaker RR. The aptamer core of SAM-IV riboswitches mimics the ligand-binding site of SAM-I riboswitches. RNA. 2008;14(5):822–828. doi: 10.1261/rna.988608. [DOI] [PMC free article] [PubMed] [Google Scholar]
- 12.Kim JN, Roth A, Breaker RR. Guanine riboswitch variants from Mesoplasma florum selectively recognize 2'-deoxyguanosine. Proc Natl Acad Sci USA. 2007;104(41):16092–16097. doi: 10.1073/pnas.0705884104. [DOI] [PMC free article] [PubMed] [Google Scholar]
- 13.Freyhult EK, Bollback JP, Gardner PP. Exploring genomic dark matter: A critical assessment of the performance of homology search methods on noncoding RNA. Genome Res. 2007;17(1):117–125. doi: 10.1101/gr.5890907. [DOI] [PMC free article] [PubMed] [Google Scholar]
- 14.Altschul SF, Gish W, Miller W, Myers EW, Lipman DJ. Basic local alignment search tool. J Mol Biol. 1990;215(3):403–410. doi: 10.1016/S0022-2836(05)80360-2. [DOI] [PubMed] [Google Scholar]
- 15.Gish W. 1996–2004 < http://blast.wustl.edu >.
- 16.Pearson WR. Flexible sequence similarity searching with the FASTA3 program package. Methods Mol Biol. 2000;132:185–219. doi: 10.1385/1-59259-192-2:185. [DOI] [PubMed] [Google Scholar]
- 17.Will S, Reiche K, Hofacker IL, Stadler PF, Backofen R. Inferring noncoding RNA families and classes by means of genome-scale structure-based clustering. PLoS Comput Biol. 2007;3(4):e65. doi: 10.1371/journal.pcbi.0030065. [DOI] [PMC free article] [PubMed] [Google Scholar]
- 18.Missal K, Zhu X, Rose D, Deng W, Skogerbo G, Chen R, Stadler PF. Prediction of structured non-coding RNAs in the genomes of the nematodes Caenorhabditis elegans and Caenorhabditis briggsae. J Exp Zoolog B Mol Dev Evol. 2006;306(4):379–392. doi: 10.1002/jez.b.21086. [DOI] [PubMed] [Google Scholar]
- 19.Hofacker IL, Fontana W, Stadler PF, Bonhoeffer LS, Tacker M, Schuster P. Fast folding and comparison of RNA secondary structures. Monatshefte für Chemie. 1994;125:167–188. [Google Scholar]
- 20.Eddy SR. A memory-efficient dynamic programming algorithm for optimal alignment of a sequence to an RNA secondary structure. BMC Bioinformatics. 2002;3(18) doi: 10.1186/1471-2105-3-18. [DOI] [PMC free article] [PubMed] [Google Scholar]
- 21.Pruitt KD, Tatusova T, Maglott DR. NCBI reference sequences (RefSeq): a curated non-redundant sequence database of genomes, transcripts and proteins. Nucleic Acids Res. 2007;35(Database issue):61–65. doi: 10.1093/nar/gkl842. [DOI] [PMC free article] [PubMed] [Google Scholar]
- 22.Barrick JE, Breaker RR. The distributions, mechanisms, and structures of metabolite-binding riboswitches. Genome Biol. 2007;8(11):R239. doi: 10.1186/gb-2007-8-11-r239. [DOI] [PMC free article] [PubMed] [Google Scholar]
- 23.Fuchs RT, Grundy FJ, Henkin TM. S-adenosylmethionine directly inhibits binding of 30S ribosomal subunits to the SMK box translational riboswitch RNA. Proc Natl Acad Sci USA. 2007;104(12):4876–4880. doi: 10.1073/pnas.0609956104. [DOI] [PMC free article] [PubMed] [Google Scholar]
Associated Data
This section collects any data citations, data availability statements, or supplementary materials included in this article.