Abstract
Purpose
To study optic nerve head (ONH) topography parameters measured by Stratus optical coherence tomography (OCT) in normal subjects and to analyze ONH data for differences in relation to disc size, ethnicity, and age.
Methods
Three hundred sixty-seven normal subjects underwent Stratus optical coherence tomography ONH measurement using the fast optic disc scan protocol software package 3.0. Only ONH scans meeting specific qualification criteria were included for data analysis ensuring appropriate scan quality and reliability. ONH topographic parameters of qualified scans were analyzed for differences in regards to optic disc size, age, and ethnicity.
Results
Two hundred and twelve qualified ONH scans were included for data analysis. Mean disc area was 2.27±0.41 mm2 and optic cup area, rim area, and horizontal integrated rim width increased with disc size, whereas vertical integrated rim area did not. Vertical integrated rim area, horizontal integrated rim width, and rim area decreased and cup area increased with age. Mean optic disc area was larger in African-Americans as compared with Hispanics or Whites and this difference was statistically significant.
Conclusions
Optic cup area, rim area, and horizontal integrated rim width correlated to disc size. Vertical integrated rim area, horizontal integrated rim width, rim area, and cup area, changed with age. African-American optic discs had larger disc area measurements as compared with Whites optic discs and this difference was statistically significant.
Keywords: Stratus OCT, optic nerve head, topography, normals
Optic nerve head (ONH) evaluation is essential in the diagnosis and management of patients with glaucomatous optic neuropathy. Qualitative assessment of the optic disc can be obtained by clinical examination and photographic documentation of clinical findings. Clinical optic disc examination and estimation of disc parameters such as optic disc size, optic cup size, optic nerve rim dimensions, and cup/disc ratios can be highly variable and observer dependent. In recent years, new technologies for quantitative and more objective optic disc assessment have become available such as confocal scanning laser ophthalmoscopy [eg, Heidelberg Retina Tomograph (HRT)], scanning laser polarimetry (eg, GDx-VCC), and optical coherence tomography (OCT; eg, Stratus OCT). Using these technologies, quantitative measurements of optic disc size, nerve fiber layer thickness, and optic cup measurements can be performed, and such measurements may be used to help to distinguish healthy optic discs from discs with either glaucomatous or other optic neuropathies.
OCT is an imaging modality that relies on low-coherence interferometry to measure the echo time delay and intensity of backscattered and back reflected light from internal microstructures in biologic tissues. It allows real-time, high-resolution imaging and cross-sectional analysis of the optic disc and retina. Because of its minimally invasive and quick image acquisition combined with high-resolution and cross-sectional image quality, OCT analysis of the optic disc has the potential to become an effective tool in the evaluation and management of patients with established and suspected glaucomatous optic neuropathy.
Recently, the normal reference values for retinal nerve fiber layer (RNFL) thickness analysis using the Stratus OCT analyzer have been established in a cohort of healthy subjects and have been incorporated into the Stratus OCT RNFL analysis software packet.1 In this study, optic disc topographic parameters from the same cohort of normal subjects were analyzed for differences in regards to overall disc area, age, and ethnicity.
METHODS
A multicenter prospective, cross-sectional study was performed at 6 study sites. Approval of the study protocol was obtained from the institutional review board of each study site. For inclusion into the study, candidates had to be ≥18-years-old, able to give informed consent for study participation, and without any contraindicating ophthalmic conditions. Excluded were persons who had known contraindications to pupillary dilation, a history of ocular hypertension or glaucoma in either eye, a reproducible visual field defect in either eye [ie, pattern SD with P<5%, abnormal Glaucoma Hemifield test, and other pattern loss consistent with ocular disease], intraocular surgery (except for uncomplicated cataract or refractive surgery performed more than 1 y before enrollment), best corrected visual acuity worse than 20/32 (Early Treatment Diabetic Retinopathy Study scale) for those aged 60 years and younger and worse than 20/40 for those aged 61 years and above, evidence of active ocular disease in either eye (eg, diabetic retinopathy, diabetic macular edema, age-related macular degeneration or other vitreoretinal disease, and optic nerve or RNFL abnormalities), history of diabetes mellitus, or use of photosensitizing agents by any route within 14 days before study enrollment.
Complete ophthalmic examination was performed on every candidate before enrollment of one eye into the study. Detailed past medical and ocular history were obtained from each subject before enrollment. Ethnicity analysis relied upon self-reported ethnic assignment from included subjects. Ophthalmic evaluation included refraction, best corrected visual acuity (Early Treatment Diabetic Retinopathy Study scale), axial length measurement, pupil examination, intraocular pressure measurement, biomicroscopy, dilated fundus examination, Humphrey visual field testing (HVF 24-2 Swedish Interactive Threshold Algorithm standard threshold protocol both eyes), and fundus photography. Enrollment of right and left eyes was alternated on successive study participants. At each individual study site, enrollment was designed such that close to equal representation of male and female study subjects across a range of age groups (ie, ≤29, 30 to 39, 40 to 49, 50 to 59, 60 to 69, and ≥70-y-old) was achieved.
All optic disc measurements were performed using the Stratus OCT fast optic disc scanning protocol and automated ONH analysis using version 3.0 Stratus OCT analysis software. A maximum of 2 ONH scans of each subject were obtained, the better of the 2 scans (as determined by meeting our study inclusion criteria) was chosen for data analysis. In the Stratus OCT Fastscan protocol, a set of 6 radial intersecting line scans, each at 30-degree intervals, are obtained in a single alignment and capture operation such that each clock hour of the optic nerve is scanned. Topography of the entire optic disc is computed by interpolating to fill the gaps between radial linear scans. Stratus OCT analysis software version 3.0 allows computation of topographic data derived from each individual linear optic disc scan into an integrated analysis characterizing the overall optic disc topography.
In particular the following optic disc parameters are determined:
Disc area: surface area bounded by the optic disc outline; the optic disc outline is identified by marking the end of the retinal pigment epithelial (RPE) layer at the disc margin on either side at the scleral canal and calculating the disc diameter in each individual linear scan; the optic disc outline represents an ellipse that is generated by connecting the RPE markers at each clock hour of the disc.
Vertical integrated rim area (volume): this value offers an estimate of the total RNFL volume in the rim of the optic disc; it is calculated by multiplying the average of the individual rim areas (ie, derived from each individual linear scan) times the circumference of the optic disc.
Horizontal integrated rim width (area): this value is an estimate of the total rim area calculated by multiplying the average of the individual nerve widths times the circumference of the optic disc.
Cup area: surface area bounded by the outline of the optic cup; this outline is determined by locating the cup diameter in each linear scan by a line that is located 150 μm anterior to the disc diameter line and connecting the cup diameter marker for each clock hour.
Rim area: surface area calculated by subtracting the cup area from the disc area.
Cup/disc area ratio: ratio of cup area to disc area.
Cup/disc horizontal area ratio: ratio of the longest horizontal line across the cup to the longest horizontal line across the disc.
Cup/disc vertical area ratio: ratio of the longest vertical line across the cup to the longest vertical line across the disc.
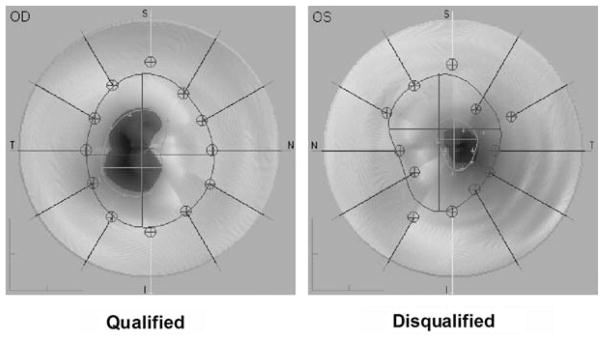
All scans from the original cohort of subjects underwent a study qualification process performed according to selection criteria assuring appropriate scanning quality. Qualifying criteria for inclusion into our study required scans to exhibit a clear fundus image allowing easy identification of optic disc details with all 6 individual radial scans centered over the optic disc, average signal strength of all 6 individual linear scans of at least 7, and appropriate recognition of the anatomic disc margin by the automated optic disc analysis algorithm. Appropriate recognition of the anatomic optic disc margin by the automated ONH analysis algorithm was confirmed by the review of all ONH scans by 3 experienced investigators (B.C.M., L.B.C., and D.W.). Automated ONH analyses that met the following criteria were included (“qualified automated” group): scans with ≤3 RPE reference points off the disc tracing, ≤2 adjacent reference points on the same side of the disc outline off the disc outline, and ≤2 quadrants of the disc tracing with one or more reference points off the disc outline (Fig. 1). Manual correction of the automatic ONH tracing was performed by 2 investigators (L.B.C. and D.W.) on a subset of scans that did not meet the above criteria to maximize the number of interpretable ONH scans. This was carried out by adjusting the ends of the disc line (light blue) to what appeared to be the top inner edges of the retinal pigment epithelium (red on the false color image) for each of the 6 individual radial image scans. After the manual adjustment, the ONH scan was included in the composite analysis if it met the above inclusion criteria (“qualified adjusted” scan group). ONH analysis was performed with an arbitrary optic disc cup offset of 150 μm for every scan; measurements above this threshold were considered neural rim and measurements below were considered optic cup.
FIGURE 1.
ONH scan qualification. The ONH scan shown on the right was disqualified from inclusion in the study due to difficulty of the automated algorithm to reliably recognize the optic disc margin. This is evident by multiple disc margin reference points separated from the disc outline. OD indicates right eye; ONH optic nerve head; OS, left eye.
For some analyses, scan area parameters were adjusted for magnification due to axial length differences, according to previously reported methods.2
Descriptive statistics were performed in SPSS, version 16 (SPSS, Chicago, IL). For comparisons of parametric data (age, axial length, and spherical equivalent), the t test was performed. For comparisons of nominal data (sex, ethnicity, and eye), the Fisher exact test was used. To determine the relationship between various OCT parameters, stepwise linear regression was performed.
RESULTS
A total of 367 normal subjects underwent ONH scanning by Stratus OCT. Each individual ONH scan and its topographic analysis was reviewed according to specific qualification criteria to assure appropriate optic disc recognition and measurement. A total of 212 (58.1%) ONH scans, adequately recognized and measured by the automated disc analysis algorithm, were thus qualified for inclusion into the study. One hundred fifty-five automated ONH scans were disqualified from inclusion due to the following reasons (Table 1): 57 of 155 (36.8%) scans had inappropriate recognition of the anatomic disc margin as determined by the automated ONH analysis algorithm; 67 of 155 (43.2%) scans had an OCT signal strength of less than 7; 2 of 155 (1.3%) scans demonstrated insufficient centration of the 6 radial scans over the analyzed optic disc; and 12 of 155 (7.7%) scans were excluded due to other reasons such as imaging artifacts interfering with optic disc recognition and analysis. Seventeen (11.0%) scans had to be disqualified because the optic disc cup was too small to be recognized by the automated ONH analysis algorithm at a cup offset of 150 μm.
TABLE 1.
Exclusion Criteria
| Criterion | Number | Percent (of 155 Excluded Scans) |
|---|---|---|
| Inappropriate recognition of optic disc margin | 57 | 36.8 |
| Insufficient optic disc scan signal strength | 67 | 43.2 |
| Linear OCT scans insufficiently centered over scanned optic disc | 2 | 1.3 |
| Other reasons, for example, artifacts interfering with reliable analysis | 12 | 7.7 |
| Optic disc cup too small to be recognized by the automated ONH analysis algorithm using a cup offset of 150 μm | 17 | 11.0 |
155 (42.2%) of 367 automated ONH scans were disqualified from inclusion into the normative database.
OCT indicates optical coherence tomography; ONH, optic nerve head.
The Stratus OCT software allows manual adjustment of the optic disc margin reference points and thereby correction of proper disc recognition before topographic disc analysis. Of the 57 scans that were excluded due to inappropriate automated recognition of the disc margin, 46 could be manually corrected to meet the inclusion criteria. ONH data from these 46 subjects were included for composite analysis. Demographic data (Table 2) did not differ significantly between eyes of the manually corrected scans (“adjusted scans”) and the eyes that were qualified by automatic disc recognition (“automated scans”). Whites made up over half of included subjects and Hispanics made up about 30%. The relatively high number of Hispanic study participants is due to the fact that the subjects enrolled from the University of Southern California Medical Center study site were also enrolled in the Los Angeles Latino Eye Study.
TABLE 2.
Demographic Data
| Qualified Automated Scans (n=212) | Qualified Adjusted Scans (n=47) | P | |
|---|---|---|---|
| Sex | |||
| Male | 94 (44.3%) | 23 (48.9%) | 0.63* |
| Female | 118 (55.7%) | 24 (51.1%) | |
| Eye | |||
| Right | 107 (50.5%) | 26 (55.3%) | 0.63* |
| Left | 105 (49.5%) | 21 (44.7%) | |
| Age (mean ± SD in y) | 48.3 ± 15.7 | 46.8 ± 17.1 | 0.57† |
| Range (y) | 18–86 | 20–85 | |
| Spherical equivalent (mean ± SD in diopters) | − 0.43 ± 1.73 | − 0.82 ± 3.00 | 0.42† |
| Range (diopters) | − 6.75±4.75 | − 11.75±6.75 | |
| Axial length (mean ± SD in mm) | 23.84 ± 1.05 | 23.87 ± 1.21 | 0.90† |
| Range (mm) | 21.80–26.99 | 20.37–28.14 | |
| Ethnicity | |||
| Whites | 115 (54.2%) | 30 (63.8%) | 0.26* |
| Hispanic | 66 (31.1%) | 10 (21.3%) | 0.22* |
| African descent | 20 (9.4%) | 3 (6.4%) | 0.78* |
| Asian | 5 (2.4%) | 3 (6.4%) | 0.16* |
| Asian (Indian) | 3 (1.4%) | 0 (0%) | 1.00* |
| Native American | 2 (0.9%) | 0 (0.%) | 1.00* |
| Other/unknown | 1 (0.5%) | 1 (2.1%) | 0.33* |
Fisher exact test.
t test.
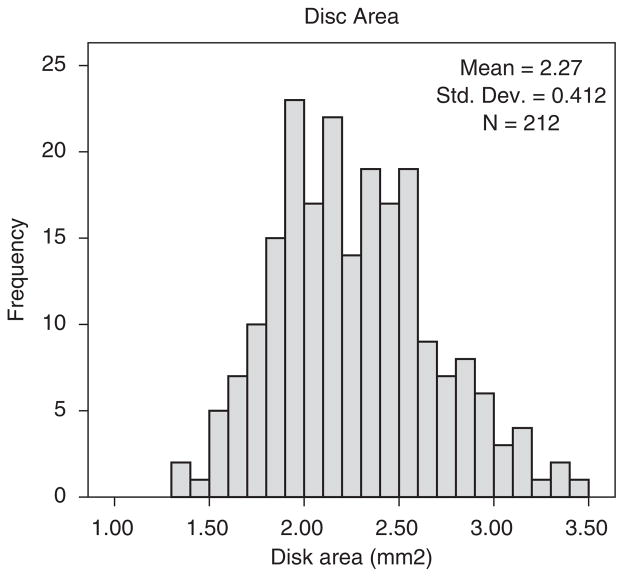
Topographic ONH analysis by the Stratus OCT analysis software provide measurements of the optic disc area, vertical integrated rim area (volume), horizontal integrated rim width (area), cup area, rim area, and cup/disc area ratios. The distribution of optic disc area measurements for the 212 qualified automated scans is shown in Figure 2. Inclusion of the 46 manually adjusted qualified scans did not affect the distribution (mean ± SD disc area: 2.27±0.41 mm2 for automated only scans vs. 2.23±0.42 mm2 for the automated + adjusted scans). However, there were some significant differences between the 212 qualified automated scans and the 46 qualified manually adjusted scans. The manually adjusted scans had a smaller mean disc area (2.07±0.41 vs. 2.27±0.41 mm2, P=0.003, t test), smaller cup area (0.46±0.29 vs. 0.66±0.37 mm2, P = 0.001), smaller cup disc area ratio (0.21±0.11 vs. 0.28±0.13, P = 0.001), smaller vertical cup disc ratio (0.43±0.13 vs. 0.49±0.13, P = 0.007), greater vertical integrated rim area (0.52±0.24 vs. 0.42±0.23 mm2, P = 0.009), and greater horizontal integrated rim width (1.80±0.22 vs. 1.69±0.23 mm2, P=0.005). Interestingly, the mean rim area was similar between the qualified adjusted and automated scans (1.61±0.30 vs. 1.61±0.35 mm2, P=0.97).
FIGURE 2.
Disc area distribution for the 212 qualified automated scans.
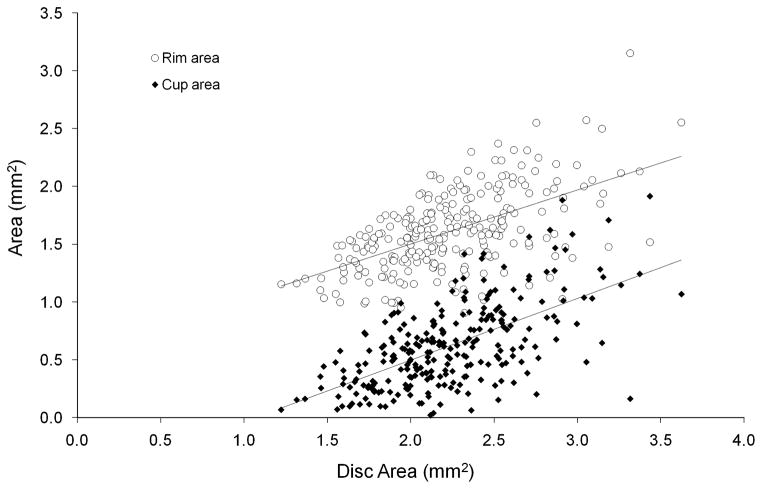
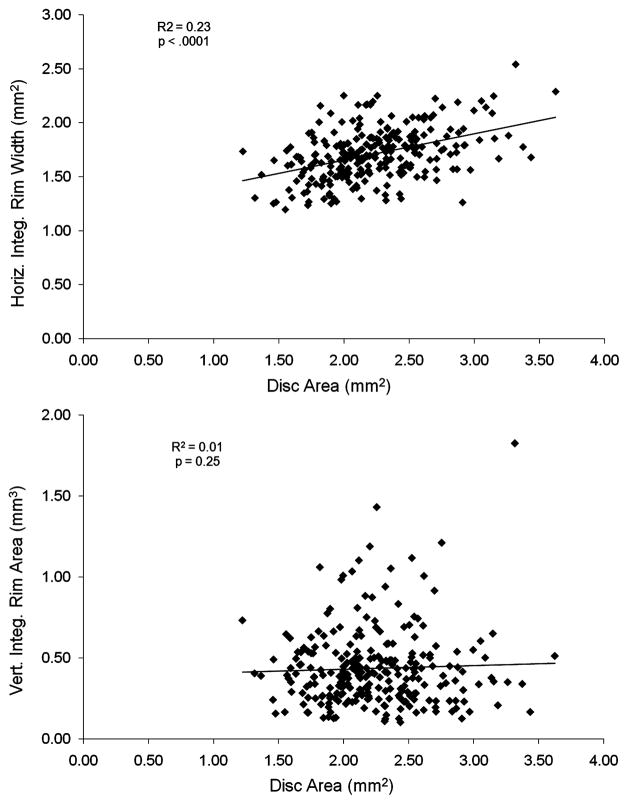
We plotted optic cup and rim area measurements of the 212 qualified automated ONH scans in relation to optic disc size (Fig. 3). Optic cup area increased with larger disc area (R2 = 00.35, P<0.0001, simple linear regression; for the automated scans and R2 = 00.37, P<0.0001, for the automated + adjusted scans). Rim area also increased with disc size. It is important to note that cup area is measured independently of disc area measurement by Stratus OCT, whereas rim area is derived by subtracting cup area from disc area. Horizontal integrated rim width was also greater with larger disc areas (R2 = 0.23, P<0.0001, automated only scans and R2 = 0.19, P<0.0001, automated + adjusted scans), but vertical integrated rim area did not demonstrate a similar trend (R2 = 0.01, P = 0.25, automated only scans and R2 = 0.002, P = 0.52, automated + adjusted scans) (Fig. 4). All other analyzed optic disc parameters (cup area, rim area, cup/disc area ratio, cup/disc horizontal ratio, and cup/disc vertical ratio) also showed a trend to increase with increasing disc size. To avoid analysis bias from manual adjustment, we did not include the adjusted scans in this analysis as they had a significantly smaller disc area compared with the scans qualified by automated disc recognition.
FIGURE 3.
Optic cup area (mm2) and rim area (mm2) in relation to overall disc size for the 212 qualified automated scans. Measurements of optic cup area and rim area increase with larger disc size. Stratus OCT determines optic cup area independent from disc area, whereas optic rim area is deduced directly from disc area and cup area.
FIGURE 4.
Vertical integrated (vert. integ.) rim area and horizontal integrated (horiz. integ.) rim width in relation to optic disc area for the 212 qualified automated scans. Measurements of horizontal integrated rim width increase with larger disc size.
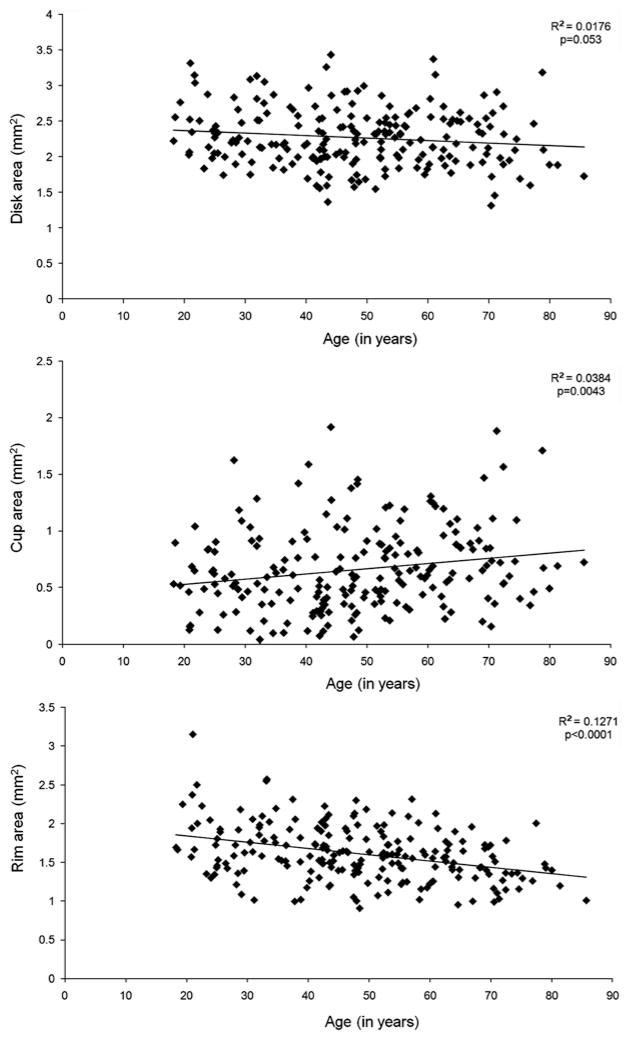
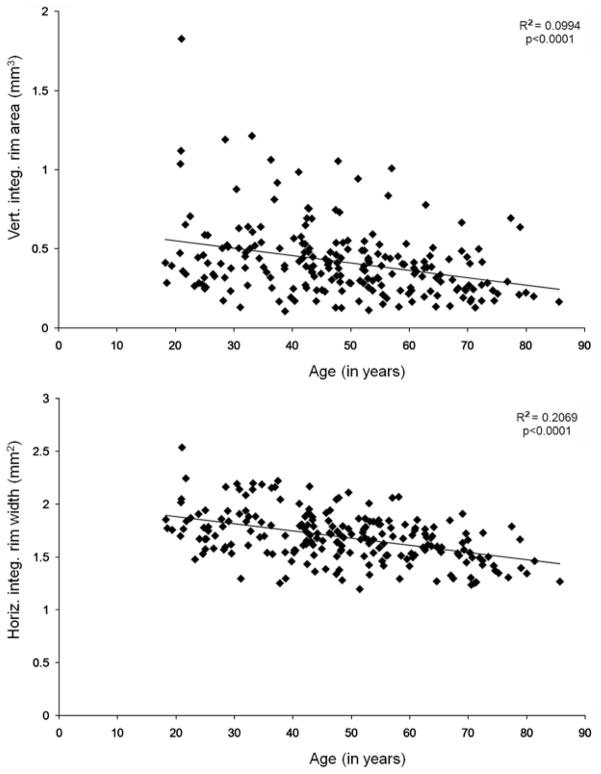
We divided the subjects providing qualified ONH scans by age and analyzed the different ONH parameters (Figs. 5, 6). Disc area remained unchanged with age (r = −0.13, P = 0.053, automated only scans and r = −0.08, P = 0.21, automated + adjusted scans); however, there was a trend for vertical integrated rim area (r = −0.32, P<0.0001, automated only scans and r = −0.29, P<0.0001, automated + adjusted scans), horizontal integrated rim width (r = −0.45, P<0.0001, automated only scans and r = −0.42, P<0.0001, automated + adjusted scans), and rim area (r = −0.36, P<0.0001, automated only scans and r = −0.29, P<0.0001, automated + adjusted scans) to decrease with age, and cup area (r = 0.20, P = 0.043, automated only scans and r = 0.19, P = 0.002, automated+ adjusted scans) to increase with age.
FIGURE 5.
Disc area, cup area, and rim area were analyzed in relation to age. Cup area increased with age and rim area decreased with age.
FIGURE 6.
Horizontal integrated (horiz. integ.) rim width and vertical integrated (vert. integ.) rim area were analyzed in relation to age. Horizontal integrated rim width and vertical integrated rim area decrease with age.
The 3 major subject groups of our study cohort were of White, Hispanic, or African-American ethnicity. For these groups, we performed analysis of OCT ONH measurements by ethnicity, based on the 212 qualified automated scans. Mean disc area was 2.17 mm2 (95% reference range: 1.56 to 2.99 mm2) for Whites, 2.33 mm2 (95% reference range: 1.67 to 3.09 mm2) for Hispanics, and 2.49 mm2 (95% reference range: 1.80 to 3.24 mm2) for African-Americans. These differences were statistically significant [P = 0.001, analysis of variance (ANOVA); Whites vs. African-Americans P=0.003, Whites vs. Hispanics P = 0.047, Hispanic vs. African-American P = 0.196, Tukey posttest]. When the disc area is adjusted for axial length magnification,2 the mean disc areas was 2.05 mm2 (95% reference range: 1.45 to 2.95 mm2) for Whites, 2.17 mm2 (95% reference range: 1.56 to 2.96 mm2) for Hispanics, and 2.38 mm2 (95% reference range: 1.65 to 3.35 mm2) for African-Americans. The differences between Whites and African-American disc areas remained statistically significant (P = 0.003, ANOVA, Tukey posttest) after adjusting for axial length magnification. The means for vertical integrated rim area, horizontal integrated rim width, rim area, cup area, and cup-to-disc area ratio were compared for each group using a 1-way ANOVA with Tukey posttest and no statistical ethnic differences were found, whether or not an adjustment was made for magnification due to axial length differences.
A total of 67 ONH scans were disqualified from inclusion into data analysis due to insufficient OCT signal strength. We performed a limited age analysis of included scans and scans that were excluded due to low signal strength to determine whether a larger proportion of subjects who provided scan with low signal strength were above 60 years of age. Using Fisher exact testing, no statistically significant difference was found in the number of included and excluded scans provided by subjects above 60 years of age (P = 1.00), and for both included and excluded scans about one third of the subjects were above 60 years of age.
DISCUSSION
With the development of optic disc imaging technologies such as scanning laser ophthalmoscopy, SLO, and OCT, a major goal is to validate their usefulness in allowing early diagnosis of glaucomatous optic neuropathy and longitudinal study of individual ONHs over time. To allow such utilization, it is necessary to have reliable comparative data establishing the normal ranges of healthy RNFL thickness and optic disc topography. As each different ONH imaging modality is based on different technology and different definitions used for locating anatomic sites on the optic disc, it is not surprising that, although several studies have demonstrated good agreement between overall disc classification measured by different image modalities, significant differences have been found when comparing specific topographic markers.3,4 Reproducibility of optic disc and RNFL analysis using OCT has been established in previous studies.5,6
Normative reference values for RNFL thickness have previously been established.1 We have used the same cohort of healthy volunteers to study Stratus OCT ONH topographic measurements in regards to disc size, age, and ethnicity. Topographic optic disc data obtained with the OCT fast optic disc scanning protocol and automated ONH analysis were analyzed from a total of 212 normal subjects. In contrast to previous studies measuring optic disc topography with Stratus OCT in healthy subjects,1,4 we decided to rely on the automated Stratus OCT optic disc analysis software algorithm to detect the optic disc contour rather than allowing manual correction in case the RPE/choriocapillaris border was inappropriately recognized. For this reason, we first subjected all collected ONH scans to a qualification protocol and allowed only scans with appropriate scan quality and optic disc recognition to be included for statistical analysis. As a control, for about one-third of the disqualified scans, we were able to manually adjust the optic disc margins to meet our inclusion criteria. Overall, these 47 manually adjusted scans were similar to the 212 qualified automated scans.
At onset of this study, 367 normal subjects underwent Stratus OCT ONH analysis; 155 (42.2%) scans were disqualified according to our quality control criteria. The most common reason for scan disqualification was inappropriate automated recognition of the optic disc margin. Potential reasons for inappropriate automated disc recognition are optic disc tilting, peripapillary atrophy, or hyperpigmentation. Although significant ophthalmic comorbidities were absent in our study population, subclinical peripapillary atrophy or hyperpigmentation and optic disc tilting within the normal limits of optic disc anatomy may have contributed to difficulty with automated Stratus OCT disc recognition. Few scans had to be excluded due to scanning artifact such as vascular overlay or insufficient scan centration over the optic disc.
Appropriate OCT signal strength is necessary for reliable RNFL measurements.7 Our qualification protocol therefore required appropriate scan signal strength for inclusion of ONH analysis into our study. To our surprise a large number of ONH scans had to be excluded due to insufficient signal strength. The majority of these scans were performed at 2 of the study sites with clusters of poor quality scans performed on specific dates thus suggesting a technical or technician-related cause. At the time of data collection using Stratus OCT software rev. 3.0, scan quality metrics had not yet been established and instrument technicians did not have the benefit of immediate signal strength feedback. This feature was added in rev. 4.0 software. Thus, imposing current scan quality standards, a total of 67 scans were disqualified from our study due to low signal strength. However, we would expect that clinical data collected with the software upgrade would be of higher overall quality, simply because image quality metrics are now provided immediately after the scan is taken and users are instructed to reacquire any scans not meeting optimal scan criteria.
OCT signal strength may be influenced by optical media opacification such as cataract, corneal pathology, vitreous opacities, etc; however, in our study subjects’ significant ophthalmic comorbidities were absent. In comparison, during establishment of the RNFL normative database only 31 of 359 (8.3%) scans were excluded.1 Medeiros et al8 studied the ability of RNFL, macular, and ONH parameters measured by Stratus OCT to detect glaucomatous optic neuropathy. OCT scans were obtained from 78 healthy subjects including RNFL, macular, and optic disc scans; certain quality standard were applied to all scan modalities and a total of 23 (12%) scans had to be excluded due to insufficient scan quality. The qualification criteria for this study were not specified in detail, therefore differences in overall disqualification rate may not only relate to overall number of subjects scanned but also to the qualification criteria that were applied. Our finding of a large number of disqualified scans due to poor OCT signal strength and inappropriate automated disc recognition suggests that even under “ideal” examination conditions, appropriate scan quality may be difficult to obtain and expertise in image acquisition and interpretation is required to optimize ONH image quality and analysis. Caution is necessary when interpreting Stratus OCT ONH analysis to ensure correct optic disc border detection. A limited age analysis of the scans excluded due to low signal strength did not show a statistically significant difference in age make-up between included and excluded scans, therefore suggesting that older age was not responsible for the high rate of low signal strength scans in our study population.
In our study, 17 (11.0%) scans had to be disqualified because the optic disc cup was too small to be recognized by the automated ONH analysis algorithm at a cup offset of 150 μm. In this situation, the analysis software recognized rim area, cup area, and cup volume as 0 and the cup/disc area ratios as 1, which did not reflect the true measurements of the small optic cup. This finding represents an analysis artifact caused by the arbitrary definition of the optic disc cup by selection of a cup offset. The clinician needs to be aware of this calculation error in the clinical evaluation of ONH topography in optic discs with very small cups.
In 2003, Schuman et al4 performed a comparative analysis of topographic optic disc measurements performed with HRT and Stratus OCT in normal and glaucomatous subjects. In their cohort, a total 13 normal subjects underwent ONH analysis by Stratus OCT. Paunescu et al6 studied reproducibility of ONH measurements using Stratus OCT of 10 healthy subjects. Medeiros et al8 used Stratus OCT scans of ONHs from 78 normal subjects as controls in their study. The ONH normative values established in our analysis are overall very similar and consistent with the previously published normal ONH data measured by Stratus OCT; however, the number of included ONH scans was significantly larger in our study as compared with the previously published studies.
Previous studies have suggested a correlation of neuroretinal rim area and optic cup area to the optic disc area.9–11 Budenz et al1 have demonstrated thicker RNFLs in larger optic discs. Our data also suggest a proportional increase in optic cup and rim areas in larger optic discs; furthermore, there seems to be a similar correlation between the Stratus OCT horizontal integrated rim width and disc area. An increase in OCT-determined rim area is to be expected with larger disc size as this parameter is directly derived from disc area and cup area. Comparative analysis of cup area and horizontal integrated rim width in relationship to overall disc size may prove useful in the clinical distinction of ONHs with physiologically large optic cups or optic discs with glaucomatous changes.
Although small effects of aging have been demonstrated on the imaging of optic disc and RNFL, it is important to consider potential age related effects on optic nerve topography.12 Our data suggest a normal, age-related decrease in vertical integrated rim area, horizontal integrated rim width, and rim area and an age-related increase in cup area. This finding reinforces the need to adjust ONH parameters for age.
Limited analysis of ethnic differences among ONH parameters measured with Stratus OCT revealed statistically significant differences in mean disc area between Whites, Hispanic, and African-American optic discs. The mean African-American optic disc area was significantly larger than that of Whites optic discs. These differences are consistent with previously published data established in patients with ocular hypertension by HRT13 or in normal subjects established by analysis of stereo disc photography. 14 One limitation of our data analysis is that ethnicity data purely relied on self-reported ethnic association which may influence and limit the reliability of ethnicity data obtained in this study.
In summary, we have studied optic disc parameters such as disc area, vertical integrated rim area, horizontal integrated rim width, rim area, cup area, overall cup/disc area ratio, and horizontal and vertical cup/disc area ratios in a large group of healthy subjects. To our knowledge this is to date the largest study of optic disc topography measurement of healthy subjects using Stratus OCT. Differences in optic nerve topography were noted in relation to overall disc size and with age. African-American optic discs had larger disc area measurements as compared with Whites optic discs and this difference was statistically significant. A large number of ONH scans in our cohort had to be excluded due to poor disc contour recognition emphasizing the need for caution when interpreting OCT ONH analysis. We believe establishing normal reference values for ONH topographic parameters are a valuable tool for utilization of Stratus OCT optic disc analysis in clinical practice for diagnosis and longitudinal follow-up of glaucomatous and other optic neuropathies. In light of continuously evolving technologies for optic nerve fiber and topographic analysis (eg, spectral domain OCT), it is important to realize that normative reference values need to be established for each individual technology. However, knowledge of fundamental relationships of ONH topography in relation to disc size, age, and ethnic differences as determined in this study may aid in further studies and application of these newer imaging technologies.
Acknowledgments
Funding/Support: Carl Zeiss Meditec, Inc, Dublin, CA.
Footnotes
Financial Disclosures: None. Barbara C. Marsh (now employed by Eye Associates of New Mexico, Albuquerque, NM); Rohit Varma, and V. Michael Patella employed by Carl Zeiss Meditec, Inc, Dublin, CA; Jennifer Lipyanik previously employed by Carl Zeiss Meditec, Inc, Dublin, CA (now employed by Cutera, Brisbane, CA); Donald Budenz received lecture fees from Carl Zeiss Meditec, Inc; David Greenfield received consulting fees and grant support from Carl Zeiss Meditec, Inc; Joel Schuman received consulting and lecture fees and is an inventor of OCT from Carl Zeiss Meditec, Inc.
References
- 1.Budenz DL, Anderson DR, Varma R, et al. Determinants of normal retinal nerve fiber layer thickness measured by Stratus OCT. Ophthalmology. 2007;114:1046–1052. doi: 10.1016/j.ophtha.2006.08.046. [DOI] [PMC free article] [PubMed] [Google Scholar]
- 2.Leung CK, Cheng AC, Chong KK, et al. Optic disc measurements in myopia with optical coherence tomography and confocal scanning laser ophthalmoscopy. Invest Ophthalmol Vis Sci. 2007;48:3178–1383. doi: 10.1167/iovs.06-1315. [DOI] [PubMed] [Google Scholar]
- 3.Hoffman EM, Bowd C, Medeiros FA, et al. Agreement among 3 optical imaging methods for the assessment of optic disc topography. Ophthalmology. 2005;112:2149–2156. doi: 10.1016/j.ophtha.2005.07.003. [DOI] [PubMed] [Google Scholar]
- 4.Schuman JS, Wollstein G, Farra T, et al. Comparison of optic nerve head measurements obtained by optical coherence tomography and confocal scanning laser ophthalmoscopy. Am J Ophthalmol. 2003;135:504–512. doi: 10.1016/s0002-9394(02)02093-7. [DOI] [PubMed] [Google Scholar]
- 5.Olmedo M, Cadarso-Suarez C, Gomez-Ulla F, et al. Reproducibility of optic nerve head measurements obtained by optical coherence tomography. Eur J Ophthalmol. 2005;15:486–492. doi: 10.1177/112067210501500412. [DOI] [PubMed] [Google Scholar]
- 6.Paunescu LA, Schuman JS, Price LL, et al. Reproducibility of nerve fiber layer thickness, macular thickness, and optic nerve head measurements using Stratus OCT. Invest Ophthalmol Vis Sci. 2004;45:1716–1724. doi: 10.1167/iovs.03-0514. [DOI] [PMC free article] [PubMed] [Google Scholar]
- 7.Cheung CY, Leung CK, Lin D, et al. Relationship between retinal nerve fiber layer measurement and signal strength in optical coherence tomography. Ophthalmology. 2008;115:1347–1351. doi: 10.1016/j.ophtha.2007.11.027. [DOI] [PubMed] [Google Scholar]
- 8.Medeiros FA, Zangwill LM, Bowd C, et al. Evaluation of retinal nerve fiber layer, optic nerve head, and macular thickness measurements for glaucoma detection using optical coherence tomography. Am J Ophthalmol. 2005;139:44–55. doi: 10.1016/j.ajo.2004.08.069. [DOI] [PubMed] [Google Scholar]
- 9.Savini GZ, Zanini M, Carelli V, et al. Correlation between retinal nerve fibre layer thickness and optic nerve head size: an optical coherence tomography study. Br J Ophthalmol. 2005;89:489–492. doi: 10.1136/bjo.2004.052498. [DOI] [PMC free article] [PubMed] [Google Scholar]
- 10.Jonas JB, Gusek GC, Naumann GO. Optic Disc, cup and neuroretinal rim size, configuration and correlations in normal eyes. Invest Ophthalmol Vis Sci. 1988;29:1151–1158. [PubMed] [Google Scholar]
- 11.Caprioli J, Miller JM. Optic disc rim area is related to disc size in normal subjects. Arch Ophthalmol. 1987;105:1683–1685. doi: 10.1001/archopht.1987.01060120081030. [DOI] [PubMed] [Google Scholar]
- 12.Bowd C, Zangwill LM, Blumenthal EZ, et al. Imaging of the optic disc and retinal nerve fiber layer: the effects of age, optic disc area, refractive error, and gender. J Opt Soc Am A Opt Image Sci Vis. 2002;19:197–207. doi: 10.1364/josaa.19.000197. [DOI] [PubMed] [Google Scholar]
- 13.Zangwill LM, Weinreb RN, Berry CC, et al. Racial differences in optic disc topography. Arch Ophthalmol. 2004;122:22–28. doi: 10.1001/archopht.122.1.22. [DOI] [PubMed] [Google Scholar]
- 14.Varma R, Tielsch JM, Quigley HA, et al. Race-, age-, gender-, and refractive error-related differences in the normal optic disc. Arch Ophthalmol. 1994;112:1068–1076. doi: 10.1001/archopht.1994.01090200074026. [DOI] [PubMed] [Google Scholar]


