

Abstract
Covert attention is associated with prestimulus blood oxygenation level-dependent (BOLD) modulations in visual cortex. In some situations, this preparatory activity can predict how well human subjects will perceive upcoming visual objects. Preparatory activity may mediate this behavioral effect by affecting the stimulus-evoked response, but the relationship between preparatory and stimulus-evoked BOLD modulations is unclear. Here, we examine this relationship by comparing the effects of spatial attention on anticipatory and stimulus-evoked signals and by measuring the trial-to-trial correlation between prestimulus and poststimulus modulations. We find that in extrastriate visual cortex (V4), modulations related to spatial attention are relatively large, extend from prestimulus through the peak of the evoked response, and are slightly larger in the evoked response compared with the prestimulus response. In striate cortex (V1), the frontal eye fields (FEF), and the intraparietal sulcus (IPS), modulations related to spatial attention are relatively small, are confined primarily to the prestimulus period, and are slightly larger in preparatory versus stimulus-evoked activity. Importantly, across visual cortex, the attentional biases (activity for attended versus unattended locations) in preparatory and evoked activity are more positively correlated, trial-by-trial, than would be expected on the basis of activity measured in subjects at rest. We argue that this pattern of results suggests that the same mechanisms underlie preparatory and stimulus-evoked BOLD modulations related to spatial attention and that incoming sensory signals add to preexistent biases in preparatory activity to generate the stimulus-evoked response.
Introduction
The ability to make a perceptual decision depends in large part on the quality of the neuronal sensory signals on which the decision must be made (Britten et al., 1992, 1993, 1996; Shadlen et al., 1996; Uka and DeAngelis, 2003; Heuer and Britten, 2004). The quality of stimulus-evoked signals, in turn, depends on both the quality of the physical stimulus in the environment and internal factors of the observer, such as motivation, perceived reward, and attention (Sugrue et al., 2004; Gold and Shadlen, 2007). Spatial attention in particular has been shown repeatedly to affect stimulus-evoked responses, both at the level of individual neurons (Reynolds and Chelazzi, 2004; Maunsell and Treue, 2006) and averaged across populations of cells, as measured by blood oxygenation level-dependent (BOLD) neuroimaging (Kastner and Ungerleider, 2001; Corbetta and Shulman, 2002; Pessoa et al., 2003). In humans, attention may have an additive effect on the stimulus-evoked BOLD response to visual objects (Buracas and Boynton, 2007). This increased BOLD signal may increase the quality of the representation of attended objects by granting them a competitive advantage over unattended objects for the use of limited neural resources (Desimone and Duncan, 1995).
Interestingly, several studies have shown that, in addition to stimulus-evoked signals, prestimulus neural signals can also predict the accuracy of an upcoming decision (Sapir et al., 2005; Giesbrecht et al., 2006; Sylvester et al., 2007, 2008). Although these “preparatory” signals may aid perceptual decisions by modulating the quality of the sensory-evoked response, the relationship between prestimulus and evoked signals is unclear. One possibility is that preparatory modulations are the source of an additive boost granted to attended objects in the stimulus-evoked response (Buracas and Boynton, 2007). This would suggest that a single mechanism underlies the attentional modulations in preparatory and stimulus-evoked BOLD signals. A second possibility is that preparatory BOLD modulations reflect a nonspecific increase in the activity of all cells corresponding to the attended location, whereas attentional modulation of stimulus-evoked signals occurs only in cells that prefer the stimulus along other dimensions as well, such as orientation or color (Kastner et al., 1999; McMains et al., 2007). Finally, a third possibility is that prestimulus modulations reflect a process that is completely independent of the nature of the stimulus-evoked signals.
We test these possibilities by examining (1) the mean attentional modulation in prestimulus and poststimulus activity and (2) the trial-by-trial relationship between prestimulus and stimulus-evoked BOLD modulations. If prestimulus and stimulus-evoked signals reflect the same process (the first possibility described above) then the mean attentional modulation should be similar in prestimulus and poststimulus signals and the two signals should be positively correlated on a trial-by-trial basis. If prestimulus modulations represent a more nonspecific process than poststimulus modulations (possibility two), then prestimulus attentional modulations should be larger than poststimulus modulations and the two signals may or may not be correlated on a trial-by-trial basis. Finally, if prestimulus and poststimulus signals represent completely different processes, than the two should not be correlated on a trial-by-trial basis.
Materials and Methods
Subjects.
Six subjects (3 female) were recruited, aged 26–30, right-handed, with no history of neurological illness, and normal or corrected-to-normal vision. Informed consent was obtained as per the guidelines of the human studies committee at Washington University School of Medicine. Subject 2 was author C.M.S.
Task.
Eye position was monitored to ensure subjects always fixated a central crosshair. Each trial began with a 500 ms auditory preparatory cue, the spoken word “left” or “right”, indicating one of two locations −5° eccentricity, 45° to the left or right of the vertical meridian (Fig. 1). After a stimulus-onset asynchrony (SOA) of 6.192 s (25%), 8.256 s (25%), or 10.32 s (50%), targets appeared for 100 ms centered at both locations, concurrent with an auditory report cue (“left” or “right”). Targets were 3.5 cycle-per-degree Gabor patches with a Gaussian envelope SD of 0.3 degree. On valid trials (75%), the report cue matched the preparatory cue. Subjects indicated the orientation (left tilt, vertical, right tilt) of the report-cued Gabor with a button press. There was a random intertrial interval (ITI) of 16.512 s (33%), 18.576 s (33%), or 20.64 s (33%). Each 6.2 min fMRI scan block consisted of 13 trials; each subject performed between 1450 and 1750 trials over 8–12 scanning sessions. Subject 5 performed only 1144 trials. Scanning blocks with “high-contrast” and “low-contrast” targets (see Practice sessions and target parameters) were intermixed. Subjects were always aware of block-type.
Figure 1.

Task structure. Each trial began with an auditory preparatory (Prep.) cue indicating which of two peripheral locations subjects should covertly attend. After a variable SOA, Gabor patches appeared briefly at both locations, coincident with an auditory cue indicating the target stimulus. Subjects reported the orientation of the Gabor at the target location with a button press. In some task blocks, targets were very low contrast and performance was limited by visibility. In other blocks, targets were high contrast and performance was limited by the small difference in orientation between target types.
Practice sessions and target parameters.
Before test scans, each subject performed ∼600 “high-contrast” and 600 “low-contrast” practice trials, over two in-scanner sessions. The purpose of these sessions was to determine stimulus parameters that would plateau performance at 70% for each contrast. Timing was 2 s SOA and 2–4 s ITI. Across the 6 subjects, for the low-contrast stimuli, contrast at plateau performance ranged from 5 to 12% and the difference in orientation between targets varied from 6 to 45°. For high-contrast trials, contrast was maintained at 50%, and the difference in orientation between targets at plateau performance ranged from 1.5 to 3.0°. Occasional small adjustments were also made during test sessions.
Data acquisition.
Images were acquired with a Siemens Allegra 3T scanner. Structural images used a sagittal MP-RAGE T1-weighted sequence [repetition time (TR) = 1810 ms, echo time (TE) = 3.93 ms, flip angle = 12°, inversion time = 1200 ms, voxel size = 1 × 1 × 1.25 mm). BOLD contrast images were acquired with an asymmetric spin-echo echoplanar sequence (TR = 2.064 s, TE = 25 ms, flip angle = 90°, 32 contiguous 4 mm axial slices, 4 × 4 mm in-plane resolution). BOLD images were motion corrected within and between runs, and timing differences across slices were corrected. Images were resampled into 3 mm isotropic voxels and warped into a standardized atlas space (Talairach and Tournoux, 1988).
Apparatus.
Stimuli were presented with a Power Macintosh G4 computer (Apple Computers) using Matlab software (MathWorks) with the psychophysics toolbox (Brainard, 1997; Pelli, 1997). Images were projected to the head of the bore of the scanner via an LCD projector (Sharp LCD C20X) and viewed with a mirror attached to the head coil. A magnet-compatible fiber-optic key-press device recorded subject responses. Eye position was measured in 5 of 6 subjects (not subject 2, author C.M.S.) with an ISCAN ETL-200 system.
Linear modeling.
The BOLD data at each voxel, for each subject, were subjected to a general linear model using in-house software. Constant and linear terms over each BOLD run accounted for baseline and linear drift, and sine waves modeled low-frequency noise (<0.009 Hz). Separate δ function regressors coded each of the 11–13 time points (22.0704–26.832 s, depending on SOA) following the preparatory cue of each of the 48 different event types [3 SOAs × (left vs right cue) × (high vs low contrast) × (valid vs invalid) × (correct vs incorrect)]. A “residuals” dataset was created by summing the modeled responses (but not the constant, linear, or sine wave terms) with the residuals (error) unaccounted for by the linear model.
All subsequent statistical analyses were performed on the residuals dataset. This dataset included only the experimental effects of interest (cue- and target-related modulations) as well as unaccounted-for error (needed for statistical comparisons and quantification of information present in the BOLD signal). The residuals dataset minimized contamination from systematic sources of noise that are likely unrelated to neural activity such as run-to-run baseline differences, linear drift in the BOLD signal over individual runs, and low frequency noise.
Derivation of regions of interest.
Regions of interest (ROIs) were created within early visual cortex (V1–V4) representing the two target locations. In a separate set of scans, subjects passively viewed high-contrast (∼50%) Gabor patches flickering at 4 Hz in 12 s blocks. In each block, a Gabor randomly appeared at one of five locations—one of the two target locations, one of the two target locations mirrored across the horizontal meridian, and a single central location. We constructed contrasts of each passive stimulus with its mirror stimulus across the vertical meridian. In additional scans, subjects passively viewed contrast reversing checkerboard stimuli extending along the horizontal and vertical meridians. A contrast of responses to the horizontal and vertical meridians was used to hand-draw borders of early visual regions, on a flattened representation of the subject's own anatomy using Caret software (Van Essen et al., 2001). Subdivisions of early visual cortex were made by taking the conjunction of the voxels with a stimulus preference during the localizer scans (z > 2) and the earliest of the retinotopic regions (V1v, V2v, VP, V4 for upper field locations; V1d, V2d, V3, and V3a for lower field locations).
In all analyses, only trials with the longest SOA (5 MR frames) were used, to avoid contaminating preparatory signals with stimulus-evoked activity. To create ROIs outside of retinotopic cortex, we performed a voxelwise ANOVA over the first six trial time points using the residuals dataset, separately in each subject. The ANOVA effects of interest were cue direction, target contrast, validity, performance, and time. An in-house clustering algorithm defined ROIs based on the resulting map of the main effect of time. ROIs started as 8 mm spheres centered on map peaks with z-scores >10; spheres within 12 mm of each other were consolidated into a single ROI. ROIs were then masked with the main effect of time image at a threshold of 3. For this study, we used the frontal eye field (FEF) and intraparietal sulcus (IPS) regions derived through this procedure. To create the V3A regions, the V3A regions derived from the retinotopy scans were masked with the contrast (contralateral, low contrast, correct valid trials minus ipsilateral, low contrast, correct valid trials) (z > 2) to create the final ROIs.
Behavioral analysis.
Accuracy data were subjected to a four-way ANOVA (target location, target contrast, cue validity, SOA) with subject used as a repeated measure.
Regional time courses.
In all time courses, only valid, correct trials with the longest SOA (5 frames) were included. Data at each MR frame were first averaged across voxels within a particular ROI. Next, trials were sorted by the effects of interest (usually contralateral cue versus ipsilateral cue) and then averaged within each condition. Time courses were then averaged across the 2 homologous regions in opposite hemispheres and then across subject. Where indicated, time courses were normalized by dividing each time point by the same value, such that the sum of squares for each time course was 1.
Attentional modulation curves.
Attentional modulation curves were derived by subtracting attend-ipsilateral time courses from attend-contralateral time courses. Several metrics were defined from these curves. Each of these metrics were derived from individual subject curves and then averaged across subjects. The maximum attentional modulation (MAM) was the maximum value of the attentional modulation curve across the 13 time points of the trial. The ratio of the preparatory attentional modulation to the stimulus-evoked attentional modulation was the maximum attentional modulation over the first 6 time points divided by the maximum modulation over the last 7 time points. For averaging this metric, the subjects with the highest and lowest ratios were excluded. The last frame at which the plateau of the attentional modulation was maintained was the last frame at which the modulation was still at least 75% of the maximum attentional modulation.
The maximum attentional modulations and the ratio of preparatory to evoked maximal modulations were compared across regions using two-factor (region, contrast) ANOVAs. We never found significant effects of contrast. For the last frame at which the plateau of the attentional modulation was maintained, we used two-tailed Wilcoxon signed-rank tests (nonparametric version of a paired t test). This test was used because the dependent variable took discrete values (frame number). The test was performed separately for high- and low-contrast trials. Note that with 6 subjects, each subject must have one group higher than the other for the Wilcoxon test to be significant (p < 0.05) so this test was very conservative.
Attention discriminability curves.
In each ROI, data were averaged across voxels using the residuals dataset. For subtraction analyses, trial-by-trial data were next subtracted between ROIs in opposite hemispheres. We evaluated how well the BOLD signal at each time point indicated the locus of attention. The degree of separation between the BOLD signal magnitudes for leftward versus rightward trials was quantified with a receiver-operator characteristic (ROC) curve. To obtain the ROC curve, the conditional probabilities P(α > crit|Rleft) and P(α > crit|Rright) were evaluated as a function of crit, where α is the magnitude, Rleft indicates the subset of trials with leftward cues, and Rright is the subset of trials with rightward cues. The “attention discriminability index” was the area under this ROC curve. Statistical analysis of attention discriminabilty curves was identical to the analysis of attentional modulation curves.
Trial-by-trial correlations.
In each subject, in each ROI, we computed the correlation of BOLD activity at time point 4 with the BOLD activity at every other time point. Because the correlations are computed separately for each pair of time points, this analysis does not depend on the mean signal at a particular time point. Instead, this analysis determines whether variability at one time point is related to variability at another time point. Only trials with valid preparatory cues and correct performance were included. Correlations were computed separately for each subject and for each of four different conditions (target location × target contrast). Correlations were then averaged across subject and conditions, since there were no significant differences by condition.
As a control, we computed the temporal autocorrelation function of BOLD data in subjects at rest. These data were derived from 10 additional subjects who each underwent six BOLD runs of 128 frames each. Frame TR was 2.064 s, identical to task BOLD runs. During these resting scans, subjects maintained fixation on a central crosshair with no visual stimulation and no explicit instructions. To capture the same across-run variability as the task dataset, we extracted 60 mock “time courses” of 7 frames from each subject, which was close to the average number of trials used to compute the correlations in the task dataset. We then computed the correlations of the first time point of these mock time courses with every other time point, separately for each subject. We averaged the correlation values across the 10 subjects for the final control values. For statistical comparisons, we compared task data correlations to control correlations derived from the same ROI (taken from one of the 6 subjects in the task dataset). We used a Wilcoxon test for statistical comparisons. For this test to be significant, each of the 6 subjects in the task dataset needed to have a correlation that was higher (or each of them had to have a correlation that was lower) than the control correlation (averaged over the 10 subjects) over the same time interval.
We also computed the correlation of the “hemispheric asymmetry” at time point 4 with the hemispheric asymmetry at every other time point. The hemispheric asymmetry was computed as the trial-by-trial, time point-by-time point difference in activity between homologous regions in opposite hemispheres. Analysis then proceeded exactly as above. For statistical comparisons, the hemispheric asymmetry was also computed on the resting data before deriving the control correlation values.
Results
Behavior
Subjects performed the task illustrated in Figure 1. At the beginning of each trial, an auditory preparatory cue indicated whether subjects should attend to an empty location in the upper left or upper right portion the visual field. After a random delay, visual stimuli appeared very briefly at both of these locations, and on most trials subjects had to indicate the orientation of the object at the precued location. In some task blocks, visual targets were very low contrast (near threshold) whereas in other blocks, targets were high contrast (∼50%). The behavioral results of this study have been described in detail previously (Sylvester et al., 2007, 2008); here we focus only on behavioral results relevant to the experimental hypotheses.
Subjects covertly attended to the location indicated by the auditory preparatory cue throughout the interval between the cue and the onset of the visual target, suggesting that it is legitimate to compare attentional modulations on preparatory and stimulus-evoked signals. A four-way ANOVA (cue validity, target location, target contrast, duration of cue-target interval) indicated that accuracy was significantly modulated by cue validity (F(1,5) = 17.0; p = 0.009), demonstrating that subjects directed attention to the cued location. Furthermore, there was no effect of the duration of the cue-target interval (F(2,4) = 3.6; p = n.s.), indicating that subjects sustained attention to the cued location throughout the interval. This study focuses on the relationship between BOLD signals in the prestimulus and poststimulus intervals. To avoid confounding preparatory activity with the BOLD response to the visual stimuli, we restrict analysis only to trials with the longest delay between the preparatory cue and the visual targets—10 s (5 MR frames), comparable to other studies of preparatory activity (Kastner et al., 1999; Hopfinger et al., 2000; Serences et al., 2004; Giesbrecht et al., 2006). On these trials, the preparatory auditory cue sounded at frame 1 and the visual target was presented at frame 6.
Average preparatory and evoked signals in visual cortex
We first examined average preparatory and stimulus-evoked modulations in the portions of early visual cortex (V1–V4) representing the two target locations. Average trial time courses are presented in Figure 2, A (low-contrast targets) and B (high-contrast targets). Data are separated into trials in which attention was directed to the contralateral location (and so the region represents the attended location) versus those in which attention was directed to the ipsilateral location (and so the region represents the unattended location; note that stimuli always appeared at both the attended and unattended locations), and then averaged across the regions representing the two target locations. As demonstrated previously (Kastner et al., 1999), mean BOLD activity showed a modest prestimulus response (frames 1–6) and a larger stimulus-evoked response (frames 7–13). Furthermore, activity was higher in both the cue (F(1,5) = 12.1, p = 0.018) and target (F(1,5) = 11.4, p = 0.020) intervals when attention was directed toward the location represented by that region.
Figure 2.

BOLD modulations related to spatial attention in visual cortex are near maximum before onset of the visual stimulus. A, B, Full trial time courses over trials with low (A)- or high (B)-contrast targets recorded from the two regions in early visual cortex (V1–V4) corresponding to the two target locations (upper left or upper right visual field). Data are separated into trials in which attention was directed to the contralateral (contra) versus ipsilateral (ipsi) target location and then averaged across the two regions. The portions of the time courses to the left of the dashed lines indicate purely endogenous BOLD modulation, before onset of the visual target. Importantly, because of the sluggishness of the BOLD response, activity right at the onset of the visual targets (dashed line) also reflects purely endogenous modulation. C, D, The difference in BOLD activity on attend-contralateral versus attend-ipsilateral trials for each subject (thin lines) and averaged over subjects (thick lines). Note that this difference, which reflects the BOLD modulation related to spatial attention, is near its largest point before onset of the visual target. E, F, The same data as in C, D, only the data have been normalized so that each subject contributes equally to the shape of the average curve.
Since our goal was to compare prestimulus and poststimulus modulations, we explored the nature of the stimulus-evoked response. Interestingly, the magnitude of stimulus-evoked activity in the portion of visual cortex representing the attended location did not depend on the contrast of the stimulus (Fig. 2A,B, compare black curves; F(1,5) = 0.049, p = 0.83). This suggests that the evoked response was not driven primarily by stimulus contrast energy but rather by perceptual processes unrelated to contrast as well as endogenous factors such as spatial attention, stimulus expectation, and response selection.
Comparing the effects of spatial attention on prestimulus and poststimulus BOLD activity will help determine whether the same mechanism underlies attentional modulations in these two intervals. To better visualize the effects of spatial attention over the course of the trial, the “attentional modulation” was defined as the difference in activity between trials in which attention was directed to the contralateral target location minus activity on trials in which attention was directed to the ipsilateral location. This attentional modulation, plotted in Figure 2, C and D, followed a characteristic pattern in each subject. The modulation rose sharply during the preparatory interval, reaching a relative plateau at frame 5 or 6, just before the onset of the visual target (note that because of the sluggishness of the BOLD response, activity at frame 6 represents purely endogenous modulation). Attentional modulation increased only slightly once reaching this plateau, which was maintained until about frame 9 (Fig. 2C,D), just as the evoked response reached its peak (compare with Fig. 2A,B). Averaged across subjects, the maximum attentional modulation was 0.26% BOLD change, the ratio of preparatory to stimulus-evoked attentional modulation was 0.87, and the plateau of the attentional modulation was maintained until frame 8.8. (Throughout the text attentional modulation metrics are cited for trials with low-contrast targets, but metrics for each region at both contrasts are listed in Table 1.)
Table 1.
Metrics of attentional modulation curves for low-contrast and high-contrast trials
| MAM | Cue MAM/Target MAM | Last frame at 75% MAM | |
|---|---|---|---|
| Low contrast | |||
| V1–V4 | 0.26 (0.07) | 0.87 (0.01) | 8.8 (0.2) |
| V1 | 0.14 (0.02) | 1.08 (0.06) | 6.3 (0.6) |
| V2 | 0.20 (0.05) | 0.98 (0.05) | 8.0 (0.4) |
| VP | 0.29 (0.08) | 0.81 (0.05) | 8.8 (0.5) |
| V4 | 0.32 (0.08) | 0.74 (0.06) | 8.8 (0.2) |
| V3A | 0.14 (0.05) | 0.98 (0.04) | 8.2 (0.2) |
| FEF | 0.06 (0.01) | 1.22 (0.07) | 6.7 (0.3) |
| IPS | 0.09 (0.03) | 1.35 (0.19) | 6.6 (1.2) |
| High contrast | |||
| V1–V4 | 0.19 (0.06) | 0.90 (0.09) | 8.7 (0.4) |
| V1 | 0.12 (0.02) | 0.96 (0.06) | 6.7 (0.6) |
| V2 | 0.16 (0.04) | 0.93 (0.09) | 8.2 (0.4) |
| VP | 0.19 (0.08) | 0.90 (0.16) | 7.8 (0.8) |
| V4 | 0.23 (0.06) | 0.74 (0.07) | 9.3 (0.3) |
| V3A | 0.11 (0.04) | 0.91 (0.05) | 7.8 (0.3) |
| FEF | 0.05 (0.01) | 1.22 (0.08) | 6.5 (0.3) |
| IPS | 0.08 (0.01) | 1.28 (0.39) | 5.4 (0.7) |
Metrics were computed separately for each subject and then averaged across subjects. For the ratio of cue to target MAM, the subjects with the highest and lowest ratios were excluded before averaging. Errors, in parentheses, are SEM. MAM, Maximal attentional modulation, the maximal difference (in % BOLD change) between attend-contralateral versus attend-ipsilateral trials, at any one time point over the course of the trial.
These results indicate that, in the portions of visual cortex representing the attended locations, preparatory modulations related to spatial attention are similar in magnitude to attentional modulations in the stimulus-evoked response, and attentional modulations survive until the peak of the evoked response.
The relationship between preparatory and evoked activity depended on the level of the visual cortical hierarchy. We divided the portion of visual cortex representing the target location into its subdivisions in V1v, V2v, VP, and V4. The attentional modulation curves for each of these regions are plotted in Figure 3. As shown previously (Kastner et al., 1999), the maximum attentional modulations increased at progressively higher levels of the visual cortical hierarchy, ranging from 0.14% in V1v to 0.32% in V4 (see Table 1 for all values; V1 versus V4, F(1,20) = 7.1, p = 0.015). In addition, the attentional modulations were maintained for a longer time into the evoked response at higher levels of the visual hierarchy. Modulations related to spatial attention plateaued until frame 6.3 in V1v and until frame 8.8 in V4 (Wilcoxon signed-rank test, p < 0.05). Finally, preparatory attentional modulations accounted for a larger fraction of the stimulus-evoked modulations in earlier levels of the visual hierarchy, as the ratio of preparatory to stimulus-evoked attentional modulation ranged from 1.08 in V1v to 0.74 in V4 (V1 vs V4, F(1,20) = 5.0, p = 0.037).
Figure 3.

BOLD modulations related to spatial attention get progressively larger at later levels of the visual cortical hierarchy. The analyses here are identical to those in Figure 1C,D, only the data have been broken down into the different subdivisions (V1, V2, VP, V4) of visual cortex. Both A and B display the difference in BOLD activity on attend-contralateral versus attend-ipsilateral trials, averaged across subjects, for trials with low (A)- or high (B)-contrast targets. Note that attentional modulations get progressively larger and are sustained longer into the evoked response at progressively later levels of the visual cortical hierarchy.
These results suggest that attentional modulations in early visual cortex (V1) are smaller in magnitude and more confined to the preparatory interval relative to modulations in later visual cortex (V4). In addition, preparatory attentional modulations are slightly larger than evoked attentional modulations in V1, whereas evoked attentional modulations are slightly larger than preparatory attentional modulations in V4. Because the preparatory attentional modulations are similar in magnitude to evoked attentional modulations, these data are most consistent with a model in which prestimulus and poststimulus modulations reflect the same process.
Average preparatory and evoked signals in regions involved in top-down control of visual cortex
We next examined the relationship between preparatory and evoked activity in other brain regions with preparatory activity that modulated with the locus of attention. As with visual cortex, preparatory activity was higher in the frontal eye fields (FEF, F(1,5) = 76.0, p < 0.001), the intraparietal sulcus (IPS, F(1,4) = 13,3, p = 0.020), and V3A (F(1,5) = 9.9, p = 0.025) when attention was directed to the contralateral versus ipsilateral target location. These regions are likely the source of top-down modulation of early visual cortex (Moore and Armstrong, 2003; Ruff et al., 2006, 2008; Bressler et al., 2008). Attentional modulation curves for these regions were qualitatively similar to the modulations in V1–V4 and are plotted in Figure 4.
Figure 4.

BOLD modulations related to spatial attention in FEF and IPS reach their maximum before the onset of the visual stimulus. Both A and B display the difference in BOLD activity on attend-contralateral versus attend-ipsilateral trials, averaged across subjects, on trials with low (A)- or high (B)-contrast targets. This difference, the attentional modulation, is at its largest point before the onset of the visual target in FEF and IPS. The attentional modulation from the portion of visual cortex (V1–V4) representing the upper field (target) location is replotted for comparison. Data have been sorted by whether attention was directed into the contralateral or ipsilateral hemifield, and then averaged across homologous regions in left and right hemispheres.
Modulations in FEF and IPS followed a pattern similar to regions early in the visual hierarchy, such as V1v. First, the maximum attentional modulations were rather small, at 0.06% for FEF and 0.09% for IPS. In both regions, these attentional modulations were smaller than even V1 (FEF vs V1, F(1,20) = 34.6, p ≪ 0.001; IPS vs V1, F(1,16) = 4.5, p = 0.049). Second, the preparatory attentional modulations were larger than the stimulus-evoked modulations, as the ratio of preparatory to stimulus-evoked attentional modulation was 1.22 for FEF and 1.35 for IPS. This ratio in FEF was significantly greater than the ratio in V4 (F(1,20) = 19.8, p < 0.001) but not statistically different from V1. Finally, the attentional modulations did not last long into the stimulus-evoked activity, as the attentional plateau ended at frame 6.7 for FEF and frame 6.6 for IPS. The attentional plateaus ended significantly earlier in FEF and IPS than in V4 for high-contrast trials (Wilcoxon, p < 0.05) and there was a near-significant trend toward this effect for low-contrast trials. In contrast, there were no significant differences between FEF, IPS, and V1v.
Modulations in V3A fell between V1v and V4, as though V3A were somewhere in the middle of the visual hierarchy. The maximal attentional modulation in V3A was 0.14%, and the ratio of preparatory to stimulus-evoked attentional modulation was 0.98. Both of these effects were similar in magnitude to the effects in V1v. The attentional plateau in V3A ended at frame 8.2, just before the peak of the stimulus-evoked response and in between the terminations of attentional modulations in V1v and V4.
Similar to early visual cortex, preparatory attentional modulations in regions involved in top-down control (especially FEF and IPS) were similar in magnitude to stimulus-evoked attentional modulations. These data are again most consistent with a model in which prestimulus- and poststimulus attentional modulations reflect the same underlying mechanism.
Information content across regions
As a complement to the results described above, we tested how well BOLD activity at each time point in each region could indicate whether the subjects were attending to the contralateral or ipsilateral target location. This analysis indicates how much information is present in a single BOLD measurement and depends on both the mean BOLD signal for each condition as well as the trial-by-trial variability about these means. The “attention discriminability index” (ADI) was derived from receiver operator characteristic (ROC) curves and ranged between 0.5 (chance discrimination) and 1.0 (perfect discrimination).
The attention discriminability curves (displayed in Fig. 5) were remarkably similar to the attentional modulation curves (displayed in Figs. 3, 4), indicating that the previous analysis captured the relevant characteristics of the BOLD signal pertaining to spatial attention. As with the attentional modulation curves, the attention discriminability curves for each region reached a relative plateau before the onset of the visual target and maintained this plateau through part of the evoked phase of the trial.
Figure 5.

The ability to determine the locus of attention from a single measurement of BOLD activity in a single region is near maximal before the onset of the visual stimulus. A–D, Each panel displays how well trial-by-trial BOLD activity at each time point can discriminate whether attention is directed toward the contralateral or ipsilateral target location, quantified with the ADI (see Materials and Methods for details). A, B, Subdivisions of visual cortex, each of which represents the target locations; C, D, other regions across the brain with activity varying with the locus of attention. Note that the shapes of these curves are very similar to the shapes of the attentional modulation curves (displayed in Figs. 3, 4). L, Left; R, right.
We have demonstrated previously that the trial-by-trial difference in BOLD activity between homologous regions in opposite hemispheres gives more information concerning the locus of attention compared with activity in individual regions (Sylvester et al., 2007; Sestieri et al., 2008). From a computational standpoint, this activity difference can improve decoding the locus of attention by (1) constructively combining signals with opposite preferences and (2) removing any positively correlated activity unrelated to the locus of attention. Figure 6 plots attentional discriminability curves for each region in which the data are computed as the difference in BOLD activity between homologous regions in opposite hemispheres. Although the curves are qualitatively similar to the attentional discriminability curves from individual regions (Fig. 5), the magnitudes are much larger for the subtracted regions (note the large difference in the scales).
Figure 6.

The time-point-by-time-point difference in activity between homologous regions in opposite hemispheres much better indicates the locus of spatial attention compared with activity from individual regions. This figure is identical to Figure 5, except that the data are derived as the trial-by-trial, time point-by-time point difference in the activity between homologous regions in the left and right hemispheres. A-D, Each panel displays how well the difference in BOLD activity between homologous regions in opposite hemispheres can discriminate whether attention is directed toward the contralateral or ipsilateral target location, as quantified with the ADI. A, B, Subdivisions of visual cortex, each of which represents the target locations. C, D, Other regions across the brain with activity varying with the locus of attention. Note that the shapes of these curves are nearly identical to the curves from the individual regions, but the scales are much different. L, Left; R, right.
Quantification of metrics based on the attention discriminability curves replicated the findings based on metrics of attention modulation curves. Regions at higher levels of the visual hierarchy contained progressively more information concerning the current locus of attention (V1 vs V4, F(1,20) = 6.9, p = 0.016), and activity in FEF and IPS provided less information than higher-level visual cortex regions (FEF vs V4, F(1,20) = 14.7, p = 0.001; IPS vs V4, F(1,16) = 6.2, p = 0.025). In addition, information concerning the locus of attention was maintained longer in V4 than in V1 or FEF (Wilcoxon tests, p < 0.05).
Altogether, the analysis of mean signals suggests that prestimulus and poststimulus signals are related, since they are similar in magnitude. Other possibilities, however, could also explain these results. For example, subjects could attend before target onset on some trials and after the target onset on other trials. Alternatively, signals in the prestimulus and poststimulus intervals could represent independent processes associated with similar modulations in BOLD activity. To adjudicate between these possibilities, we next asked whether preparatory and stimulus-evoked signals were related on a trial-by-trial basis.
Trial-by-trial relationships between cue and target period activity
We assessed the relationship between preparatory and stimulus-evoked activity by measuring the trial-by-trial correlation between BOLD activity at time point 4 (the peak of the preparatory response) with the BOLD activity at every other time point, focusing primarily on correlations with time points 7–10 (evoked activity). Critically, we computed these correlations separately for attend-contralateral and attend-ipsilateral trials. Because there were no differences depending on the locus of attention, we then averaged these correlation values. Because of temporal autocorrelation in BOLD time series (Purdon and Weisskoff, 1998), we compared the correlations in our task dataset to correlations in BOLD activity over the same time interval in subjects at rest, in the absence of any overt task.
In individual regions, we could not detect a significant trial-by-trial relationship between preparatory and stimulus-evoked activity. The black line in Figure 7A plots the correlation of time point 4 with every other time point, in the two regions representing the target locations. Although there are positive correlations between time point 4 and the time points in the stimulus-evoked interval, these correlations are no different from correlations over the same time interval in the same regions at rest (Fig. 7A, plotted in red). This suggests that the positive correlations seen in the task dataset are attributable to the intrinsic properties of the BOLD signal (the temporal autocorrelation) rather than a causal relationship between preparatory and stimulus-evoked modulations. Figure 7B further illustrates this point by plotting the 50% of trials with the highest preparatory activity by time point 4 (black curve) versus the 50% of trials with the lowest preparatory activity at time point 4 (gray curve). Note that by the peak of the evoked response, these curves are overlapping, indicating that the magnitude of the evoked response does not depend on the magnitude of the preparatory response.
Figure 7.
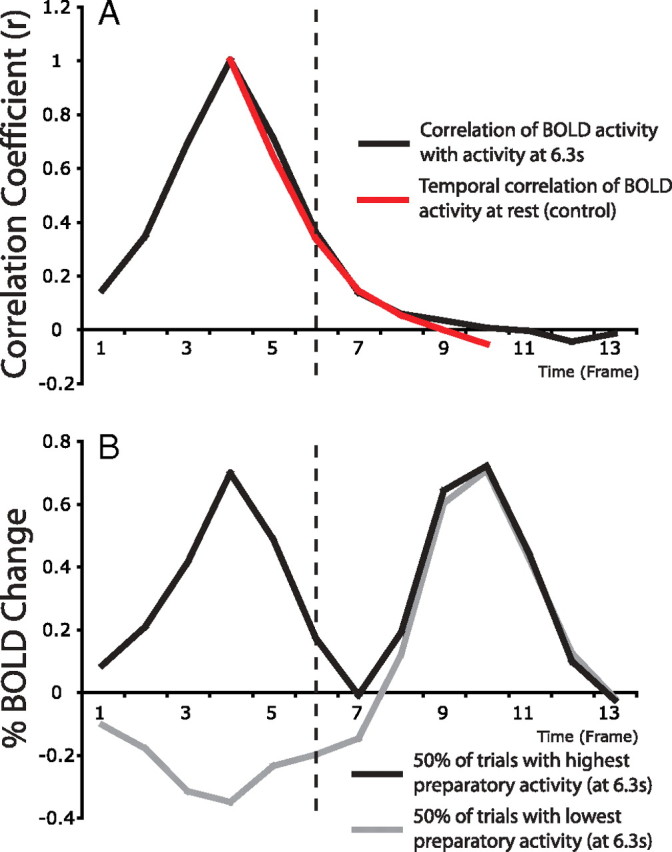
Within individual regions, the trial-by-trial magnitudes of preparatory activity and stimulus-evoked activity are uncorrelated. A, The black line plots the trial-by-trial correlation between activity at time point 4 (preparatory activity) and the activity at every other time point. The red line plots the correlation in BOLD activity in the same region over the same time intervals in the absence of any task. The correlation between preparatory (time point 4) and stimulus-evoked activity (time points 7–10) is no different from the correlation in activity in the control resting data over the same time intervals. B, Time courses from the 50% of trials with the greatest activity and the 50% of trials with the least activity at time point 4. By the peak of the evoked response, the time courses are identical, reinforcing the notion that activity at time point 4 has no influence on the magnitude of activity in the stimulus-evoked interval. Data are from the portions of visual cortex (V1–V4) representing the target locations. Time courses and correlation values are computed separately for each condition (target location and contrast), subject, and for each of the two regions, and then averaged across these factors.
Importantly, the trial-by-trial difference in BOLD activity between homologous regions in opposite hemispheres (the hemispheric asymmetry) was significantly correlated between the prestimulus and poststimulus intervals. Because the attentional discriminability analysis described previously indicated that hemispheric asymmetries best captured the locus of attention, we applied the correlation analysis to this measure for each region (the controls were likewise based on subtractions between homologous regions at rest). The black line in Figure 8A plots the correlation of the hemispheric asymmetry at time point 4 with the hemispheric asymmetry at every other time point, across the two regions representing the target locations (V1–V4). The hemispheric asymmetry at time points 7–10 was more highly correlated with the asymmetry level at time point 4 relative compared with what would be expected on the basis of resting (control) data (plotted in red). Figure 8B further illustrates this point by plotting the 50% of trials with the largest hemispheric asymmetry in favor of the contralateral location (black curve) versus the other 50% of trials (gray curve). Note that the separation between these curves is maintained through the peak of the evoked response (frames 9 and 10). This indicates that a large bias in activity toward the attended location during the preparatory interval predicts a large bias during the evoked interval as well.
Figure 8.
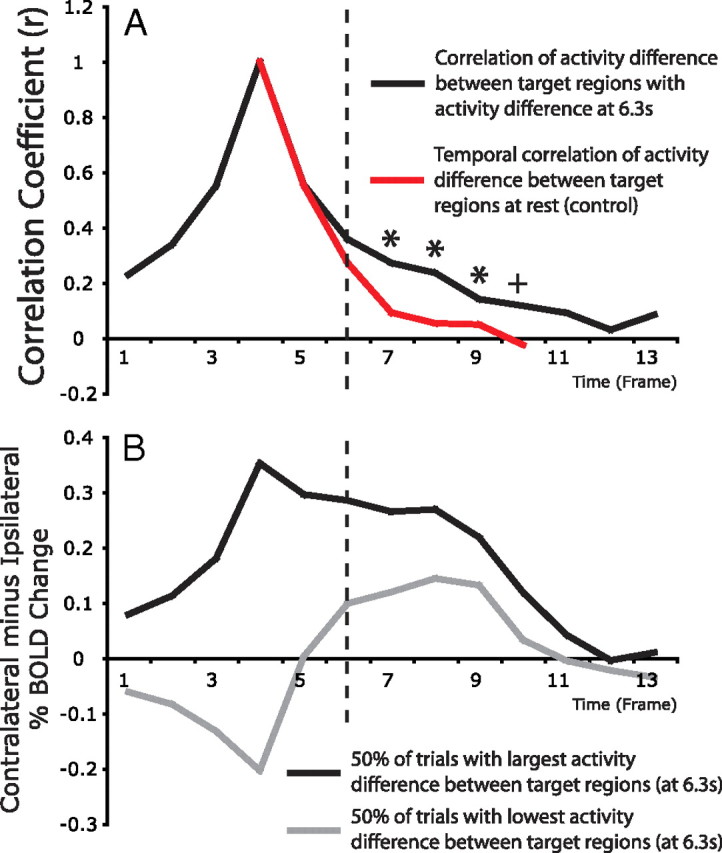
The trial-by-trial hemispheric asymmetries (differences in activity between homologous regions in opposite hemispheres) in the preparatory and stimulus-evoked intervals were correlated. The data used for this analysis are the trial-by-trial, time point-by-time point differences in activity between the regions in the left and right hemispheres representing the two target locations (V1–V4). A, The black line plots the trial-by-trial correlation between this hemispheric asymmetry at time point 4 (preparatory activity) and the hemispheric asymmetry at every other time point. The red line plots the correlation in this difference measurement over the same time intervals in the absence of any task. Correlations at time points 7–10 (the stimulus-evoked response) during the task are significantly higher than the correlations in the control resting data over the same time interval (Wilcoxon signed-rank test; *p < 0.05; +p = 0.06). B, Time courses from the 50% of trials with the greatest difference in activity and the 50% of trials with the least difference in activity between the homologous regions at time point 4. Trials with the largest difference at time point 4 maintain an asymmetry at time points 7–10, reinforcing the notion that the difference measurement during the evoked interval depends on the difference measurement during the preparatory interval. Time courses and correlation values are computed separately for each condition (target location and contrast) and subject, and then averaged across these factors.
We performed these same trial-by-trial analyses on individual subdivisions of visual cortex (V1, V2, VP, and V4) but did not detect any significant differences between these regions.
Interestingly, in FEF and IPS, the hemispheric asymmetries in the stimulus-evoked interval were less correlated with the hemispheric asymmetries in the preparatory interval than the asymmetry over the same interval at rest. The black curves in Figure 9, A and B, plots the correlation of the hemispheric asymmetry at time point 4 in these two regions with the asymmetry at every other time point, as above. Again, the red curves indicate correlations in the hemispheric asymmetry in the same regions over the same time interval in subjects at rest. The red curves are significantly higher than the black curves in many of the time points in the stimulus-evoked intervals in both FEF and IPS (Fig. 9, Wilcoxon tests, p < 0.05, asterisks). These data suggest that in FEF and IPS, activity biases toward one location are maintained longer at rest than they are during our task. Critically, in many other regions across the brain, such as in the cingulate sulcus, the hemispheric asymmetries in the preparatory and evoked intervals were no different from would be expected on the basis of subjects at rest (Fig. 9C).
Figure 9.

The relationship between the preparatory hemispheric asymmetry (the difference in activity between homologous regions in opposite hemispheres) and the stimulus-evoked hemispheric asymmetry depends on the region. The black line in each panel plots the correlation between the hemispheric asymmetry at time point 4 (preparatory activity) with the hemispheric asymmetry at every other time point. Red lines plot the hemispheric asymmetry in the same regions over the same time intervals in resting BOLD data. A, B, In FEF (A) and IPS (B), the hemispheric asymmetries during the stimulus-evoked interval are less correlated with the preparatory asymmetries than the correlations over the same time intervals at rest (Wilcoxon signed-rank test; *p < 0.05; +p = 0.06). C, In the cingulate sulcus, the hemispheric asymmetry in the preparatory interval is no more or less correlated with the asymmetry in the stimulus-evoked interval than would be expected on the basis of subjects at rest. Correlation values are computed separately for each condition (target location and contrast) and subject, and then averaged across these factors.
Relationship of preparatory and evoked signals to task accuracy
The data presented above suggest that preparatory BOLD modulations related to spatial attention reflect the same additive signal present in the stimulus-evoked response. We hypothesize that preparatory attentional modulation is the basis of improved perception for attended objects because of its effect on the subsequent stimulus-evoked response. One might predict, therefore, that the magnitude of the attentional bias for attended versus attended locations would correlate with trial accuracy during both the preparatory and stimulus-evoked intervals. Indeed, we have previously demonstrated, using this same dataset, that the preparatory attentional bias for attended versus unattended locations in area V3A predicts accuracy on the upcoming task (Sylvester et al., 2007).
The bias in BOLD activity toward the attended location in the stimulus-evoked interval did not correlate with trial accuracy for any region tested. In other words, the difference in activity for attended versus unattended locations during the preparatory interval predicted performance on the upcoming task, whereas these same signals recorded during the actual stimulus interval did not. This pattern of results is consistent with the hypothesis that preparatory activity is the basis of improved perception for attended objects due of its effect on the subsequent stimulus-evoked response. Although the magnitude of the attentional effect in the BOLD response is the same during the preparatory and stimulus-evoked intervals, the absolute BOLD response is much larger during the stimulus-evoked interval (Fig. 2A,B). The larger absolute BOLD level during the target interval is likely the result of processes engaged during this interval but not during preparation such as stimulus processing, decision-making, and response selection. Each of these processes will contribute to signal variation during the stimulus-evoked interval but not during the preparatory interval. Because the magnitude of the attention signal is equal during these two intervals, signal-to-noise for attention-related signals will be larger during the preparatory interval. The attentional modulation in the preparatory interval may predict performance on the upcoming task, therefore, because it is a cleaner measure of spatial attention than the attentional modulation in the stimulus-evoked interval.
Task set signals
Finally, we examined the relationship between mean preparatory and stimulus-evoked signals related to task set—whether subjects expected the upcoming stimulus to be low contrast or high contrast. The purpose of this analysis was to determine whether the results in this study generalize to preparatory attention for stimulus characteristics other than location. Preparatory activity in the following regions was modulated by the contrast of the upcoming stimulus: the portion of visual cortex (V1–V4) representing the central visual field, the frontal eye fields (FEF), and the inferior frontal sulcus (IFS) (Sylvester et al., 2008). Note that before stimulus onset, trials in low- and high-contrast blocks were identical, and so these modulations were purely endogenous. Preparatory activity in FEF and IFS was higher during low-contrast blocks whereas activity in the portion of visual cortex representing the central field was higher during high-contrast blocks. Time courses from the visual cortex region are plotted in Figure 10A.
Figure 10.

BOLD modulations related to task set are also near maximum before onset of the visual target. A, Time courses from the portion of visual cortex (collapsed across V1–V4) representing the unattended central visual field on trials with low- versus high-contrast targets. Although subjects were aware of whether the upcoming target will be low or high contrast, trials were identical before the onset of the visual target. Differences between low- and high- contrast trials to the left of the dashed line, therefore, are purely endogenous. B, Difference in BOLD activity on trials with high-contrast versus low-contrast targets (activity was higher during high-contrast blocks). Note that the largest difference between low- and high-contrast blocks is just before the onset of the visual targets. C indicates how well the trial-by-trial BOLD activity at each time point can discriminate whether subjects are in a low- or high-contrast block, in the three regions across the brain with the largest modulations related to task block type.
Modulations related to task set were near maximum before the onset of the visual stimulus, similar to modulations related to spatial attention. Figure 10B plots the difference in activity between trials with high- versus low-contrast blocks in the portion of visual cortex representing the central visual field. This metric, which highlights modulations related to task set, increased steadily through the preparatory interval, reaching a peak right before the onset of the visual targets. After onset of the stimuli, the modulations related to task set decayed quite quickly so that they were near 0 by the peak at the mean response (Fig. 10A,B, compare time point 9). As displayed in Figure 10C, modulations related to task set followed a similar pattern in FEF and IFS.
In summary, modulations related to task set followed a pattern of results similar to modulations related to spatial attention: nearly all of the difference in activity between two conditions present in the stimulus-evoked interval was present during preparation. This provides preliminary evidence that biases in stimulus-evoked activity concerning stimulus characteristics other than location can likewise be generated almost entirely endogenously, before stimulus onset.
Discussion
This study examined the relationship between preparatory and stimulus-evoked BOLD activity during spatially directed attention. Regions at higher levels of the visual cortical hierarchy (e.g., V4) displayed one pattern of results: modulations related to spatial attention were relatively large, extended through the peak of the stimulus-evoked response, and were slightly larger during the evoked response relative to the preparatory interval. Regions in early visual cortex (e.g., V1), the frontal eye fields, and the intraparietal sulcus displayed another pattern of results: modulations related to spatial attention were relatively small, did not extend much into the stimulus-evoked response, and were slightly larger during the preparatory period compared with the stimulus-evoked period.
Across visual cortex (V1–V4), the attentional biases (activity for attended versus unattended locations) in preparatory and evoked activity were more positively correlated, trial-by-trial, than would be expected on the basis of activity measured in subjects at rest. Conversely, in FEF and IPS, the attentional biases in preparatory and stimulus-evoked activities were less correlated with each other than activity over the same interval at rest.
Our results are consistent with the hypothesis that a single mechanism underlies the attentional modulations in preparatory and stimulus-evoked BOLD signals. According to this hypothesis, at the level of BOLD neuroimaging, spatial attention takes the form of an additive signal that operates independently of the presence or absence of a stimulus.
Preparatory and evoked signals in visual cortex
The pattern of results described for regions in visual cortical cortex are consistent with the hypothesis that preparatory and stimulus-evoked modulations are served by a single mechanism. This is most strongly supported by the finding that the magnitude of the stimulus-evoked response was positively correlated with the preparatory response on a trial-by-trial basis. Importantly, however, the relevant variable was the difference in activity between regions representing the attended and unattended locations, not the absolute signal in a region representing a single location. This indicates that the relative topography (difference in activity between locations) across visual cortex is preserved from the preparatory through the stimulus-evoked interval, even if the absolute activity at any particular location is less reliable.
These data suggest that at the level of BOLD neuroimaging, spatial attention operates as an additive signal that can be generated in the absence of a visual stimulus. This result complements recent work indicating that spatial attention adds a constant (Buracas and Boynton, 2007) or nearly constant (Li et al., 2008) amount of activity to early visual cortex BOLD responses to stimuli across a range of contrasts. At the level of single unit responses in early visual cortex, however, it is less clear that spatial attention operates in an additive manner. The initial report of stimulus-independent baseline shifts related to spatial attention in early visual cortex indicated that, under some circumstances, prestimulus activity could account for nearly all of the effects of attention on the stimulus-evoked response, suggesting additivity (Luck et al., 1997). Subsequent studies, however, showed that spatial attention could have a variety of effects on single unit responses, such as contrast gain (Reynolds et al., 2000) or response gain (Williford and Maunsell, 2006), and the exact effect of spatial attention may depend on task characteristics (Reynolds and Heeger, 2009). It is also important to note that many neurons in visual cortex are not significantly modulated by spatial attention (Luck et al., 1997), and the effect of spatial attention averaged across all neurons in a visual area is not at all clear from the single unit literature. One possibility is that the population effect, measured with fMRI, is consistently additive. Another point to consider is that whereas fMRI studies consistently report stimulus-independent baseline shifts in V1 (Kastner et al., 1999; Ress et al., 2000; Müller and Kleinschmidt, 2004; Serences et al., 2004; Jack et al., 2006; Silver et al., 2007; Sylvester et al., 2007; Munneke et al., 2008; Sestieri et al., 2008), preparatory activity has been reported in V2 and V4 in single unit studies of the macaque but not in V1 (Luck et al., 1997); explanations for this apparent discrepancy have been discussed in detail previously (Kastner et al., 1999; Ress et al., 2000).
An unlikely explanation of our results is that we did not get an adequate independent measure of the evoked response since the target interval was very brief (100 ms) and immediately juxtaposed to the preparatory interval. Several factors argue against this explanation. First, preparatory and stimulus-evoked attentional signals based on the difference in activity between regions representing attended and unattended target locations were positively correlated in visual cortex (but not other control regions) during the task but not at rest. Second, the attentional modulation in V4 was largest at the peak of the evoked response and so could not be completely explained by prestimulus processes. On the contrary, we argue that comparing preparatory and evoked activity when the target interval is very brief places a premium on a strong preparatory set and best captures the interaction between preparatory signals and the visually driven response. When the duration of the target stimulus is very long, the evoked response can be affected by sensory adaptation and may be more related to endogenous signals generated during the target interval than to signals generated during the much earlier preparatory period.
Preparatory and evoked signals in regions directing spatial attention
The pattern of results described in FEF and IPS is also consistent with the hypothesis that preparatory and stimulus-evoked modulations are served by a single mechanism. The mean attentional modulations in FEF and IPS follow a smooth curve, suggesting that a single, short-lived attentional modulation occurred over the course of the trial.
An intriguing result of the current study is that the attentional biases (activity for attended versus unattended locations) in preparatory and stimulus-evoked signals in higher-level regions (FEF, IPS) were less correlated with each other than BOLD activity over the same interval in subjects at rest. This pattern of results can be explained as follows. In the experimental task, the correlation coefficient was calculated for a particular pair of time points (e.g., time points 4 and 6) across trials when subjects attended to a single location. This correlation coefficient, therefore, did not reflect any signal variability related to changes in the locus of attention. At rest, however, the subject's attention was not controlled and freely varied over trials. Therefore, the correlation of time points 4 and 6 was calculated across trials in which attention was directed at fixation, in the left upper field, lower right field, etc. Any variation in the locus of attention would produce correlated signal changes in regions with activity that depends critically on the locus of attention. Therefore, in FEF and IPS, higher correlations between nearby time points are expected at rest compared with the preparatory period of the experimental task.
Previous studies of preparatory and evoked activity
Two studies by Kastner and colleagues (Kastner et al., 1999; McMains et al., 2007) also examined the relationship between mean attentional modulations in a prestimulus, preparatory interval and in a stimulus-evoked interval. Consistent with our results, these studies revealed that attention-related modulations increased at progressively higher levels of the visual cortical hierarchy and that prestimulus attentional modulations were larger than poststimulus modulations in V1, FEF, and IPS. Discrepant with our results, however, Kastner and colleagues reported that prestimulus attentional modulations were larger than poststimulus modulations in V4 and that FEF and IPS had large stimulus-evoked attentional modulations.
These apparent discrepancies can be explained by task and methodological differences. First, our attentional modulation compared attending to a peripheral contralateral location versus attending to a peripheral ipsilateral location. Kastner et al. (1999), on the other hand, compared attending to a peripheral contralateral location versus maintaining attention at fixation. This may explain why Kastner and colleagues reported large stimulus-evoked attentional modulations in FEF and IPS whereas we did not, since sustained peripheral attention has been shown to activate both regions bilaterally (Kastner and Ungerleider, 2001; Corbetta and Shulman, 2002).
A second difference is that our study compared preparatory signals to the evoked response after a single brief (100 ms) stimulus. Kastner et al. (1999), on the other hand, compared the preparatory signals to the evoked response to a 10 s stream of rapidly presented objects. One possibility is that attentional modulations may have habituated over time with the long stimulus stream incorporated by Kastner et al. (1999). Alternatively, the attentional modulations in preparatory signals and in the initial stimulus-evoked response in V4 may be nonspecific for all cells representing the attended location, whereas over time the modulations become more selective for cells that prefer the stimuli along other dimensions besides just location.
Conclusions
Our results suggest that prestimulus signals can affect the coding of sensory information in the brain. For the specific case of spatial attention, modulations in preparatory BOLD activity can explain most of the attention-related modulations measured in the subsequent stimulus-evoked response. This suggests that a single mechanism underlies the attentional modulations measured in preparatory and stimulus-evoked BOLD signals. The additive effect of attention on the BOLD signal can be generated even in the absence of visual stimulation; stimulus-evoked activity then adds to this preexisting bias, resulting in increased activity for attended stimuli relative to unattended stimuli.
Footnotes
This work was supported by the J. S. McDonnell Foundation, the National Institute of Neurological Disorders and Stroke (Grants F30 NS057926-01 and R01 NS48013), the National Institute of Mental Health (Grant R01 MH71920-06), and the Marie Curie Chair European Union (MEXC-CT-2004-006783). We thank Drs. Giovanni d'Avossa, Ayelet Sapir, and Mark McAvoy for guidance with statistical analyses.
References
- Brainard DH. The Psychophysics Toolbox. Spat Vis. 1997;10:433–436. [PubMed] [Google Scholar]
- Bressler SL, Tang W, Sylvester CM, Shulman GL, Corbetta M. Top-down control of human visual cortex by frontal and parietal cortex in anticipatory visual spatial attention. J Neurosci. 2008;28:10056–10061. doi: 10.1523/JNEUROSCI.1776-08.2008. [DOI] [PMC free article] [PubMed] [Google Scholar]
- Britten KH, Shadlen MN, Newsome WT, Movshon JA. The analysis of visual motion: a comparison of neuronal and psychophysical performance. J Neurosci. 1992;12:4745–4765. doi: 10.1523/JNEUROSCI.12-12-04745.1992. [DOI] [PMC free article] [PubMed] [Google Scholar]
- Britten KH, Shadlen MN, Newsome WT, Movshon JA. Responses of neurons in macaque MT to stochastic motion signals. Vis Neurosci. 1993;10:1157–1169. doi: 10.1017/s0952523800010269. [DOI] [PubMed] [Google Scholar]
- Britten KH, Newsome WT, Shadlen MN, Celebrini S, Movshon JA. A relationship between behavioral choice and the visual responses of neurons in macaque MT. Vis Neurosci. 1996;13:87–100. doi: 10.1017/s095252380000715x. [DOI] [PubMed] [Google Scholar]
- Buracas GT, Boynton GM. The effect of spatial attention on contrast response functions in human visual cortex. J Neurosci. 2007;27:93–97. doi: 10.1523/JNEUROSCI.3162-06.2007. [DOI] [PMC free article] [PubMed] [Google Scholar]
- Corbetta M, Shulman GL. Control of goal-directed and stimulus-driven attention in the brain. Nat Rev Neurosci. 2002;3:201–215. doi: 10.1038/nrn755. [DOI] [PubMed] [Google Scholar]
- Desimone R, Duncan J. Neural mechanisms of selective visual attention. Annu Rev Neurosci. 1995;18:193–222. doi: 10.1146/annurev.ne.18.030195.001205. [DOI] [PubMed] [Google Scholar]
- Giesbrecht B, Weissman DH, Woldorff MG, Mangun GR. Pre-target activity in visual cortex predicts behavioral performance on spatial and feature attention tasks. Brain Res. 2006;1080:63–72. doi: 10.1016/j.brainres.2005.09.068. [DOI] [PubMed] [Google Scholar]
- Gold JI, Shadlen MN. The neural basis of decision making. Annu Rev Neurosci. 2007;30:535–574. doi: 10.1146/annurev.neuro.29.051605.113038. [DOI] [PubMed] [Google Scholar]
- Heuer HW, Britten KH. Optic flow signals in extrastriate area MST: comparison of perceptual and neuronal sensitivity. J Neurophysiol. 2004;91:1314–1326. doi: 10.1152/jn.00637.2003. [DOI] [PubMed] [Google Scholar]
- Hopfinger JB, Buonocore MH, Mangun GR. The neural mechanisms of top-down attentional control. Nat Neurosci. 2000;3:284–291. doi: 10.1038/72999. [DOI] [PubMed] [Google Scholar]
- Jack AI, Shulman GL, Snyder AZ, McAvoy M, Corbetta M. Separate modulations of human V1 associated with spatial attention and task structure. Neuron. 2006;51:135–147. doi: 10.1016/j.neuron.2006.06.003. [DOI] [PubMed] [Google Scholar]
- Kastner S, Pinsk MA, De Weerd P, Desimone R, Ungerleider LG. Increased activity in human visual cortex during directed attention in the absence of visual stimulation. Neuron. 1999;22:751–761. doi: 10.1016/s0896-6273(00)80734-5. [DOI] [PubMed] [Google Scholar]
- Kastner S, Ungerleider LG. The neural basis of biased competition in human visual cortex. Neuropsychologia. 2001;39:1263–1276. doi: 10.1016/s0028-3932(01)00116-6. [DOI] [PubMed] [Google Scholar]
- Li X, Lu ZL, Tjan BS, Dosher BA, Chu W. Blood oxygenation level-dependent contrast response functions identify mechanisms of covert attention in early visual areas. Proc Natl Acad Sci U S A. 2008;105:6202–6207. doi: 10.1073/pnas.0801390105. [DOI] [PMC free article] [PubMed] [Google Scholar]
- Luck SJ, Chelazzi L, Hillyard SA, Desimone R. Neural mechanisms of spatial selective attention in areas V1, V2, and V4 of macaque visual cortex. J Neurophysiol. 1997;77:24–42. doi: 10.1152/jn.1997.77.1.24. [DOI] [PubMed] [Google Scholar]
- Maunsell JH, Treue S. Feature-based attention in visual cortex. Trends Neurosci. 2006;29:317–322. doi: 10.1016/j.tins.2006.04.001. [DOI] [PubMed] [Google Scholar]
- McMains SA, Fehd HM, Emmanouil TA, Kastner S. Mechanisms of feature- and space-based attention: response modulation and baseline increases. J Neurophysiol. 2007;98:2110–2121. doi: 10.1152/jn.00538.2007. [DOI] [PubMed] [Google Scholar]
- Moore T, Armstrong KM. Selective gating of visual signals by microstimulation of frontal cortex. Nature. 2003;421:370–373. doi: 10.1038/nature01341. [DOI] [PubMed] [Google Scholar]
- Müller NG, Kleinschmidt A. The attentional ‘spotlight's’ penumbra: center-surround modulation in striate cortex. Neuroreport. 2004;15:977–980. doi: 10.1097/00001756-200404290-00009. [DOI] [PubMed] [Google Scholar]
- Munneke J, Heslenfeld DJ, Theeuwes J. Directing attention to a location in space results in retinotopic activation in primary visual cortex. Brain Res. 2008;1222:184–191. doi: 10.1016/j.brainres.2008.05.039. [DOI] [PubMed] [Google Scholar]
- Pelli DG. The VideoToolbox software for visual psychophysics: transforming numbers into movies. Spat Vis. 1997;10:437–442. [PubMed] [Google Scholar]
- Pessoa L, Kastner S, Ungerleider LG. Neuroimaging studies of attention: from modulation of sensory processing to top-down control. J Neurosci. 2003;23:3990–3998. doi: 10.1523/JNEUROSCI.23-10-03990.2003. [DOI] [PMC free article] [PubMed] [Google Scholar]
- Purdon PL, Weisskoff RM. Effect of temporal autocorrelation due to physiological noise and stimulus paradigm on voxel-level false-positive rates in fMRI. Hum Brain Mapp. 1998;6:239–249. doi: 10.1002/(SICI)1097-0193(1998)6:4<239::AID-HBM4>3.0.CO;2-4. [DOI] [PMC free article] [PubMed] [Google Scholar]
- Ress D, Backus BT, Heeger DJ. Activity in primary visual cortex predicts performance in a visual detection task. Nat Neurosci. 2000;3:940–945. doi: 10.1038/78856. [DOI] [PubMed] [Google Scholar]
- Reynolds JH, Chelazzi L. Attentional modulation of visual processing. Annu Rev Neurosci. 2004;27:611–647. doi: 10.1146/annurev.neuro.26.041002.131039. [DOI] [PubMed] [Google Scholar]
- Reynolds JH, Heeger DJ. The normalization model of attention. Neuron. 2009;61:168–185. doi: 10.1016/j.neuron.2009.01.002. [DOI] [PMC free article] [PubMed] [Google Scholar]
- Reynolds JH, Pasternak T, Desimone R. Attention increases sensitivity of V4 neurons. Neuron. 2000;26:703–714. doi: 10.1016/s0896-6273(00)81206-4. [DOI] [PubMed] [Google Scholar]
- Ruff CC, Blankenburg F, Bjoertomt O, Bestmann S, Freeman E, Haynes JD, Rees G, Josephs O, Deichmann R, Driver J. Concurrent TMS-fMRI and psychophysics reveal frontal influences on human retinotopic visual cortex. Curr Biol. 2006;16:1479–1488. doi: 10.1016/j.cub.2006.06.057. [DOI] [PubMed] [Google Scholar]
- Ruff CC, Bestmann S, Blankenburg F, Bjoertomt O, Josephs O, Weiskopf N, Deichmann R, Driver J. Distinct causal influences of parietal versus frontal areas on human visual cortex: evidence from concurrent TMS-fMRI. Cereb Cortex. 2008;18:817–827. doi: 10.1093/cercor/bhm128. [DOI] [PMC free article] [PubMed] [Google Scholar]
- Sapir A, d'Avossa G, McAvoy M, Shulman GL, Corbetta M. Brain signals for spatial attention predict performance in a motion discrimination task. Proc Natl Acad Sci U S A. 2005;102:17810–17815. doi: 10.1073/pnas.0504678102. [DOI] [PMC free article] [PubMed] [Google Scholar]
- Serences JT, Yantis S, Culberson A, Awh E. Preparatory activity in visual cortex indexes distractor suppression during covert spatial orienting. J Neurophysiol. 2004;92:3538–3545. doi: 10.1152/jn.00435.2004. [DOI] [PubMed] [Google Scholar]
- Sestieri C, Sylvester CM, Jack AI, d'Avossa G, Shulman GL, Corbetta M. Independence of anticipatory signals for spatial attention from number of nontarget stimuli in the visual field. J Neurophysiol. 2008;100:829–838. doi: 10.1152/jn.00030.2008. [DOI] [PMC free article] [PubMed] [Google Scholar]
- Shadlen MN, Britten KH, Newsome WT, Movshon JA. A computational analysis of the relationship between neuronal and behavioral responses to visual motion. J Neurosci. 1996;16:1486–1510. doi: 10.1523/JNEUROSCI.16-04-01486.1996. [DOI] [PMC free article] [PubMed] [Google Scholar]
- Silver MA, Ress D, Heeger DJ. Neural correlates of sustained spatial attention in human early visual cortex. J Neurophysiol. 2007;97:229–237. doi: 10.1152/jn.00677.2006. [DOI] [PMC free article] [PubMed] [Google Scholar]
- Sugrue LP, Corrado GS, Newsome WT. Matching behavior and the representation of value in the parietal cortex. Science. 2004;304:1782–1787. doi: 10.1126/science.1094765. [DOI] [PubMed] [Google Scholar]
- Sylvester CM, Shulman GL, Jack AI, Corbetta M. Asymmetry of anticipatory activity in visual cortex predicts the locus of attention and perception. J Neurosci. 2007;27:14424–14433. doi: 10.1523/JNEUROSCI.3759-07.2007. [DOI] [PMC free article] [PubMed] [Google Scholar]
- Sylvester CM, Jack AI, Corbetta M, Shulman GL. Anticipatory suppression of nonattended locations in visual cortex marks target location and predicts perception. J Neurosci. 2008;28:6549–6556. doi: 10.1523/JNEUROSCI.0275-08.2008. [DOI] [PMC free article] [PubMed] [Google Scholar]
- Talairach J, Tournoux P. Co-planar stereotaxic atlas of the human brain. New York: Thieme Medical; 1988. [Google Scholar]
- Uka T, DeAngelis GC. Contribution of middle temporal area to coarse depth discrimination: comparison of neuronal and psychophysical sensitivity. J Neurosci. 2003;23:3515–3530. doi: 10.1523/JNEUROSCI.23-08-03515.2003. [DOI] [PMC free article] [PubMed] [Google Scholar]
- Van Essen DC, Drury HA, Dickson J, Harwell J, Hanlon D, Anderson CH. An integrated software suite for surface-based analyses of cerebral cortex. J Am Med Inform Assoc. 2001;8:443–459. doi: 10.1136/jamia.2001.0080443. [DOI] [PMC free article] [PubMed] [Google Scholar]
- Williford T, Maunsell JH. Effects of spatial attention on contrast response functions in macaque area V4. J Neurophysiol. 2006;96:40–54. doi: 10.1152/jn.01207.2005. [DOI] [PubMed] [Google Scholar]