

Abstract
α-Synuclein (α-syn) plays a prominent role in the degeneration of midbrain dopaminergic (mDA) neurons in Parkinson's disease (PD). However, only a few studies on α-syn have been performed in the mDA neurons in vivo, which may be attributed to a lack of α-syn transgenic mice that develop PD-like severe degeneration of mDA neurons. To gain mechanistic insights into the α-syn-induced mDA neurodegeneration, we generated a new line of tetracycline-regulated inducible transgenic mice that overexpressed the PD-related α-syn A53T missense mutation in the mDA neurons. Here we show that the mutant mice developed profound motor disabilities and robust mDA neurodegeneration, resembling some key motor and pathological phenotypes of PD. We also systematically examined the subcellular abnormalities that appeared in the mDA neurons of mutant mice and observed a profound decrease of dopamine release, the fragmentation of Golgi apparatus, and the impairments of autophagy/lysosome degradation pathways in these neurons. To further understand the specific molecular events leading to the α-syn-dependent degeneration of mDA neurons, we found that overexpression of α-syn promoted a proteasome-dependent degradation of nuclear receptor-related 1 protein (Nurr1), whereas inhibition of Nurr1 degradation ameliorated the α-syn-induced loss of mDA neurons. Given that Nurr1 plays an essential role in maintaining the normal function and survival of mDA neurons, our studies suggest that the α-syn-mediated suppression of Nurr1 protein expression may contribute to the preferential vulnerability of mDA neurons in the pathogenesis of PD.
Introduction
Parkinson's disease (PD) is pathologically characterized by a preferential loss of midbrain dopaminergic (mDA) neurons and the presence of α-synuclein (α-syn)-positive intracytoplasmic inclusions named Lewy bodies (LBs) and Lewy neurites (Schapira, 1997; Spillantini et al., 1997). Whereas both missense and multiplication mutations of α-syn cause the early-onset autosomal dominant familial form of PD, the α-syn gene locus also associates with the more common sporadic PD (Polymeropoulos et al., 1997; Singleton et al., 2003; Satake et al., 2009; Simón-Sánchezet al., 2009). Together, these genetic and pathological studies clearly point out an important role of α-syn in the pathogenesis of PD.
Extensive studies have been performed to understand the underlying pathogenic mechanisms of α-syn-induced cell loss. It has been shown that overexpression of both wild-type (WT) and PD-related mutant α-syn leads to a variety of cytotoxicity, including the impairment of proteasome and lysosome activities (Stefanis et al., 2001; Tanaka et al., 2001; Cuervo et al., 2004; Chen et al., 2006), the disruption of ER/Golgi transport (Gosavi et al., 2002; Cooper et al., 2006; Lin et al., 2009), the perturbation of the mitochondrial function (Hsu et al., 2000; Song et al., 2004; Martin et al., 2006; Nakamura et al., 2011), and the inhibition of synaptic transmission (Nemani et al., 2010). However, most of these results were obtained from cell lines and non-mDA neurons. It remains to be determined whether these pathogenic pathways are pathophysiologically relevant to the degeneration of mDA neurons.
Although the loss of nigral dopamine (DA) neurons underlie the main motor syndrome of PD, the progress of PD research has been especially hindered by a lack of an effective mouse genetic model that carries PD-related genetic mutations and develops progressive degeneration of mDA neurons (Hisahara and Shimohama, 2010). Many lines of PD-related mutant α-syn transgenic mice have been generated previously; however, few of them exhibited robust and progressive degeneration of mDA neurons (van der Putten et al., 2000; Kahle et al., 2001; Matsuoka et al., 2001; Lee et al., 2002; Richfield et al., 2002; Gispert et al., 2003; Thiruchelvam et al., 2004; Chesselet, 2008; Harvey et al., 2008; Wakamatsu et al., 2008; Lin et al., 2009). Noticeably, only scarce or low levels of transgenic α-syn expression were observed in the mDA neurons of these mutant mice, in which the transgenic α-syn is often under the transcriptional control of pan-neuronal promoters or a rat tyrosine hydroxylase (TH) promoter.
To investigate the pathogenic mechanism of α-syn-dependent dopaminergic dysfunction in vivo, we generated a new line of α-syn transgenic mice by driving the expression of PD-related A53T α-syn in the mDA neurons using a binary tetracycline-dependent inducible gene expression system. The mutant mice developed profound movement disorders as well as robust and progressive mDA neurodegeneration, which thereby may provide a valuable mouse genetic model to investigate how α-syn induces the degeneration of mDA neurons. Toward this direction, we systematically examined the α-syn-mediated subcellular abnormalities in the mDA neurons of mutant mice. Moreover, we identified nuclear receptor-related 1 protein (Nurr1), a master transcription factor for the development and maintenance of mDA neurons, as a key downstream molecular target for the α-syn-induced preferential degeneration of mDA neurons.
Materials and Methods
Generation of PITX3-IRES2-tTA mice
A 7.2 kb SacI/SacI mouse genomic DNA fragment carrying the pituitary homeobox 3 (PITX3) gene was isolated from the RPCI-22 (129S6/SvEvTac) Mouse BAC Library (BACPAC Resources Center). The IRES2-tTA-LNL cassette was inserted into the SacII site after the stop codon in exon 4 of the PITX3 gene. The IRES2 DNA fragment subcloned from the pIRES2-EGFP vector (BD Biosciences) was inserted in front of the start codon of the tetracycline transactivator (tTA) coding region derived from the pTet-tTAk vector (Invitrogen), which was followed by a LoxP-flanked neomycin (LNL) expression cassette (Mombaerts et al., 1996). The targeting vector was linearized and transfected into 129/SvJ ES cells, which were later subjected to G418 selection for 7 d. The G418-resistant ES clones were picked and screened by Southern blot analysis for the correctly targeted clones.
Two positive ES clones were expanded and injected into blastocysts. The resulting male chimera mice were bred with wild-type C57BL/6J female mice to obtain PITX3+/IRES2-tTA-LNL mice. PITX3+/IRES2-tTA-LNL mice were then crossed with Cre transgenic mice (Lakso et al., 1996) to generate PITX3+/IRES2-tTA mice in which the LNL cassette was deleted by Cre-mediated DNA recombination. The PITX3+/IRES2-tTA mice were backcrossed with C57BL/6J mice to generate PITX3+/IRES2-tTA congenic mice on a C57BL/6J strain background. A mouse whole genome scan, which examined 96 microsatellite markers across 19 mouse autosomes, was performed to identify the offspring with the highest C57BL/6J genome content. The PITX3+/IRES2-tTA mice with >95% C57BL/6J strain background were crossbred with tetO-A53T transgenic mice.
The mice were housed in a 12 h light/dark cycle and fed regular diet ad libitum. All mouse work followed the guidelines approved by the Institutional Animal Care and Use Committees of the National Institute of Child Health and Human Development, NIH.
Genotyping
Genomic DNA was prepared from tail biopsy using DirectPCR Lysis Reagent (Viagen Biotech) and subjected to PCR amplification using specific sets of PCR primers for each genotype, including PITX3-IRES2-tTA transgenic mice (PITX3-F, GACTGGCTTGCCCTCGTCCCA; PITX3-R, GTGCACCGAGGCCCCAGATCA), α-syn A53T transgenic mice (PrpEx2-F, TACTGCTCCATTTTGCGTGA; SNCA-R, TCCAGAATTCCTTCCTGTGG), and tetO-H2Bj-GFP mice (H2BGFP0872F, AAGTTCATCTGCACCACCG; H2BGFP1416R, TCCTTGAAGAAGATGGTGCG).
Doxycycline treatment
Regular diet was replaced with DOX-containing (200 mg/kg of diet) food pellets (Bio-Serv) for the DOX treatment. To suppress the expression of transgene from the early embryonic stages to the weaning age, DOX diet was provided to the breeders. The new weanlings were then continually fed with DOX diet for any chosen time period.
Behavior tests
Rotarod test.
As described previously (Chandran et al., 2007), mice were placed onto a rotating rod with auto-acceleration from 0 to 40 rpm for 1 min (San Diego Instruments). The length of time the mouse stayed on the rotating rod was recorded.
Open-field test.
As described previously (Chandran et al., 2007), the ambulatory and rearing activities of mice were measured by the Flex-Field activity system (San Diego Instruments). Flex-Field software was used to trace and quantify mouse movement in the unit as the number of beam breaks per 30 min.
Grip strength measurement and gait analyses followed the same experimental procedures we described previously (Lai et al., 2007).
Immunohistochemistry and light microscopy
As described previously (Cai et al., 2005), mice were killed and perfused via cardiac infusion with 4% paraformaldehyde in cold PBS. To obtain frozen sections, brain tissues were removed and submerged in 30% sucrose for 24 h and sectioned at 40 μm thickness using a cryostat (CM1950; Leica). Antibodies specific to glial fibrillary acidic protein (GFAP; 1:400; Sigma-Aldrich), ionized calcium-binding adaptor molecule-1 (Iba1; 1:500; Wako Chemicals), tyrosine hydroxylase (TH; 1:1000, Dynal Biotech; 1:200, Santa Cruz Biotechnology), α-synuclein (C20, 1:1000; Santa Cruz Biotechnology), human α-synuclein (syn211, 1:500; Santa Cruz Biotechnology), mitochondrial cytochrome C oxidase subunit I (MTCOI) (1:500; Invitrogen), ubiquitin (1:2000; Dako), GM130 (1:500; BD Biosciences), GM160 (1:2000; Sigma-Aldrich), calnexin (1:1000; Sigma-Aldrich), dopamine transporter (DAT; 1:5000; Millipore), LAMP1 (1:100; Assay Designs), LAMP2 (1:100, Abcam), LC3B (1:200; Sigma-Aldrich), p62 (1:100; Sigma-Aldrich), and Nurr1 (1:200; Sigma-Aldrich) were used as suggested by manufacturers. Alexa 488- or Alexa 568-conjugated secondary antibody (1:500; Invitrogen) was used to visualize the staining.
Fluorescence images were captured using a laser-scanning confocal microscope (LSM 510; Zeiss). The paired images in all the figures were collected at the same gain and offset settings. Postcollection processing was applied uniformly to all paired images. The images were presented as either a single optic layer after acquisition in z-series stack scans at 0.8 μm intervals from individual fields or displayed as maximum-intensity projections to represent confocal stacks.
Image analysis
For the quantitative assessment of various marker protein accumulations and distributions in the soma or nucleus, images were taken using identical settings and exported to ImageJ (NIH) for imaging analyses. Images were converted to an 8-bit color scale (fluorescence intensity from 0 to 255) using ImageJ. Areas of interest were first selected by the polygon or freehand selection tools and then subjected to measurement by mean optical intensities or area fractions. The mean intensity for the background area was subtracted from the selected area to determine the net mean intensity.
Stereology
According to the mouse brain in stereotaxic coordinates, a series of coronal sections across the striatum (every eighth from bregma, 1.18 to −0.82 mm) and midbrain (every fourth section from bregma, −2.92 to −3.88 mm) were processed for TH and Nissl staining and visualized using the Vectastain ABC kit (Vector Laboratories). The number of TH- and Nissl-positive neurons was assessed using the Optical Fractionator function of Stereo Investigator 8, an unbiased stereological procedure (MicroBrightField). The length of TH-positive fibers was estimated using the Space Balls function (Stereo Investigator 8). Three or more mice were used per genotype at each time point. Counters were blinded to the genotypes of the samples. The sampling scheme was designed to have a coefficient of error of <10% to get reliable results. The stereological analyses of cell numbers and TH-positive fibers in the striatum were performed under the 100× objective of a Zeiss Axio microscope (Imager A1).
Measurement of dopamine content in the striatum by HPLC
After obtaining the wet weight of the tissue, per 100 mg of tissue, 500 μl of a solution that contained 9.2 ml of glacial acetic acid and 460 μl of phosphoric acid per liter of water was added. The tissue was sonicated, and after centrifugation, the supernatant was frozen and stored at −70°C or colder until assayed for catechols by liquid chromatography with electrochemical detection after batch alumina extraction (Holmes et al., 1994). Briefly, mobile-phase solution containing octanesulfonic acid as an ion pairing agent was pumped isocratically through a reverse-phase liquid chromatographic column. Catechols were quantified by the current produced after exposure of the eluate to a flow-through electrode set to oxidizing and then reducing potentials in series, with recordings from the last electrode reflecting reversibly oxidized species.
In vivo microdialysis
Six pairs of 3- to 4-month-old A53T and littermate nTg mice were used for microdiaylsis. Microdialysis guide cannulas (CMA/7 guide cannula; CMA/Microdialysis) were stereotaxically implanted, in the right dorsolateral striatum (anterior, +1.2 mm; lateral, −2 mm; vertical, −1.5 mm), relative to bregma and dura surface. Concentric microdialysis probes (membrane length, 2 mm; CMA/7, CMA/Microdialysis) were implanted in freely moving mice 24 h after surgery. The probes were perfused with artificial CSF (148 mm NaCl, 2.7 mm KCl, 1.2 mm CaCl2, 0.85 mm MgCl2, pH 7.4) at a constant flow rate of 1.0 μl/min. Samples were collected every 20 min and analyzed for dopamine by HPLC coupled to electrochemical detection. Microdialysis data were calculated as concentration (nanomolars) in every sample collected (20 μl). Baseline concentration was defined as the last of three consecutive stabled samples (at least 2 h). The effect of potassium (60 mm) perfusion on extracellular concentration of dopamine in the dorsolateral striatum area was assessed by two-way ANOVA for repeated measures (genotype as the between-subject factor and time as the within factor). Every time point was compared by the Bonferroni post hoc test, in case of significant interaction of the main factors. X-intercept values in net gain/loss of extracellular dopamine concentration were averaged and compared by the Student's t test. Values of *p < 0.05 and **p < 0.01 were considered statistically significant.
Fast-scan cyclic voltammetry
Fast-scan cyclic voltammetry was used to investigate the levels and kinetics of DA release evoked by electrical stimulation in dorsal striatum. Coronal brain slices (400 μm) containing the dorsal striatum from 3- to 4-month-old mice (A53T, 6; nTg, 6) were prepared as described previously (Mateo et al., 2005). Slices were kept in oxygenated modified Krebs' buffer (in mm: 126 NaCl, 2.5 KCl, 1.2 NaH2PO4, 2.4 CaCl2, 1.2 MgCl2, 25 NaHCO3, 11 glucose, 20 HEPES, 0.4 l-ascorbic acid) at room temperature until required. Recordings were made at 34°C in a chamber perfused at a rate of 1 ml/min. Cylindrical carbon-fiber microelectrodes (50–100 μm of exposed fiber) were prepared with T650 fibers (6 μm diameter; Goodfellow) and inserted into a glass pipette (Cahill et al., 1996). The carbon-fiber electrode was held at −0.4 V, and the potential was increased to +1.2 V and back at 400 V/s every 100 ms. DA release was evoked by a rectangular, electrical pulse stimulation (50–600 μA, 0.6 ms per phase, biphasic) applied every 4 min. Data collection was done using LabVIEW software (National Instruments). Ten cyclic voltammograms of charging currents were recorded as background before stimulation, and the average was subtracted from data collected during and after stimulation. Maximum amplitudes of extracellular DA responses were obtained from the input/output function (I/O) curves. I/O curves were constructed by plotting stimulus current versus concentration of DA response amplitude over a range of stimulus intensities. The data were analyzed using the Demon Voltammetry and Analysis software suite (Yorgason et al., 2011).
Tissue homogenization and Western blot
Brain tissues were homogenized in RIPA buffer (Sigma-Aldrich) supplemented with protease inhibitors (Roche Applied Science). After a 15 min incubation on ice, protein extracts were clarified by centrifugation at 15,000 × g for 30 min at 4°C. The supernatants were quantified for protein content using an assay kit based on bicinchoninic acid (Thermo Fisher Scientific) and separated by 4–12% NuPage BisTris-PAGE (Invitrogen) using MES running buffer (Invitrogen). After transfer to nitrocellulose membranes, the membranes were immunoblotted with the appropriate dilutions of the primary antibody: human α-synuclein (1:1000; Santa Cruz Biotechnology) and β-actin (1:3000; Sigma-Aldrich) at 4°C. Signals were visualized by enhanced chemiluminescence development (Thermo Fisher Scientific) and quantified on a Scion Image System.
Laser capture microdissection and quantitative reverse transcriptase-PCR assay
Brains of PITX3/H2BjGFP control double-transgenic and PITX3/H2BjGFP/A53T triple-transgenic mice were quickly dissected out and sectioned at 16 μm thickness by a cryostat. The midbrain coronal sections (from bregma, −2.92 to −3.88 mm) were collected consecutively onto a PAN membrane frame slide (Applied Biosystems) and stored at −80°C until laser capture microdissection (LCM). The GFP-positive cells in both the substantia nigra pars compacta (SNC) and ventral tegmental area (VTA) were isolated and captured by an ArturusXT microdissection system with fluorescent illumination (Applied Biosystems) at the following working parameters: spot size, 7 μm; power, 50–70 mW; duration, 20 μs. The GFP-positive neurons from SNC and VTA were isolated and captured onto LCM Macro Caps (Applied Biosystems). The total RNA was extracted with the PicoPure Isolation kit (Applied Biosystems) after the protocol provided by the manufacturer. The cDNA was synthesized from 160 ng of RNA by the First Strand kit (QIAGEN CA) after genomic DNA elimination.
The SYBR Green real-time PCR detection method was used to compare gene expression in mDA neurons between PITX3/H2BjGFP control double-transgenic and PITX3/H2BjGFP/A53T triple-transgenic mice using primers specific for mouse Nurr1, PITX3, TH, DAT, vesicular monoamine transporter 2 (VMAT2), and Ret, respectively. All the primers were tested by the manufacturer for an accurate and scalable measurement of multiple gene expression (QIAGEN). The primers for α-syn were designed to amplify both mouse and human α-syn, and their sequences are AAATGTTGGAGGAGCAGTGG and GAAGGCATTTCATAAGCCTCA, respectively. The amplification of PCR was normalized by GAPDH expression.
Transfection and cycloheximide treatment
Human embryonic kidney (HEK293) cells were cultured in DMEM supplemented with 10% heat-inactivated fetal bovine serum (Invitrogen) and penicillin/streptomycin (Sigma-Aldrich). Transfection of HEK293 cells was performed using Fugene 6 Transfection Reagent (Roche Applied Science) according to the manufacturer's instructions. Six micrograms of the cDNAs for WT and A53T α-syn in pcDNA3 vector were transfected in all cases. Thirty-six hours after transfection with empty vector, WT or A53T α-syn HEK293 cells were incubated with cycloheximide (100 μg/ml; Sigma-Aldrich) for 2, 5, and 8 h. The cells were lysed in SDS buffer (50 mm Tris-HCl, 150 mm NaCl, 2 mm EDTA, pH 7.6, and 2% SDS), and Nurr1 protein levels were determined by Western blot analysis.
Midbrain neuronal culture and treatment
Primary midbrain neuronal cultures were prepared from postnatal day 0 pups of breeding pairs fed with DOX. Briefly, individual midbrain containing SNC and VTA was subjected to papain digestion (5 U/ml; Worthington Biochemicals) for 40 min at 37°C. The digested tissue was carefully triturated into single cells using increasingly smaller pipette tips. Cells were then centrifuged at 250 × g for 5 min and resuspended in warm basal medium Eagle supplemented with 5% heat-inactivated fetal bovine serum, 1× B27 (Invitrogen), 1× N2 (Invitrogen), 1× GlutaMAX, 0.45% d-glucose (Sigma-Aldrich), 10 U/ml penicillin (Invitrogen), and 10 μg/ml streptomycin (Invitrogen). Dissociated cells from each midbrain were equally divided, plated onto four 12-mm-round coverslips precoated with poly-d-lysine and laminin (BD Biosciences), and maintained at 37°C in a 95% O2 and 5% CO2 humidified incubator. Twenty-four hours after seeding, the cultures were switched to serum-free medium supplemented with 5 μm cytosine β-d-arabinofuranoside (Sigma-Aldrich), which was used to suppress the proliferation of glia.
Cells in two sister coverslips were maintained in the presence of 1 μg/ml DOX after plating. After 5 DIV, DOX-treated or nontreated cells were exposed to 10 nm MG132 (Sigma-Aldrich) or DMSO vehicle control for another 48 h. Then, cells were fixed with 4% paraformaldehyde and 4% sucrose in PBS for 15 min, permeabilized by 0.1% Triton X-100 for 5 min, and blocked in 10% nonimmune donkey serum for 1 h at room temperature. Cells were then double labeled with primary antibodies against TH (monoclonal, 1:1000; Santa Cruz Biotechnology) and Nurr1 (rabbit polyclonal, 1:1000; Sigma) overnight at 4°C in a humidified chamber. After three washes with PBS, donkey-derived secondary antibodies conjugated to Alexa Fluor 488 and Alexa Fluor 546 (1:1000; Invitrogen) were applied and incubated for 1 h at room temperature in the dark. After extensive washes, nuclei were stained with Topro3 iodide (1:1000; Invitrogen). Finally, coverslips were mounted on glass slides with Prolong Gold antifade reagent (Invitrogen), and fluorescence signals were detected using a laser-scanning confocal microscope (LSM 510; Zeiss). The total number of all TH-positive neurons on each of the four sister coverslips was counted under a 25× objective. The survival rate of TH-positive neurons of each midbrain was calculated by dividing the number of TH-positive neurons on the non-DOX-treated coverslip with the number of TH-positive neurons on the DOX-treated coverslip from the same midbrain preparation. For quantification of the nuclear Nurr1 level, the confocal settings for image acquisition were maintained for all cells. Image stacks were flattened into a single image by maximum projection and analyzed with ImageJ.
Statistical analysis
Statistical analysis was performed using GraphPad Prism 5 (GraphPad Software). Data were presented as mean ± SEM. Statistical significance was determined by comparing means of different groups using the t test or ANOVA followed by the post hoc test (*p < 0.05; **p < 0.01; ***p < 0.001).
Results
Targeted expression of transgene in the mDA neurons by a binary tetracycline-dependent gene expression system
To selectively express transgenes in the mDA neurons, we developed a line of tTA mice, in which the expression of tTA is under the same transcriptional control of PITX3. PITX3 is predominantly expressed in the mDA neurons starting from embryonic day 11.5 (E11.5) and throughout adulthood (Smits and Smidt, 2006). Interestingly, the onset of endogenous α-syn gene expression in the SNC also starts on E11.5 (Zhong et al., 2010).
To minimize a potential impact on the expression of PITX3, which is involved in the development and survival of mDA neurons (Smits and Smidt, 2006), we used a knock-in approach to insert an IRES2-tTA expression cassette into the 3′-untranslated region of PITX3 (Fig. 1A). The targeted modification of the PITX3 gene locus was verified by Southern blot and PCR analysis (Fig. 1B,C). In addition, the insertion of tTA did not influence the expression of PITX3 mRNA in the PITX3-IRES2-tTA heterozygous knock-in (+/tTA) mice compared with that of littermate controls (+/+) (Fig. 1D).
Figure 1.

Generation of PITX3-IRES2-tTA knock-in mice. A, The schematic diagram depicts the generation of PITX3-IRES2-tTA knock-in mice in which the IRES2-tTA expression cassette was inserted into the SacII site of PITX3 exon 4 immediately after the stop codon (asterisk) of the PITX3 gene. B, Southern blot of genomic DNA isolated from mouse embryonic stem (ES) cell clones shows a correct gene targeting of the PITX3 gene locus in ES cell clones 1E2 and 1F1. As predicted, the insertion of the IRES2-tTA-LNL gene-targeting cassette into the PITX3 gene locus generated a new 3.7 kb AflII fragment in clones 1E2 and 1F1 (arrowhead). C, A PCR assay shows the correct modification of the PITX3 allele through amplification of genomic DNA prepared from mouse tail biopsy. D, The quantification of PITX3 mRNA expression in the midbrain tissues dissected from 6-month-old nTg and PITX3-IRES2-tTA (tTA) heterozygous knock-in mice. The level of PITX3 mRNA expression was measured by qRT-PCR. Six or more mice were used for each genotype. E, The schematic diagram depicts the generation of PITX3-IRES2-tTA/tetO-H2Bj-GFP (H2GFP) double-transgenic mice. Sample images show the distribution of the nuclear localized H2Bj/GFP fusion protein in the midbrain coronal sections of 1-month-old H2GFP double-transgenic mice. The mDA neurons in both the SNC and VTA were revealed by immunostaining with an antiserum against TH. Scale bars: top, 100 μm; bottom, 50 μm. F, H2GFP (green) and TH (red) costaining in different brain regions. Scale bar, 100 μm.
The functionality of the PITX3-IRES2-tTA gene regulation unit was verified in PITX3-IRES2-tTA/ tetO-H2Bj-GFP double-transgenic mice, in which the histone-GFP fusion protein was restricted to the nucleus of TH-positive mDA neurons in both the SNC and VTA of midbrain (Fig. 1E,F). Meanwhile, no tTA-induced GFP expression was detected in neurons of other brain regions, including the TH-positive norepinephrine neurons in the locus ceruleus (Fig. 1F). Therefore, the PITX3-IRES2-tTA mice provide a useful genetic tool to deliver transgenes selectively into the mDA neurons.
Target expression of PD-related A53T α-syn in the mDA neurons of A53T inducible transgenic mice
To investigate the molecular pathology of PD-related mutant α-syn-induced degeneration of mDA neurons in vivo, we generated PITX3-IRES2-tTA/tetO-A53T inducible transgenic mice by crossbreeding PITX3-IRES2-tTA heterozygous knock-in mice with the E2 line of tetO-A53T transgenic mice that we had previously developed (Lin et al., 2009; Gu et al., 2010) (Fig. 2A). For simplicity, the PITX3-IRES2-tTA/tetO-A53T double-transgenic mice were later referred as A53T transgenic mice without specification.
Figure 2.
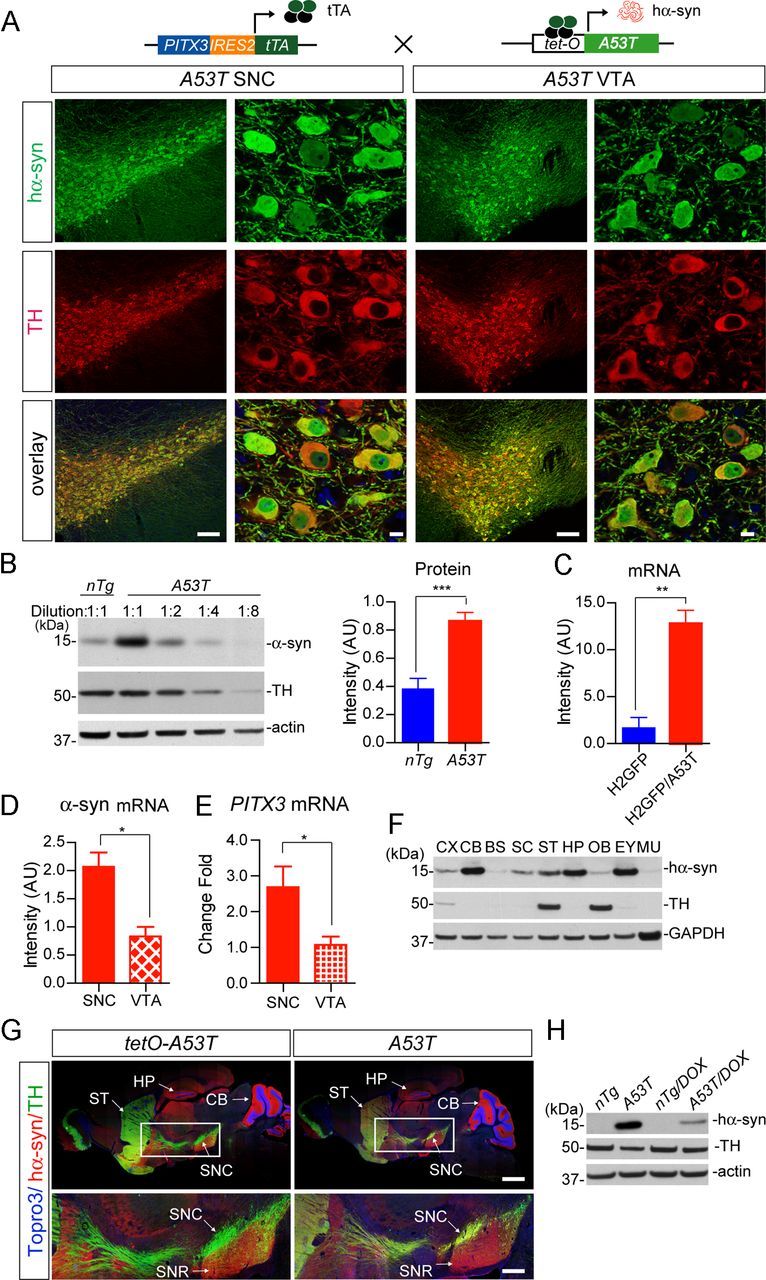
Target expression of PD-related human A53T α-syn in mDA neurons. A, The diagram depicts the generation of A53T inducible transgenic mice through crossbreeding PITX3-IRES2-tTA and tetO-A53T mice. Immunofluorescent images show the selective expression of human α-syn (hα-syn) in the mDA neurons at both the SNC and VTA regions of 1-month-old PITX3-IRES2-tTA/tetO-A53T (A53T) mice. The expression of human A53T α-syn (green) was revealed by an antiserum (syn211) specifically against hα-syn. The mDA neurons were visualized by TH immunostaining (red), and the nucleus was marked by Topro3 staining (blue). Scale bars: low-magnification images, 100 μm; high-magnification images, 10 μm. B, Western blot determines the level of α-syn overexpression in the midbrain homogenate from 1-month-old A53T transgenic mice compared with littermate nTg mice using an antiserum (C20) recognizing both human and mouse α-syn. A dilution series of midbrain homogenates from A53T mice were used for Western blot analysis. β-Actin (actin) and TH were used as the loading control. The Bar graph estimates the level of α-syn overexpression (normalized against the TH expression) in the midbrain of 1-month-old A53T mice compared with that of age-matched littermate nTg mice (n ≥ 3 per genotype). Data were presented as mean ± SEM. ***p < 0.001. C, qRT-PCR determines the levels of α-syn mRNA expression in isolated mDA neurons from 2-week-old H2GFP and littermate PITX3-IRES2-tTA/ tetO-H2Bj-GFP/tetO-A53T (H2GFP/A53T) transgenic mice (n > 1000 cells per genotype). The primers for α-syn were designed to amplify both mouse and human α-syn. GAPDH was used to normalize the gene expression from different samples. Data were presented as mean ± SEM. **p < 0.01. D, E, qRT-PCR determines the levels of α-syn and PITX3 mRNA expression in isolated mDA neurons from the SNC and VTA of 2-week-old H2GFP/A53T transgenic mice (n > 1000 cells from SNC and VTA, respectively). GAPDH was used to normalize the gene expression from different samples. Data were presented as mean ± SEM. *p < 0.001. F, Regional distribution of hα-syn in the brain, eye, and skeletal muscle of 6-month-old A53T transgenic mice using a human α-syn-specific antibody (syn211). An equal amount of protein was loaded into each lane. GAPDH was used as the loading control. G, Images show staining of hα-syn (red), TH (green), and Topro3 (blue) in the sagittal section of 1-month-old tetO-A53T single-transgenic and A53T double-transgenic mice. Scale bars: top, 1 mm; bottom, 400 μm. H, Suppression of exogenous hα-syn expression in striatum homogenate from 1-month-old A53T mice treated with DOX starting from early embryonic stages. CX, Cerebral cortex; CB, cerebellum; BS, brainstem; SC, spinal cord; ST, striatum; HP, hippocampus; OB, olfactory bulb; EY, eye; MU, skeletal muscle; SNR: substantia nigra pars reticulate.
The presence of A53T α-syn in the mDA neurons of A53T transgenic mice was visualized by immunostaining with an antibody specific against human α-syn (Fig. 2A). The α-syn signals appeared in the cytosol, nucleus, and processes of both the SNC and VTA mDA neurons (Fig. 2A). Western blot analysis revealed a twofold to fourfold increase of α-syn protein expression in the midbrain homogenate from 1-month-old A53T mice using an antibody that recognizes both mouse and human α-syn (Fig. 2B). Consistent with the Western blot results, quantitative reverse transcriptase-PCR (qRT-PCR) analysis using primers that are conserved between mouse and human α-syn transcripts showed a proximal fourfold increase of α-syn mRNA expression in the mDA neurons isolated from the SNC region of 2-week-old A53T mice compared with littermate controls (Fig. 2C). In addition, the expression level of human α-syn mRNA in the SNC mDA neurons was approximately twofold higher compared with that of VTA mDA neurons (Fig. 2D), which correlates with a differential expression of PITX3 gene in these two regions (Fig. 2E).
The transgenic human α-syn protein was also detected in other brain regions, including the cerebral cortex, cerebellum, brainstem, spinal cord, striatum, hippocampus, and olfactory bulb, as shown by Western blot analysis of 1-month-old A53T mice (Fig. 2F). We also examined the distribution of exogenous α-syn protein in the brain of 1-month-old A53T single- (tetO-A53T) and double-transgenic mice by coimmunostaining TH and human α-syn. Intensive transgenic α-syn staining was found in the molecular layer of cerebellum, the CA3 region of the hippocampus, and the ventral parts of the midbrain and striatum of both A53T single- and double-transgenic mice (Fig. 2G). These data indicate a PITX3-tTA-independent “leaky” expression of transgenic α-syn protein in these areas. In contrast, the upregulation of human α-syn protein expression was only observed in the soma and neurites of mDA neurons in the A53T double-transgenic mice, which further confirms the selective targeting of transgene expression in the mDA neurons by the PITX3-tTA driver line (Fig. 2G). The overexpression of transgenic α-syn protein in the dorsal striatum may reflect the intensive innervation from the mDA neurons to this region, because of the enrichment of α-syn protein in the axon terminals (Maroteaux et al., 1988).
In addition to its neuronal expression, the PITX3 gene is also expressed in the lens and skeletal muscles during development (Smidt et al., 2004). Accordingly, human α-syn was found in the eyes at a fairly high level, whereas it was barely detectable in the skeletal muscles of 1-month-old A53T mice (Fig. 2F). Finally, in this “tet-off” inducible gene expression system (Kistner et al., 1996), the expression of human α-syn could be significantly suppressed (>75%) in A53T mice after being fed with DOX-containing chow for 3 weeks (Fig. 2H).
A53T transgenic mice developed profound motor disabilities
A53T transgenic mice developed normally and survived for the full expected life span but displayed profound posture and motor abnormalities during both resting and moving states. To characterize the motor abnormalities, we measured the motor alterations of A53T mice at 1, 2, 6, and 12 months of age using open-field, rotarod, and gait tests. In the open-field test, A53T mice displayed only a moderate decrease in horizontal movement starting at 2 months of age but showed a dramatic reduction in vertical movement (rearing) at 1 month of age (Fig. 3A,B). In the rotarod test, A53T mice exhibited significant impairment at 2 months of age (Fig. 3C). In the automatic gait test, A53T mice displayed significant unsteady and shorter gaits at as early as 1 month of age (Fig. 3D). Additionally, A53T mice started to gain less body weight at 2 months of age (Fig. 3E). Interestingly, treatment with DOX starting from embryonic stages prevented the mutant mice from developing any rearing impairment when tested at 1 month of age (Fig. 3F).
Figure 3.

A53T α-syn inducible transgenic mice display profound motor disabilities. A, B, The horizontal movement (A) and vertical movement (B) of male A53T (n = 14) and control nTg (n = 12) mice as well as tetO-A53T (n = 13) and PITX3-IRES2-tTA (tTA; n = 13) single-transgenic mice were measured using the open-field test at 1, 2, 6, and 12 months of age. Data were presented as mean ± SEM. *p < 0.05; ***p < 0.001. C, The latency to fall was quantified by the rotarod test at 1, 2, 6, and 12 months of age for the same cohort of A53T and control mice used in A. Data were presented as mean ± SEM. *p < 0.05; ***p < 0.001. D, The stride length of 1-month-old male A53T and control mice (n ≥ 5 animals per genotype; n ≥ 20 strides per animal) was measured using the automatic TreadScan gait analysis system. Data were presented as mean ± SEM. *p < 0.05; **p < 0.01. E, Male A53T transgenic and control mice (n ≥ 10 animals per genotype) were weighed monthly for 20 months. Data were presented as mean ± SEM. ***p < 0.001. F, Vertical movements of 2-month-old A53T (n = 8) and control (Ctrl; including nTg, tTA, and tetO-A53T; n = 7) mice with regular chow compared with age-matched A53T (n = 6) and control (n = 5) mice with DOX-containing chow starting from earlier embryonic stages. Data were presented as mean ± SEM. *p < 0.05; **p < 0.01. G, The bar graph shows the grip strength of both the forelimb and hindlimb of 1-month-old male A53T (n = 10) and age-matched control nTg (n = 6) mice as well as tTA (n = 8) and tetO-A53T (n = 4) single-transgenic mice.
The expression of human A53T α-syn in muscles seemed not to compromise the muscle strength of A53T mice, which performed equally well as the littermate controls in both the forelimb and hindlimb grip strength tests (Fig. 3G). In addition, although a significant leaky expression of transgenic α-syn was observed in the cerebellum and other brain regions of tetO-A53T single-transgenic mice (Fig. 2F,G), these mice did not develop any significant motor impairments in both the open-field and rotarod tests (Lin et al., 2009). Together, these findings demonstrate that the mDA neuron-specific expression of human A53T α-syn causes profound motor impairments in mice and suggest that A53T α-syn may exert a significant impact on the function and survival of mDA neurons.
A53T transgenic mice developed robust and progressive degeneration of mDA neurons
To determine whether the expression of A53T α-syn in the mDA neurons causes neuronal loss, we counted the numbers of TH-positive mDA neurons in the SNC, VTA, and retro-rubral field (RRF) of A53T mice at 1, 6, 12, and 20 months of age using an unbiased stereological approach (Chandran et al., 2007). A robust and progressive loss of mDA neurons was observed in the SNC and VTA of A53T mice (Fig. 4A–E). There was approximately 15% mDA neuron loss in the SNC of A53T mice at 1 month of age, and by the time the mice were 12 months of age, approximately 40% were lost in the SNC (Fig. 4A,B). A significant neuronal loss in the SNC of 8- and 18-month-old A53T mice was also shown by Nissl staining, which also confirmed the physical loss of mDA neurons in these mice (Fig. 4C). Intriguingly, there was no significant difference in the loss of mDA neurons between 12- and 20-month-old A53T mice (Fig. 4B), even though the levels of A53T α-syn expression were comparable at these two time points when normalized against TH expression (Fig. 4F). In addition, no significant loss of TH-positive mDA neurons was found in the SNC of 20-month-old tetO-A53T single-transgenic mice, indicating that the leaky expression of transgenic α-syn protein is not sufficient to cause TH-positive neurodegeneration in these mice (Fig. 4B).
Figure 4.
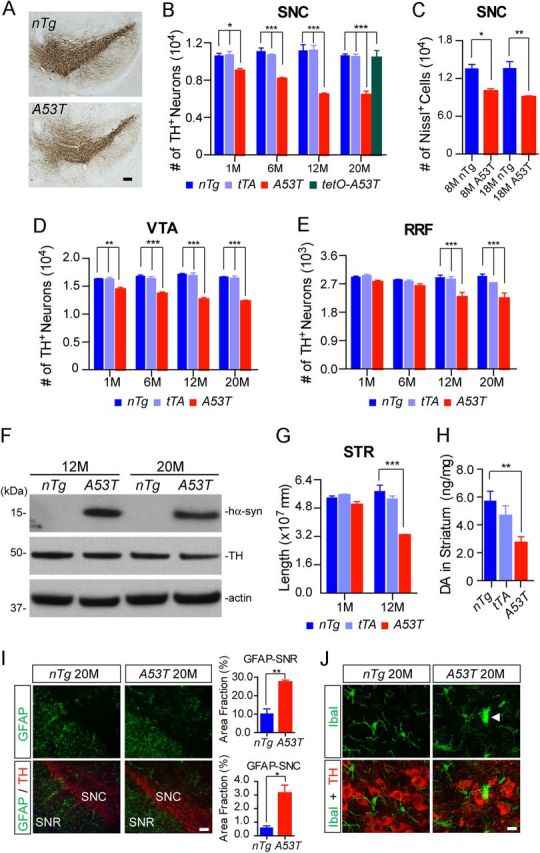
A53T α-syn inducible transgenic mice develop progressive and robust degeneration of mDA neurons. A, TH staining (brown puncta) of the midbrain coronal sections of 12-month-old A53T and littermate nTg mice. Scale bar, 100 μm. B, D, E, Numbers of TH-positive neurons remaining in the SNC (B), VTA (D), and RRF (E) of A53T and control nTg mice as well as tTA single-transgenic mice at 1, 6, 12, and 20 months of age (n ≥ 3 per genotype per time point). B, The number of TH-positive neurons in the SNC of 20-month-old littermate tetO-A53T single-transgenic mice (n = 3) was also counted. Data were presented as mean ± SEM. *p < 0.05; **p < 0.01; ***p < 0.001. C, Numbers of Nissl-stained neurons in the SNC of 8- and 18-month-old A53T and nTg mice (n = 3 per genotype). Data were presented as mean ± SEM. *p < 0.05; **p < 0.01. F, Western blot analysis shows the expression levels of α-syn in the striatum homogenates of 12- and 20-month-old nTg and A53T mice using an antibody specific to human α-syn. G, Total length of TH-positive neurites in the striatum (STR) of A53T and nTg mice at 1 and 12 months of age (n = 3 per genotype). Data were presented as mean ± SEM. ***p < 0.001. H, Steady levels of DA in the striatum of 6-month-old nTg (n = 9), tTA (n = 8), and A53T (n = 11) mice. Data were presented as mean ± SEM. **p < 0.01. I, GFAP (green) and TH (red) costaining in the midbrain coronal sections of 20-month-old nTg and A53T mice. Scale bar, 100 μm. The bar graphs show the areas of SNC and substantia nigra pars reticulate (SNR) in 20-month-old nTg and A53T mice occupied by GFAP staining (n = 3 per genotype). Data were presented as mean ± SEM. *p < 0.05; **p < 0.01. J, Iba1 (green) and TH (red) costaining in the midbrain coronal sections of 20-month-old nTg and A53T mice. The arrowhead points to an activated microglia. Scale bar, 10 μm.
Besides neuronal loss, we also found that the length and complexity of TH-positive neurites were significantly reduced in the striatum of 12-month-old A53T mice (Fig. 4G). The steady-state level of dopamine was also decreased in the striatum of 6-month-old A53T mice (Fig. 4H).
Finally, a significant increase in astrocytosis and microgliosis was also observed in the midbrain of 20-month-old A53T mice (Fig. 4I,J). Together, these newly developed A53T mice perhaps represent the most robust PD-related mouse genetic model for A53T α-syn-mediated mDA neurodegeneration to date. They may serve as a useful in vivo system to investigate the pathogenic mechanisms of α-syn-induced mDA neurodegeneration.
Abnormal accumulation of α-syn in the soma and neurites of mDA neurons from the A53T mice
We conducted a series of immunohistochemical and biochemical analyses to identify potential subcellular phenotypes in the mDA neurons from A53T mice. A dramatic increase in α-syn accumulation was observed in the cytosol and nucleus of mDA neurons in the A53T mice at both 12 and 18 months of age compared with controls, in which α-syn staining was mainly presented as small puncta in the neurites (Fig. 5A). The α-syn appeared to form aggregates as evidenced by the appearance of α-syn-positive high-molecular-weight (HMW) bands in the Western blot analysis (Fig. 5B). However, no typical LB-like spherical α-syn-positive inclusions were found in the soma of mDA neurons from A53T mice. Instead, α-syn-positive aggregates were found mainly in the axons and axon terminals (Fig. 5C,D). The α-syn-positive aggregates also costained with TH and seemed to form large vacuolar structures (Fig. 5C,D, arrowheads). The occurrence of this widespread abnormal accumulation of α-syn in the cytosol, nucleus, and axons of mDA neurons may trigger the downstream pathogenic cascades leading to the dysfunction and eventual loss of mDA neurons in the A53T mice.
Figure 5.

Subcellular distribution of A53T α-syn in the mDA neurons. A, α-syn (green) and TH (red) staining in the SNC of 12- and 18-month-old A53T and 12-month-old nTg mice. Topro3 (blue) staining was used to mark the nucleus. Scale bar, 10 μm. B, Western blot analysis shows the formation of α-syn-positive HMW bands in the midbrain homogenate of 1- and 18-month-old A53T and littermate control nTg mice. The bar graph indicates an increase of accumulation of HMW α-syn in the brain of A53T mice. Data were presented as mean ± SEM. **p < 0.01. C, Human α-syn (green) and TH (red) staining in the sagittal sections of globus pallidus of 1- and 12-month-old A53T and 12-month-old nTg mice. Arrowheads point to the swelling axon fragments. The nucleus was visualized by Topro3 (blue) staining. Scale bars: top, 50 μm; bottom, 10 μm. D, α-syn (green) and TH (red) staining in the striatum of 12-month-old nTg mice as well as 1- and 12-month-old A53T mice. The α-syn in A53T mice was revealed by staining with a human α-syn-specific antiserum (syn211). Arrowheads point to a swelling axon terminal. The nucleus was visualized by Topro3 (blue) staining. Scale bar, 10 μm.
The perturbation of Golgi apparatus in the mDA neurons of A53T mice
Overexpression of either WT or PD-related mutant α-syn has been shown to disrupt the Golgi structures in cultured cells and striatal neurons (Gosavi et al., 2002; Lin et al., 2009). We then examined the structure of the Golgi apparatus in the mDA neurons of 12-month-old A53T transgenic mice using the cis-Golgi marker GM130 and trans-Golgi marker GLG1 as described previously (Lin et al., 2009). In the nTg mice, GM130 staining revealed elaborated tubular structures primarily stacked at one side of mDA neurons (Fig. 6A, asterisks). The GM130-positive tubules, however, appeared thinner and fragmented in the mDA neurons of A53T mice (Fig. 6A,B, asterisks). Similarly, GLG1 staining revealed smooth vesicular structures clustered around the nucleus of mDA neurons in nTg mice (Fig. 6C). In contrast, GLG1 staining was significantly weakened and fragmented in the mDA neurons of A53T mice, correlated with a significantly reduced occupancy of GLG1 staining in the soma (Fig. 6C,D). These observations together demonstrate that overexpression of A53T α-syn significantly disrupted the normal structure of the Golgi network in the mDA neurons, which may impair the ER/Golgi trafficking and contribute to the abnormal accumulation of α-syn in the soma of mDA neurons.
Figure 6.
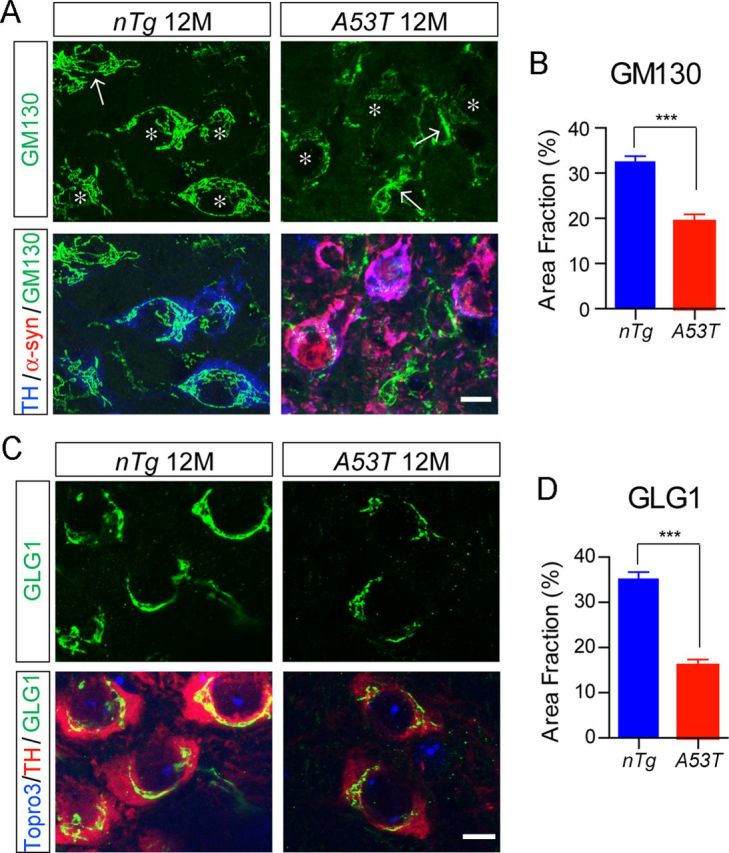
Overexpression of A53T α-syn perturbs the normal morphology of Golgi apparatus in the mDA neurons. A, GM130 (green), human α-syn (red), and TH (blue) costaining in the midbrain sections of 12-month-old nTg and A53T mice. Asterisks label TH-positive neurons. Arrows point to non-TH-positive cells. Scale bar, 10 μm. B, Percentage of cytoplasm area of TH-positive neurons covered by GM130 staining (n = 3 animals per genotype; n ≥ 18 neurons per animal). Data were presented as mean ± SEM. ***p < 0.001. C, GLG1 (green) and TH (red) costaining in the midbrain sections of 12-month-old nTg and A53T mice. Topro3 (blue) staining marked the nucleus. Scale bar, 10 μm. D, Percentage of cytoplasm area of TH-positive neurons covered by GLG1 staining (n = 3 animals per genotype; n ≥ 18 neurons per animal). Data were presented as mean ± SEM. ***p < 0.001.
The impairment of autophagy/lysosome pathways in the mDA neurons of A53T mice
Overexpression of A53T α-syn has been shown previously to impair the autophagy and lysosome activities in cell lines and neuronal cultures (Stefanis et al., 2001; Cuervo et al., 2004; Rockenstein et al., 2005). However, it remains to be determined whether A53T α-syn affects the autophagy/lysosome-mediated degradation pathway in the mDA neurons in vivo. We examined the intensity, size, and distribution of typical marker proteins of the autophagy/lysosome pathways in the mDA neurons of A53T mice by immunostaining and Western blot analysis.
P62 is involved in the initiation of preautophagosomal structures, which in turn binds to microtubule-associated protein 1 light chain 3 (LC3) for the formation of autophagosome (Bjørkøy et al., 2005). By immunostaining midbrain sections, we found that the expression of P62 was significantly elevated in the mDA neurons of A53T mice at both 1 and 18 months of age (Fig. 7A,B). A similar increase of P62 expression was also observed in the midbrain homogenate of 1-month-old A53T mice by Western blot analysis (Fig. 7C). Interestingly, an extensive overlap of P62 and α-syn staining was observed in the soma of mDA neurons (Fig. 7A, arrowheads).
Figure 7.
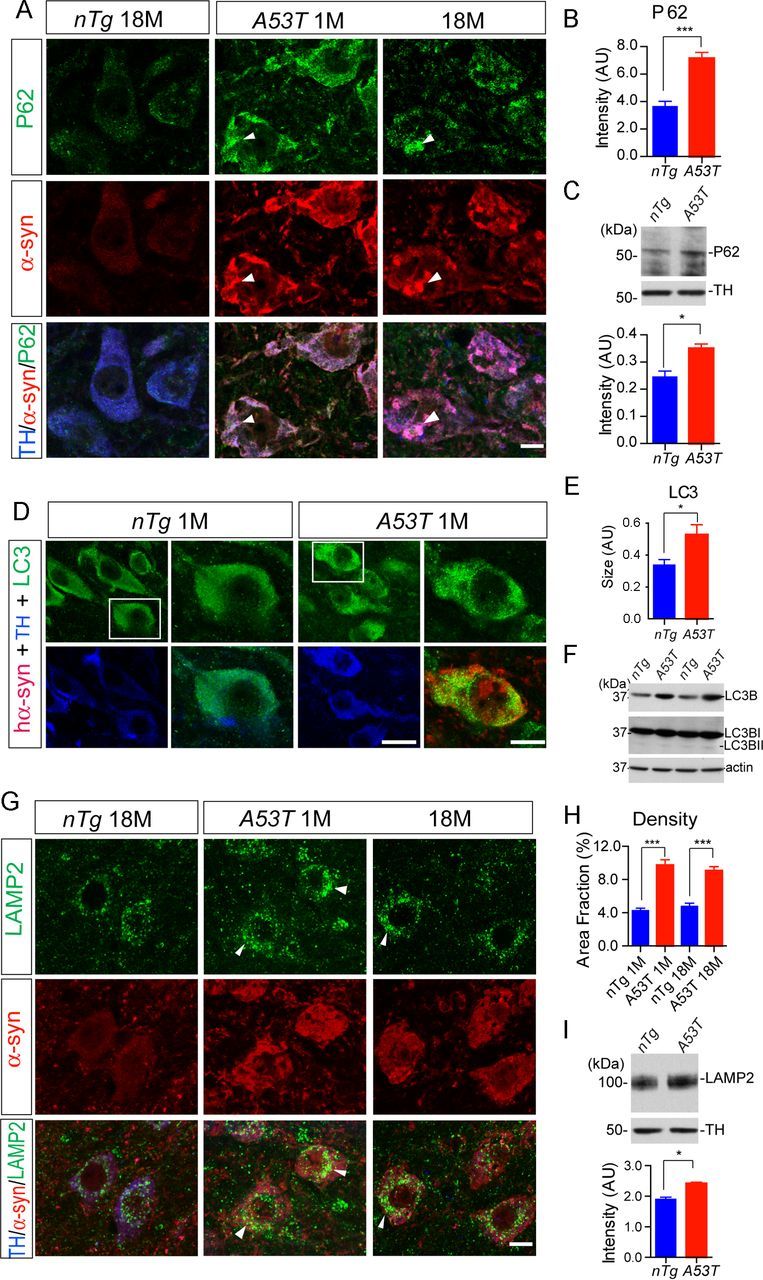
Overexpression of α-syn alters autophagosome and lysosome marker protein expression in the mDA neurons. A, P62 (green), α-syn (red), and TH (blue) costaining in the midbrain sections of 18-month-old nTg mice as well as 1- and 18-month-old A53T mice. Arrowheads point to areas with substantial overlap of P62 and α-syn staining. Scale bar, 10 μm. B, Quantification of P62 staining intensity in the TH-positive neurons of 1-month-old nTg and A53T mice (n = 3 animals per genotype; n ≥ 20 neurons per animal). Data were presented as mean ± SEM. ***p < 0.001. C, Western blot analysis shows the expression of P62 in the midbrain homogenate of 1-month-old A53T and littermate nTg mice. TH was used as loading control. The bar graph depicts the P62 expression levels normalized with TH in the midbrain homogenate of 1-month-old A53T and littermate nTg mice (n = 3 per genotype). Data were presented as mean ± SEM. *p < 0.05. D, LC3 (green), human α-syn (red), and TH (blue) costaining in the midbrain section of 1-month-old nTg and littermate A53T mice. Scale bars: low-magnification images, 50 μm; high-magnification images, 10 μm. E, The size of LC3-positive puncta in the TH-positive neurons of 1-month-old nTg and A53T mice (n = 3 animals per genotype; n ≥ 20 neurons per animal). Data were presented as mean ± SEM. *p < 0.05. F, Western blot shows the expression of LC3BI and LC3BII in the midbrain homogenate of 1-month-old A53T and nTg mice. G, LAMP2 (green), α-syn (red), and TH (blue) costaining in the midbrain sections of 1-month-old nTg and littermate A53T mice. Scale bar, 10 μm. H, Density of LAMP2-positive puncta in the TH-positive neurons of 1-month-old nTg and A53T mice (n = 3 animals per genotype; n ≥ 20 neurons per animal). Data were presented as mean ± SEM. ***p < 0.001. I, Western blot analysis shows the expression of LAMP2 in the midbrain homogenate of 1-month-old A53T and littermate nTg mice. TH was used as the loading control. The bar graph depicts the LAMP2 expression levels normalized with TH in the midbrain homogenate of 1-month-old A53T and littermate nTg mice (n = 3 per genotype). Data were presented as mean ± SEM. *p < 0.05.
After the activation of the autophagy pathway, LC3 is lipidated and translocated from cytosol to the autophagosome membrane (Kabeya et al., 2000). In line with this notion, overexpression of α-syn seemed to increase the intensity and size of LC3-positive puncta in the soma of mDA neurons from the A53T mice (Fig. 7D,E). Western blot analyses revealed a significant increase in LC3B levels in the midbrain homogenate of 1-month-old A53T mice; however, no significant increase of the lipidated LC3 (LC3B-II) accumulation was detected (Fig. 7F).
Autophagosome eventually fuses with the lysosome for degradation, in which lysosomal protein LAMP2 serves as an adaptor for the chaperone-mediated autophagy (CMA) pathway (Cuervo and Dice, 2000). Interestingly, we observed a significant increase in the density of LAMP2-positive puncta in the soma of mDA neurons of A53T mice at both 1 and 18 months of age (Fig. 7G–I). In support of these findings, the level of LAMP2 protein was also significantly upregulated in the midbrain homogenate of 1-month-old A53T mice (Fig. 7I). In contrast, the expression level and distribution pattern of LAMP1, another lysosomal marker protein, was not significantly altered in the mDA neurons of A53T mice (data not shown). Together, these observations indicate that overexpression of A53T α-syn may impair the autophagy/lysosome pathway in the mDA neurons, in which the P62-mediated nucleation of preautophagasomal structures and LAMP2-involved CMA may be particularly affected.
Overexpression of A53T α-syn modestly affected the ubiquitin proteasome system pathway in mDA neurons
Previous reports suggest that the ubiquitin proteasome system (UPS) is compromised by overexpression of α-syn in cell lines and neurons (Betarbet et al., 2005; Chen et al., 2006; Lin et al., 2009). To investigate whether α-syn-induced impairment of UPS leads to the deposition of ubiquitin-positive protein aggregates, we examined the ubiquitin staining in the mDA neurons of A53T mice at different time points. Ubiquitin-positive clusters were observed in a few mDA neurons of 18-month-old A53T mice (Fig. 8A, arrowheads, arrowheads). However, the overall intensity and occurrence of ubiquitin-positive aggregates were comparable between the mDA neurons of 18-month-old nTg and A53T mice (Fig. 8B,C). Moreover, Western blot analysis showed no significant difference in the levels of HMW ubiquinated proteins from the midbrain homogenates of A53T and age-matched nTg mice (Fig. 8D). These results suggest that the overall UPS activities might not be significantly affected in the mDA neurons of A53T mice.
Figure 8.

Ubiquitination in the midbrain of 18-month old nTg and A53T mice. A, Representative images show ubiquitin (Ubi, green), α-syn (red), and TH (blue) staining of midbrain coronal sections of 18-month-old nTg and A53T mice. Arrowheads point to TH-positive neurons with apparent accumulation of Ubi-positive aggregates. Asterisks indicate a TH-positive neuron with little Ubi staining. Scale bar, 10 μm. B, C, Bar graphs depict the measurement of Ubi staining intensity (B) and surface area (C) covered by Ubi staining in the mDA neurons of 18-month-old nTg and A53T mice (n = 3 animals per genotype; n ≥ 24 mDA neurons per animal). D, Western blot shows the Ubi-positive HMW bands in the Triton X-100 soluble (TX-sol) and insoluble (TX-insol) fractions of midbrain homogenates of 1- and 20-month-old nTg and A53T mice.
Overexpression of A53T α-syn affected the size and density of midbrain axonal terminals
It has been shown that overexpression of α-syn impairs the neurotransmitter release in cortical and hippocampal neurons (Clayton and George, 1999; Nemani et al., 2010). We decided to investigate whether overexpression of A53T α-syn also inhibited the dopamine release of mDA neurons. The axon terminals of mDA neurons were visualized by DAT staining at the striatum, shown as small puncta surrounding the striatal neurons (Fig. 9A). It appeared that the size of DAT-positive staining was significantly enlarged in the 1-month-old A53T mice compared with littermate control nTg mice (Fig. 9A,B). Meanwhile, the density of DAT-positive staining was significantly decreased in the striatum of A53T mice compared with control nTg animals (Fig. 9A,C). Occasionally, large-swelling TH-positive staining with multiple DAT-positive small puncta was observed in the striatum of A53T mice (Fig. 9A, arrowhead). These observations are correlated with previous findings about reduced length and complexity of mDA axons in the striatum of 12-month-old A53T mice (Fig. 4G), suggesting a potential deficiency in dopaminergic transmission in these mice.
Figure 9.

Overexpression of A53T α-syn alters the morphology of mDA axon terminals. A, DAT (green) and TH (red) costaining in the striatum coronal sections from 1-month-old nTg and littermate A53T mice. Tropro3 was used to stain the nucleus (blue). Arrowheads marks a large swelling axon terminal. Scale bar, 10 μm. B, C, Size (B) and density (C) of DAT-labeled axon terminals in the striatum of 1-month-old nTg and A53T mice (n = 3 animals per genotype; n ≥ 4 sections per animal). Data were presented as mean ± SEM. *p < 0.05; ***p < 0.001.
Dopamine release was severely impaired at the striatum of A53T mice
In addition to the alterations of size and density of DAT staining, microdialysis and voltammetry experiments showed drastic impairment in dorsolateral striatal dopaminergic extracellular concentration and release (Fig. 10). The basal extracellular DA concentration in the dorsolateral striatum of 3- to 4-month old A53T mice and their wild-type littermates was measured using the no-net flux microdialysis technique in vivo (Chefer et al., 2006; Chandran et al., 2007). The basal extracellular DA level in the dorsolateral striatum of A53T mice was significantly lower than the controls (Fig. 10A; p < 0.05).
Figure 10.

Overexpression of A53T α-syn impairs DA release. A, The graph shows the no-net-flux plot of gain/loss of dialysate DA concentration (Cin − Cout) related to DA concentration in the perfusate (Cin). n = 6 per genotype. B, The no-net-flux X-intercept, considered as an average basal extracellular DA concentration, is reduced significantly in A53T mice. n = 6 per genotype. *p < 0.05. C, Effect of high potassium (60 mm KCl) perfusion on DA release differs significantly between groups. n = 6 per genotype. **p < 0.05. D) Representative DA traces (with cyclic voltammograms in inset) and color plots after a single-pulse stimulation (600 μA). In the color plots, the voltammetric current is encoded in color in z-axis and plotted against the applied potential (y-axis) and time (x-axis). E, The input/output curve of ex vivo voltammetry experiments shows a dramatic reduction of evoked DA release in A53T mice compared with nTg controls. n = 6 per genotype. *p < 0.05; **p < 0.01.
We next investigated whether A53T mDA neurons would show alterations in evoked DA release. Depolarizing concentrations of KCl (60 mm) were perfused through the microdialysis probe implanted in the dorsolateral striatum, and DA overflow was quantified. A significant decrease of evoked DA release was also observed in the striatum of A53T mice compared with the controls (Fig. 10B; p < 0.05).
Finally, after the microdialysis experiment, we also quantified the DA release in striatal slices of this cohort of A53T and littermate control nTg mice using an ex vivo voltammetry approach. The representative DA traces (with cyclic voltammograms; Fig. 10D, inset) and color plots after one single-pulse stimulation revealed a significant reduction of DA releases from the striatum of A53T mice compared with the nTg controls (Fig. 10D). The input/output curve also demonstrated a dramatic reduction of DA release in A53T mice (Fig. 10E; p < 0.01). In addition, a similarly significant reduction of evoked DA release was also observed in the dorsal striatum of 1-month-old A53T mice (data not shown). Together, the severe decrease of dopamine release in A53T mice may profoundly compromise the functions of mDA neurons and contribute to the early motor phenotypes developed in these mice.
Overexpression of A53T α-syn suppressed the expression and function of Nurr1 in the mDA neurons
The functional properties and survival of mDA neurons rely on the constitutive transcriptional activities of Nurr1, also known as nuclear receptor subfamily 4, group A, member 2 (NR4A2) (Perlmann and Wallén-Mackenzie, 2004). Nurr1 controls the transcription of TH, dopamine transporter (DAT), receptor tyrosine kinase Ret, and other genes essential for the function and maintenance of mDA neurons. Genetic ablation of Nurr1 after the terminal differentiation of mDA neurons leads to a PD-like progressive loss of mDA marker proteins and eventually the death of mDA neurons (Kadkhodaei et al., 2009). Interesting, these Nurr1 conditional knock-out mice also exhibit profound rearing impairments, whereas the locomotion is less affected when examined at 4 months of age, a phenomenon similar to the A53T mice (Fig. 3A,B). More interestingly, in postmortem PD brains the expression of Nurr1 is significantly decreased in the mDA neurons, which also coincidentally contain α-syn-positive inclusions (Chu et al., 2006). However, these observations in PD brains do not address whether the decreased Nurr1 levels are just an end-stage consequence or a more dynamic α-syn-dependent pathogenic mechanism directly involved in the disease.
To explore a potential pathogenic interplay between α-syn and Nurr1 in the degeneration of mDA neurons in PD, we examined the expression and function of Nurr1 in the mDA neurons of A53T mice. Nurr1 staining was located mainly in the nucleus but with a faint presence in the cytosol of mDA neurons (Fig. 11A,D). Nurr1 was also expressed by non-DA cells in the midbrain area (Fig. 11A,D, arrowheads). Interestingly, a dramatic reduction of nuclear Nurr1 expression was observed in a subset of mDA neurons in the SNC of 1-month-old A53T mice compared with control nTg mice (Fig. 11A–C, asterisks). Approximately 10% of TH-positive mDA neurons displayed almost complete loss of Nurr1 nuclear staining (Fig. 11A,C,D, asterisks). Intriguingly, a few TH-positive mDA neurons showed stronger Nurr1 staining (Fig. 11A, arrows). The administration of DOX did not reverse the overall decrease in Nurr1 staining (Fig. 11B). However, it did significantly reduce the percentage of TH-positive neurons with severe loss of Nurr1 (Fig. 11A,C). A similar reduction in Nurr1 expression was also observed in the VTA of 1-month-old A53T mice (data not shown). In contrast, the levels of Nurr1 nuclear staining were not affected in the midbrain non-DA cells of 1-month-old A53T mice (Fig. 11A,D, arrowheads).
Figure 11.
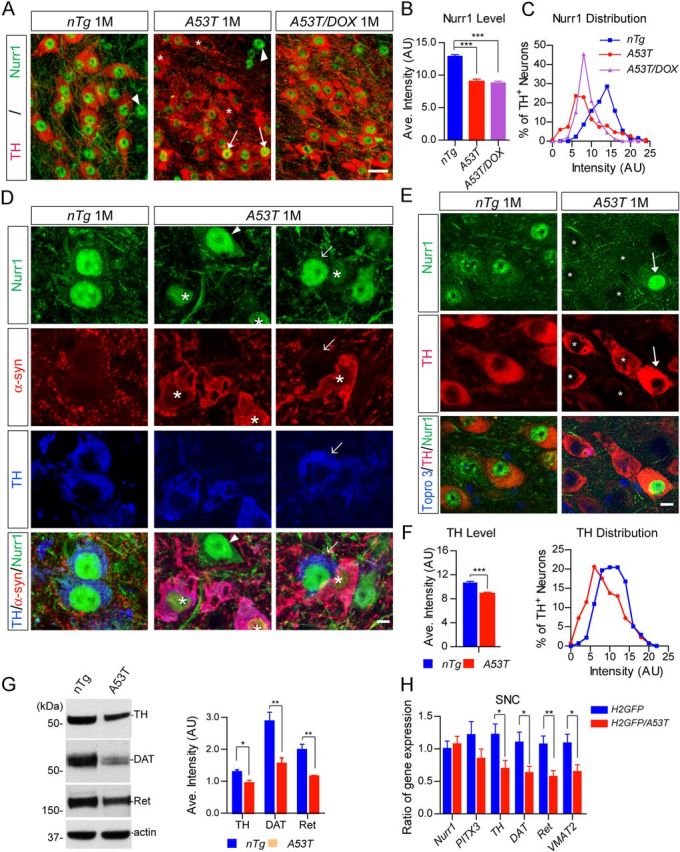
Exogenous expression of A53T α-syn suppresses the nuclear accumulation of Nurr1 and the expression of Nurr1-controlled dopaminergic genes. A, Nurr1 (green) and TH (red) costaining in the SNC coronal sections of 1-month-old of nTg, A53T, and DOX-treated A53T (A53T/DOX) mice. Asterisks indicate TH-positive neurons with severe loss of Nurr1 staining. Arrows mark the mDA neurons with intensified Nurr1 staining. Arrowheads point to non-DA cells stained with Nurr1. Scale bar, 20 μm. B, Intensity of Nurr1 signals in the nucleus of SNC mDA neurons from 1-month-old nTg, A53T, and A53T/DOX mice (n ≥ 3 animals per genotype; n ≥ 40 neurons per animal). Data were presented as mean ± SEM. ***p < 0.001. C, The distribution of TH-positive mDA neurons with expression of various levels of Nurr1 in the SNC of 1-month-old nTg, A53T, and A53T/DOX mice (n ≥ 3 animals per genotype; n ≥ 40 neurons per animal). D, Nurr1 (green), α-syn (red), and TH (blue) costaining in the midbrain sections of 1-month-old nTg and A53T mice. Asterisks mark TH-positive neurons with substantial somatic accumulation of α-syn. Arrowheads point to the Nurr1-expressing non-DA cells. Arrows indicate TH-positive neurons with little accumulation of α-syn in the soma. Scale bar, 10 μm. E, Nurr1 (green) and TH (red) costaining in the midbrain sections of 1-month-old nTg and A53T mice. Asterisks mark neurons with reduced expression of both Nurr1 and TH. Arrows point to neurons with increased Nurr1 and TH staining. F, The levels of TH staining in the soma of TH-positive mDA neurons of 1-month-old nTg and A53T mice. The line graph shows the distribution of TH signal intensities in the mDA neurons of 1-month-old nTg and A53T mice. Data were presented as mean ± SEM. ***p < 0.001. G, Western blots show TH, DAT, and Ret expression in the striatum homogenate from 1-month-old nTg and A53T mice. Bar graphs quantify the relative expression levels of TH, DAT, and Ret in the striatum homogenate of 1-month old nTg and A53T mice. Data were presented as mean ± SEM. *p < 0.05; **p < 0.01. H, qRT-PCR determines the levels of Nurr1, TH, DAT, VMAT2, and Ret mRNA expression in isolated mDA neurons from 2-week-old H2GFP and littermate H2GFP/A53T transgenic mice (n > 1000 cells per genotype). GAPDH was used to normalize the gene expression from different samples. Data were presented as mean ± SEM. *p < 0.05; **p < 0.01.
The presence of excess somatic α-syn seemed to correlate with the reduction of Nurr1 nuclear accumulation in the mDA neurons of 1-month-old A53T mice (Fig. 11D, asterisks). In contrast, TH-positive mDA neurons in the absence of somatic accumulation of α-syn (Fig. 11D, arrow) displayed normal Nurr1 nuclear staining compared with control nTg mDA neurons (Fig. 11D). Therefore, the heterogeneity of A53T α-syn accumulation in the soma of mDA neurons may contribute to the variation in the degree of reduced Nurr1 expression in the nucleus. Furthermore, concomitant with the decrease of Nurr1 nuclear expression, the levels of Nurr1-regulated TH expression were also significantly reduced in the soma of mDA neurons of 2-week-old and 1-month-old A53T mice (Fig. 11E,F). We also examined the levels of TH, DAT, and Ret protein expression by Western blot in the striatum homogenate from 1-month-old A53T and control mice. We also found a significant decrease of TH, DAT, and Ret expression in the A53T mice (Fig. 11G). Moreover, mRNA expression levels of TH, DAT, VMAT2, and Ret in the SNC DA neurons of 2-week-old A53T mice were also significantly decreased compared with those in the littermate control mice (Fig. 11H). The expression levels of Nurr1 and PITX3 mRNA, however, were comparable in these two groups of SNC DA neurons (Fig. 11H). Together, these observations demonstrate that overexpression of A53T α-syn in the mDA neurons suppresses the expression of Nurr1 protein, resulting in the downregulation of dopaminergic genes transcriptionally controlled by Nurr1.
Overexpression of α-syn promoted the proteasome-dependent degradation of Nurr1 protein
Because the expression of Nurr1 mRNA was comparable in the mDA neurons isolated from A53T and littermate nTg mice (Fig. 11H), we suspect that this α-syn-mediated suppression of Nurr1 expression may likely happen at the posttranslational level. A recent report in neural progenitor cells demonstrates that Nurr1 protein is subject to proteasome-dependent protein degradation during neuron development (Jo et al., 2009), which raises the possibility that α-syn may suppress the expression of Nurr1 protein by promoting Nurr1 protein degradation. In support of this notion, we found that transient expression of both WT and A53T α-syn in HEK293 cells suppressed the expression of endogenous Nurr1 protein, whereas inhibition of proteasome activities by the pan-proteasome inhibitor MG132 increased the expression of Nurr1 protein (Fig. 12A,B). Moreover, overexpression of both WT and A53T α-syn significantly reduced the half-life of Nurr1 protein (Fig. 12C,D), suggesting that α-syn plays an active role in regulating the stability of Nurr1 protein through a proteasome-dependent protein degradation pathway.
Figure 12.
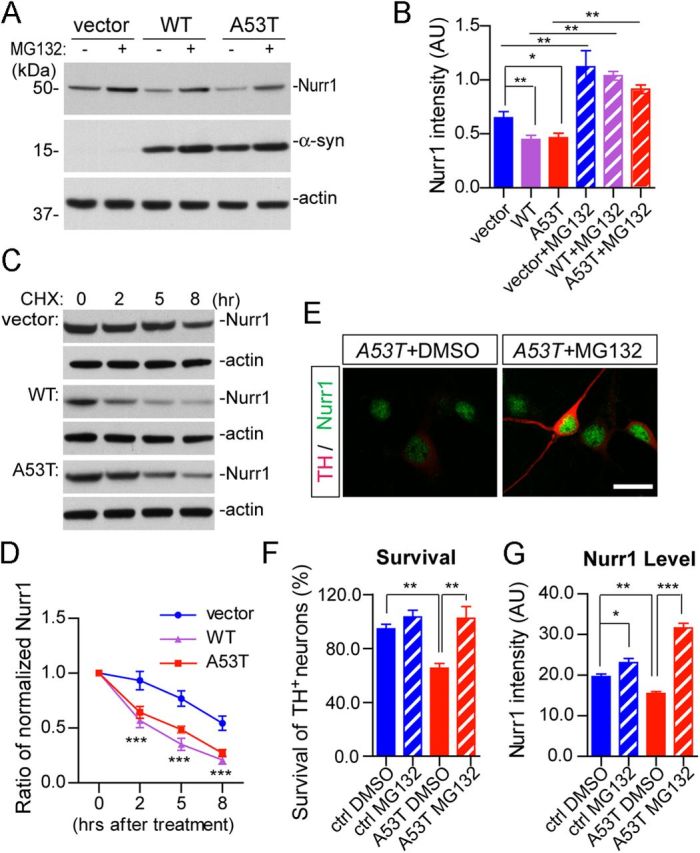
A53T α-syn promotes proteasome-dependent degradation of Nurr1 and inhibition of proteasome activities ameliorates A53T α-syn-induced loss of mDA neurons. A, Expression of endogenous Nurr1 protein in the HEK293 cells transfected with human WT or A53T α-syn cDNA. The transfected HEK293 cells were treated with either DMSO or 10 μm MG132 for 12 h before being lysed for Western blot analysis. β-Actin was used as the loading control. B, The bar graph summarizes the expression of endogenous Nurr1 in α-syn-transfected HEK293 cells treated with DMSO or MG132, from three independent experiments. Data were presented as mean ± SEM. *p < 0.05; **p < 0.01. C, Expression of Nurr1 in human WT or A53T α-syn-transfected HEK293 cells treated with cycloheximide (CHX) for 2, 5, or 8 h before being subjected to Western blot analysis. β-Actin was used as a loading control. D, The line graph traces the decay of endogenous Nurr1 protein in empty vector or α-syn-transfected HEK293 cells from four independent experiments in which CHX was used to block protein synthesis for 2, 5, and 8 h. Data were presented as mean ± SEM. ***p < 0.001. E, Expression of Nurr1 (green) and TH (red) in the A53T midbrain cultures, treated with either DMSO or 10 nm MG132. Scale bar, 10 μm. F, Survival rate (percentage) of TH-positive neurons treated with DMSO or 10 nm MG132. Seven pairs of control and four pairs A53T cultures were analyzed for DMSO or MG132 treatment, respectively. For each culture, 200–500 TH-positive neurons were counted from four independent experiments. Data were presented as mean ± SEM. **p < 0.01. G, Levels of Nurr1 expression in the nucleus of TH-positive neurons in the A53T (n = 145 for DMSO; n = 140 for MG132) and littermate control (n = 117 for DMSO; n = 106 for MG132) cultures treated with either DMSO or MG132. Data were presented as mean ± SEM. *p < 0.05; **p < 0.01; ***p < 0.001.
Inhibition of proteasome-dependent degradation of Nurr1 ameliorated the A53T α-syn-induced loss of mDA neurons
To investigate whether this α-syn-induced and proteasome-dependent degradation of Nurr1 is responsible for the loss of TH-positive neurons, we treated A53T and littermate control midbrain cultures with MG132 or vehicle (DMSO) after 5 d in vitro and counted the numbers of remaining TH-positive neurons 2 d after the treatment. An approximate 40% loss of TH-positive neurons was found in the A53T cultures compared with littermate controls (Fig. 12E,F). The application of MG132 at a 10 nm final concentration did not affect the survival of control TH-positive neurons but significantly increased the survival of TH-positive neurons in A53T cultures (Fig. 12E,F). Moreover, the levels of nuclear Nurr1 staining in TH-positive neurons were also significantly increased in the MG132-treated A53T cultures compared with the vehicle-treated counterparts (Fig. 12E,G). Together, these data demonstrate that the stabilization of Nurr1 protein levels by proteasome inhibition may ameliorate α-syn-induced degeneration of mDA neurons.
Discussion
In this study, we presented a new line of α-syn A53T conditional transgenic mice to specifically investigate the underlying subcellular and molecular pathogenic pathways leading to α-syn-mediated dysfunction and degeneration of mDA neurons. These A53T mice developed profound movement impairments, especially the rearing activities, perhaps reflecting a severe dysfunction of the nigrostriatal dopaminergic system. Indeed, substantial reduction of dopamine release was observed in the dorsal striatum of 1-month-old A53T mice. Moreover, robust and progressive mDA neurodegeneration was apparent in the 6-month-old mutant mice. Perhaps more interestingly, we identified Nurr1 as an important downstream molecular target of α-syn, in which α-syn promoted a proteasome-dependent degradation of Nurr1 protein, resulting in a preferential dysfunction and loss of mDA neurons. Conversely, a modest suppression of proteasome activities in the mDA neurons ameliorated the α-syn-induced Nurr1 degradation and mDA neuronal loss. Together, our studies of this line of α-syn transgenic mice provide important mechanistic insights into the α-syn-mediated preferential degeneration of mDA neurons in PD.
The A53T mice developed substantial loss of mDA neurons in both the SNC and VTA regions, but more neuronal loss was found in the SNC. Interestingly, greater loss of mDA neurons has been also documented in the SNC compared with the VTA in the PD cases (German et al., 1992). The additional neuronal loss in the SNC of A53T mice, however, could be attributed to a relatively higher level of human α-syn expression in the SNC mDA neurons under the PITX3 promoter. But, it may not preclude the involvement of other intrinsic risk factors associated with the SNC DA neurons, which may subject these neurons to more susceptible α-syn-mediated genetic insults. Future studies may need to detail the gene expression alterations in the SNC and VTA DA neurons to identify the potential genetic components attributable to the additional loss of SNC mDA neurons in the A53T mice. In addition to the differential loss of mDA neurons in the SNC and VTA of A53T mice, a biphasic rate of mDA neuronal loss was also observed in these mice. A rapidly progressed loss of mDA neurons was detected in the mutant mice from 1 to 12 months of age, whereas the progression of mDA neurodegeneration was greatly slowed down after 12 months of age. This intriguing finding, however, resembles a previous report from human PD cases, in which an exponential loss of SNC DA neurons is found in the first decade after the onset of disease, followed by a slow and linear rate of neurodegeneration similar to that seen in normal aging (Fearnley and Lees, 1991). However, the underlying molecular mechanism is unclear. This A53T mouse model may be useful to investigate this rather intriguing phenomenon.
Well before the onset of widespread neuronal loss in the A53T mice, a severe depression of dopamine release was found in the dorsal striatum of 1-month-old A53T mice. This drastic decrease of dopamine release may contribute to the severe reduction of rearing activities of 1-month-old A53T mice as demonstrated by previous dopamine depletion experiments, in which the 6-hydroxydopamine-induced DA depletion at dorsolateral striatum results in significantly reduced rearing behavior in rat (Jicha and Salamone, 1991). A similar reduction of dopamine release was also reported recently in the striatum of adult rats transduced with human WT α-syn expressing recombinant viruses (Lundblad et al., 2012). Transmitter release can be regulated by a number of mechanisms along the signaling pathway of synaptic transmission (Sudhof, 2004). The α-syn has been shown to modulate the SNARE-complex assembly in the glutamatergic presynaptic terminals (Burré et al., 2010). Although it is unclear whether the dopaminergic terminals share the same machinery involving in the synaptic vesicle release as the glutamatergic terminals, α-syn may very likely play a dynamic role in regulating the synaptic vesicle release or reuptake at the dopaminergic terminals. In addition, the α-syn-induced substantial reduction of Nurr1-controlled TH, VMAT2, and DAT expression in the A53T mice may further compromise the dopamine release, because these dopaminergic proteins are critical for the synthesis, transport, and reuptake of dopamine in the mDA neurons.
In addition to the impaired neurotransmitter release, previous studies have also revealed many other subcellular abnormalities in cells overexpressing either wild-type or PD-related mutant α-syn (Auluck et al., 2010). Our observations of the alterations of P62, LC3, and LAMP2 expression in the mDA neurons of A53T mice confirm the previous studies about the involvement of α-syn in the autophagy/lysosome-dependent degradation pathways (Cuervo et al., 2004). The presence of A53T α-syn may impair the LAMP2- and chaperon-mediated autophagy pathway that leads to the abnormal accumulation of P62-positive preautophagosomal structures and LC-3-assocated autophagosomes (Cuervo et al., 2004). Meanwhile, a similar disruption of the Golgi network was found in the mDA neurons of A53T mice as reported by the previous studies in yeast, cell lines, and striatal neurons (Gosavi et al., 2002; Cooper et al., 2006; Lin et al., 2009). The α-syn may impair the structure and function of the Golgi apparatus through interruption of vesicle trafficking or microtubule dynamics (Gosavi et al., 2002; Cooper et al., 2006). These common subcellular phenotypes induced by α-syn in both the mDA neurons and other cell types may indicate that the dysfunction of the autophagy/lysosomal-mediated degradation pathway and impairment of ER/Golgi-involved vesicle trafficking perhaps represent the more conserved subcellular targets affected by the overexpression of α-syn.
Overexpression of α-syn also compromises the UPS activities in cell lines and neurons, which leads to the increased accumulation of ubiquitin-positive HMW bands revealed by Western blot analysis (Betarbet et al., 2005; Lin et al., 2009). However, no significant increase of ubiquitin-positive HMW bands were detected in the midbrain homogenate of A53T transgenic mice, suggesting that the UPS activities may not be significantly disturbed in these mDA neurons. This apparent discrepancy from previous findings may be attributed to the unique cellular environment of the mDA neurons or the transgenic α-syn expression level. We previously observed a significant upregulation of ubiquitin-positive HMW products in the brain of the CaMKII series of α-syn inducible transgenic mice (Lin et al., 2009), in which a >30-fold overexpression of transgenic α-syn was detected. Considering that there was only threefold overexpression of α-syn in the mDA neurons of PITX3-A53T mice, it may contribute to a lack of significant ubiquitin phenotype in the mDA neurons. A previous study also reports deficits in the 20S proteasome-mediated proteolytic activity in the frontal cortex, midbrain, and striatum homogenates prepared from a different line of α-syn transgenic mice (Chen et al., 2006). Intriguingly, the levels of ubiquitin-positive HMW products are rather decreased in the mutant mouse brain compared with the controls (Chen et al., 2006). Therefore, we have to be cautious in assessing the UPS activity solely based on the accumulation of ubiquitinated proteins. Meanwhile, to precisely evaluate the pathogenic function of α-syn on the UPS activity, it remains critical to determine the exact molecular interaction between α-syn and UPS components (Ciechanover and Brundin, 2003).
Similarly, no apparent abnormality of mitochondrial morphology was observed in the mDA neurons of A53T mice (data not shown). The α-syn-induced alteration of mitochondrial morphology and functions have been widely reported in various cells, including neurons in the midbrain (Hsu et al., 2000; Martin et al., 2006; Lin et al., 2009; Nakamura et al., 2011). We speculate that the distinct cellular environments of mDA neurons or the transgenic α-syn expression level may contribute to the lack of significant mitochondrial morphological phenotypes in this line of A53T mice. In addition, it will be interesting to determine whether overexpression of α-syn affects the mitochondrial activities in the mDA neurons.
A contribution of Nurr1 dysfunction in PD has been proposed previously (Chu et al., 2002; Baptista et al., 2003; Le et al., 2003). We extended these previous studies and demonstrated that overexpression of both wild-type and A53T α-syn promoted a proteasome-dependent degradation of Nurr1. We also demonstrated that inhibition of proteasome-mediated degradation of Nurr1 ameliorated α-syn-induced loss of mDA neurons. These data suggest that the suppression of Nurr1 protein expression by α-syn is a key molecular determinant for the preferential dysfunction and loss of mDA neurons in PD. In line with this notion, a conditional deletion of Nurr1 in the mDA neurons results in very similar rearing impairments and mDA neurodegeneration compared with the A53T conditional transgenic mice (Kadkhodaei et al., 2009). Multiple posttranslational modifications have been found to modulate the stability and function of Nurr1 protein, including phosphorylation, ubiquitination (Jo et al., 2009), sumoylation (Galleguillos et al., 2004), and acetylation (Kang et al., 2010). The α-syn may regulate the degradation of Nurr1 protein through various molecular cascades. In addition, it remains to be determined whether other PD-related genes also affect the expression and stability of Nurr1 protein in PD.
In summary, this study describes a new line of α-syn A53T transgenic mice that display robust and progressive degeneration of mDA neurons. The dynamic regulation of Nurr1 protein stability by α-syn in the mDA neurons may not only help to address the molecular mechanism of the preferential susceptibility of mDA neurons in PD, but may also provide new therapeutic targets for the treatment of the disease.
Footnotes
This work was supported in part by the intramural research programs of the National Institutes of Health (NIH)–National Institute on Aging (Grants AG000959-07 and AG000945-03 to H.C.), NIH–National Institute on Alcohol Abuse and Alcoholism (D.L.), and NIH–National Institute of Neurological Disorders and Stroke (D.S.G., L.-G.W.) and by the National Natural Science Foundation of China (J.L., Project 81072648). We thank the National Human Genome Research Institute and NIMH transgenic mouse facilities for blastocyst and pronuclear injections; Drs. Jaime Rodriguez-Canales and Jeffrey Hanson of the National Cancer Institute Laser Capture Microdissection Core Facility for help in laser capture microdissection; Dr. Mark Cookson for providing the α-syn plasmids; Dr. Andrew Singleton and members of Laboratory of Neurogenetics for the helpful suggestions; and the NIH Fellows Editorial Board for editing this manuscript.
The authors declare no competing financial interests.
References
- Auluck PK, Caraveo G, Lindquist S. Alpha-synuclein: membrane interactions and toxicity in Parkinson's disease. Annu Rev Cell Dev Biol. 2010;26:211–233. doi: 10.1146/annurev.cellbio.042308.113313. [DOI] [PubMed] [Google Scholar]
- Baptista MJ, O'Farrell C, Daya S, Ahmad R, Miller DW, Hardy J, Farrer MJ, Cookson MR. Co-ordinate transcriptional regulation of dopamine synthesis genes by alpha-synuclein in human neuroblastoma cell lines. J Neurochem. 2003;85:957–968. doi: 10.1046/j.1471-4159.2003.01742.x. [DOI] [PubMed] [Google Scholar]
- Betarbet R, Sherer TB, Greenamyre JT. Ubiquitin-proteasome system and Parkinson's diseases. Exp Neurol. 2005;191(Suppl 1):S17–S27. doi: 10.1016/j.expneurol.2004.08.021. [DOI] [PubMed] [Google Scholar]
- Bjørkøy G, Lamark T, Brech A, Outzen H, Perander M, Overvatn A, Stenmark H, Johansen T. p62/SQSTM1 forms protein aggregates degraded by autophagy and has a protective effect on huntingtin-induced cell death. J Cell Biol. 2005;171:603–614. doi: 10.1083/jcb.200507002. [DOI] [PMC free article] [PubMed] [Google Scholar]
- Burré J, Sharma M, Tsetsenis T, Buchman V, Etherton MR, Südhof TC. Alpha-synuclein promotes SNARE-complex assembly in vivo and in vitro. Science. 2010;329:1663–1667. doi: 10.1126/science.1195227. [DOI] [PMC free article] [PubMed] [Google Scholar]
- Cahill PS, Walker QD, Finnegan JM, Mickelson GE, Travis ER, Wightman RM. Microelectrodes for the measurement of catecholamines in biological systems. Anal Chem. 1996;68:3180–3186. doi: 10.1021/ac960347d. [DOI] [PubMed] [Google Scholar]
- Cai H, Lin X, Xie C, Laird FM, Lai C, Wen H, Chiang HC, Shim H, Farah MH, Hoke A, Price DL, Wong PC. Loss of ALS2 function is insufficient to trigger motor neuron degeneration in knock-out mice but predisposes neurons to oxidative stress. J Neurosci. 2005;25:7567–7574. doi: 10.1523/JNEUROSCI.1645-05.2005. [DOI] [PMC free article] [PubMed] [Google Scholar]
- Chandran JS, Lin X, Zapata A, Höke A, Shimoji M, Moore SO, Galloway MP, Laird FM, Wong PC, Price DL, Bailey KR, Crawley JN, Shippenberg T, Cai H. Progressive behavioral deficits in DJ-1-deficient mice are associated with normal nigrostriatal function. Neurobiol Dis. 2007;29:505–514. doi: 10.1016/j.nbd.2007.11.011. [DOI] [PMC free article] [PubMed] [Google Scholar]
- Chefer VI, Zapata A, Shippenberg TS, Bungay PM. Quantitative no-net-flux microdialysis permits detection of increases and decreases in dopamine uptake in mouse nucleus accumbens. J Neurosci Methods. 2006;155:187–193. doi: 10.1016/j.jneumeth.2005.12.018. [DOI] [PubMed] [Google Scholar]
- Chen L, Thiruchelvam MJ, Madura K, Richfield EK. Proteasome dysfunction in aged human alpha-synuclein transgenic mice. Neurobiol Dis. 2006;23:120–126. doi: 10.1016/j.nbd.2006.02.004. [DOI] [PubMed] [Google Scholar]
- Chesselet MF. In vivo alpha-synuclein overexpression in rodents: a useful model of Parkinson's disease? Exp Neurol. 2008;209:22–27. doi: 10.1016/j.expneurol.2007.08.006. [DOI] [PMC free article] [PubMed] [Google Scholar]
- Chu Y, Kompoliti K, Cochran EJ, Mufson EJ, Kordower JH. Age-related decreases in Nurr1 immunoreactivity in the human substantia nigra. J Comp Neurol. 2002;450:203–214. doi: 10.1002/cne.10261. [DOI] [PubMed] [Google Scholar]
- Chu Y, Le W, Kompoliti K, Jankovic J, Mufson EJ, Kordower JH. Nurr1 in Parkinson's disease and related disorders. J Comp Neurol. 2006;494:495–514. doi: 10.1002/cne.20828. [DOI] [PMC free article] [PubMed] [Google Scholar]
- Ciechanover A, Brundin P. The ubiquitin proteasome system in neurodegenerative diseases: sometimes the chicken, sometimes the egg. Neuron. 2003;40:427–446. doi: 10.1016/s0896-6273(03)00606-8. [DOI] [PubMed] [Google Scholar]
- Clayton DF, George JM. Synucleins in synaptic plasticity and neurodegenerative disorders. J Neurosci Res. 1999;58:120–129. [PubMed] [Google Scholar]
- Cooper AA, Gitler AD, Cashikar A, Haynes CM, Hill KJ, Bhullar B, Liu K, Xu K, Strathearn KE, Liu F, Cao S, Caldwell KA, Caldwell GA, Marsischky G, Kolodner RD, Labaer J, Rochet JC, Bonini NM, Lindquist S. Alpha-synuclein blocks ER-Golgi traffic and Rab1 rescues neuron loss in Parkinson's models. Science. 2006;313:324–328. doi: 10.1126/science.1129462. [DOI] [PMC free article] [PubMed] [Google Scholar]
- Cuervo AM, Dice JF. Regulation of lamp2a levels in the lysosomal membrane. Traffic. 2000;1:570–583. doi: 10.1034/j.1600-0854.2000.010707.x. [DOI] [PubMed] [Google Scholar]
- Cuervo AM, Stefanis L, Fredenburg R, Lansbury PT, Sulzer D. Impaired degradation of mutant alpha-synuclein by chaperone-mediated autophagy. Science. 2004;305:1292–1295. doi: 10.1126/science.1101738. [DOI] [PubMed] [Google Scholar]
- Fearnley JM, Lees AJ. Ageing and Parkinson's disease: substantia nigra regional selectivity. Brain. 1991;114:2283–2301. doi: 10.1093/brain/114.5.2283. [DOI] [PubMed] [Google Scholar]
- Galleguillos D, Vecchiola A, Fuentealba JA, Ojeda V, Alvarez K, Gómez A, Andres ME. PIASgamma represses the transcriptional activation induced by the nuclear receptor Nurr1. J Biol Chem. 2004;279:2005–2011. doi: 10.1074/jbc.M308113200. [DOI] [PubMed] [Google Scholar]
- German DC, Manaye KF, Sonsalla PK, Brooks BA. Midbrain dopaminergic cell loss in Parkinson's disease and MPTP-induced parkinsonism: sparing of calbindin-D28k-containing cells. Ann N Y Acad Sci. 1992;648:42–62. doi: 10.1111/j.1749-6632.1992.tb24523.x. [DOI] [PubMed] [Google Scholar]
- Gispert S, Del Turco D, Garrett L, Chen A, Bernard DJ, Hamm-Clement J, Korf HW, Deller T, Braak H, Auburger G, Nussbaum RL. Transgenic mice expressing mutant A53T human alpha-synuclein show neuronal dysfunction in the absence of aggregate formation. Mol Cell Neurosci. 2003;24:419–429. doi: 10.1016/s1044-7431(03)00198-2. [DOI] [PubMed] [Google Scholar]
- Gosavi N, Lee HJ, Lee JS, Patel S, Lee SJ. Golgi fragmentation occurs in the cells with prefibrillar alpha-synuclein aggregates and precedes the formation of fibrillar inclusion. J Biol Chem. 2002;277:48984–48992. doi: 10.1074/jbc.M208194200. [DOI] [PubMed] [Google Scholar]
- Gu XL, Long CX, Sun L, Xie C, Lin X, Cai H. Astrocytic expression of Parkinson's disease-related A53T alpha-synuclein causes neurodegeneration in mice. Mol Brain. 2010;3:12. doi: 10.1186/1756-6606-3-12. [DOI] [PMC free article] [PubMed] [Google Scholar]
- Harvey BK, Wang Y, Hoffer BJ. Transgenic rodent models of Parkinson's disease. Acta Neurochir Suppl. 2008;101:89–92. doi: 10.1007/978-3-211-78205-7_15. [DOI] [PMC free article] [PubMed] [Google Scholar]
- Hisahara S, Shimohama S. Toxin-induced and genetic animal models of Parkinson's disease. Parkinsons Dis. 2010;2011:951709–951723. doi: 10.4061/2011/951709. [DOI] [PMC free article] [PubMed] [Google Scholar]
- Holmes C, Eisenhofer G, Goldstein DS. Improved assay for plasma dihydroxyphenylacetic acid and other catechols using high-performance liquid chromatography with electrochemical detection. J Chromatogr B Biomed Appl. 1994;653:131–138. doi: 10.1016/0378-4347(93)e0430-x. [DOI] [PubMed] [Google Scholar]
- Hsu LJ, Sagara Y, Arroyo A, Rockenstein E, Sisk A, Mallory M, Wong J, Takenouchi T, Hashimoto M, Masliah E. Alpha-synuclein promotes mitochondrial deficit and oxidative stress. Am J Pathol. 2000;157:401–410. doi: 10.1016/s0002-9440(10)64553-1. [DOI] [PMC free article] [PubMed] [Google Scholar]
- Jicha GA, Salamone JD. Vacuous jaw movements and feeding deficits in rats with ventrolateral striatal dopamine depletion: possible relation to parkinsonian symptoms. J Neurosci. 1991;11:3822–3829. doi: 10.1523/JNEUROSCI.11-12-03822.1991. [DOI] [PMC free article] [PubMed] [Google Scholar]
- Jo AY, Kim MY, Lee HS, Rhee YH, Lee JE, Baek KH, Park CH, Koh HC, Shin I, Lee YS, Lee SH. Generation of dopamine neurons with improved cell survival and phenotype maintenance using a degradation-resistant nurr1 mutant. Stem Cells. 2009;27:2238–2246. doi: 10.1002/stem.146. [DOI] [PMC free article] [PubMed] [Google Scholar]
- Kabeya Y, Mizushima N, Ueno T, Yamamoto A, Kirisako T, Noda T, Kominami E, Ohsumi Y, Yoshimori T. LC3, a mammalian homologue of yeast Apg8p, is localized in autophagosome membranes after processing. EMBO J. 2000;19:5720–5728. doi: 10.1093/emboj/19.21.5720. [DOI] [PMC free article] [PubMed] [Google Scholar]
- Kadkhodaei B, Ito T, Joodmardi E, Mattsson B, Rouillard C, Carta M, Muramatsu S, Sumi-Ichinose C, Nomura T, Metzger D, Chambon P, Lindqvist E, Larsson NG, Olson L, Björklund A, Ichinose H, Perlmann T. Nurr1 is required for maintenance of maturing and adult midbrain dopamine neurons. J Neurosci. 2009;29:15923–15932. doi: 10.1523/JNEUROSCI.3910-09.2009. [DOI] [PMC free article] [PubMed] [Google Scholar]
- Kahle PJ, Neumann M, Ozmen L, Müller V, Odoy S, Okamoto N, Jacobsen H, Iwatsubo T, Trojanowski JQ, Takahashi H, Wakabayashi K, Bogdanovic N, Riederer P, Kretzschmar HA, Haass C. Selective insolubility of alpha-synuclein in human Lewy body diseases is recapitulated in a transgenic mouse model. Am J Pathol. 2001;159:2215–2225. doi: 10.1016/s0002-9440(10)63072-6. [DOI] [PMC free article] [PubMed] [Google Scholar]
- Kang SA, Na H, Kang HJ, Kim SH, Lee MH, Lee MO. Regulation of Nur77 protein turnover through acetylation and deacetylation induced by p300 and HDAC1. Biochem Pharmacol. 2010;80:867–873. doi: 10.1016/j.bcp.2010.04.026. [DOI] [PubMed] [Google Scholar]
- Kistner A, Gossen M, Zimmermann F, Jerecic J, Ullmer C, Lübbert H, Bujard H. Doxycycline-mediated quantitative and tissue-specific control of gene expression in transgenic mice. Proc Natl Acad Sci U S A. 1996;93:10933–10938. doi: 10.1073/pnas.93.20.10933. [DOI] [PMC free article] [PubMed] [Google Scholar]
- Lai C, Lin X, Chandran J, Shim H, Yang WJ, Cai H. The G59S mutation in p150(glued) causes dysfunction of dynactin in mice. J Neurosci. 2007;27:13982–13990. doi: 10.1523/JNEUROSCI.4226-07.2007. [DOI] [PMC free article] [PubMed] [Google Scholar]
- Lakso M, Pichel JG, Gorman JR, Sauer B, Okamoto Y, Lee E, Alt FW, Westphal H. Efficient in vivo manipulation of mouse genomic sequences at the zygote stage. Proc Natl Acad Sci U S A. 1996;93:5860–5865. doi: 10.1073/pnas.93.12.5860. [DOI] [PMC free article] [PubMed] [Google Scholar]
- Le WD, Xu P, Jankovic J, Jiang H, Appel SH, Smith RG, Vassilatis DK. Mutations in NR4A2 associated with familial Parkinson disease. Nat Genet. 2003;33:85–89. doi: 10.1038/ng1066. [DOI] [PubMed] [Google Scholar]
- Lee MK, Stirling W, Xu Y, Xu X, Qui D, Mandir AS, Dawson TM, Copeland NG, Jenkins NA, Price DL. Human alpha-synuclein-harboring familial Parkinson's disease-linked Ala-53→Thr mutation causes neurodegenerative disease with alpha-synuclein aggregation in transgenic mice. Proc Natl Acad Sci U S A. 2002;99:8968–8973. doi: 10.1073/pnas.132197599. [DOI] [PMC free article] [PubMed] [Google Scholar]
- Lin X, Parisiadou L, Gu XL, Wang L, Shim H, Sun L, Xie C, Long CX, Yang WJ, Ding J, Chen ZZ, Gallant PE, Tao-Cheng JH, Rudow G, Troncoso JC, Liu Z, Li Z, Cai H. Leucine-rich repeat kinase 2 regulates the progression of neuropathology induced by Parkinson's-disease-related mutant alpha-synuclein. Neuron. 2009;64:807–827. doi: 10.1016/j.neuron.2009.11.006. [DOI] [PMC free article] [PubMed] [Google Scholar]
- Lundblad M, Decressac M, Mattsson B, Björklund A. Impaired neurotransmission caused by overexpression of alpha-synuclein in nigral dopamine neurons. Proc Natl Acad Sci U S A. 2012;109:3213–3219. doi: 10.1073/pnas.1200575109. [DOI] [PMC free article] [PubMed] [Google Scholar]
- Maroteaux L, Campanelli JT, Scheller RH. Synuclein: a neuron-specific protein localized to the nucleus and presynaptic nerve terminal. J Neurosci. 1988;8:2804–2815. doi: 10.1523/JNEUROSCI.08-08-02804.1988. [DOI] [PMC free article] [PubMed] [Google Scholar]
- Martin LJ, Pan Y, Price AC, Sterling W, Copeland NG, Jenkins NA, Price DL, Lee MK. Parkinson's disease alpha-synuclein transgenic mice develop neuronal mitochondrial degeneration and cell death. J Neurosci. 2006;26:41–50. doi: 10.1523/JNEUROSCI.4308-05.2006. [DOI] [PMC free article] [PubMed] [Google Scholar]
- Mateo Y, Lack CM, Morgan D, Roberts DC, Jones SR. Reduced dopamine terminal function and insensitivity to cocaine following cocaine binge self-administration and deprivation. Neuropsychopharmacology. 2005;30:1455–1463. doi: 10.1038/sj.npp.1300687. [DOI] [PubMed] [Google Scholar]
- Matsuoka Y, Vila M, Lincoln S, McCormack A, Picciano M, LaFrancois J, Yu X, Dickson D, Langston WJ, McGowan E, Farrer M, Hardy J, Duff K, Przedborski S, Di Monte DA. Lack of nigral pathology in transgenic mice expressing human alpha-synuclein driven by the tyrosine hydroxylase promoter. Neurobiol Dis. 2001;8:535–539. doi: 10.1006/nbdi.2001.0392. [DOI] [PubMed] [Google Scholar]
- Mombaerts P, Wang F, Dulac C, Chao SK, Nemes A, Mendelsohn M, Edmondson J, Axel R. Visualizing an olfactory sensory map. Cell. 1996;87:675–686. doi: 10.1016/s0092-8674(00)81387-2. [DOI] [PubMed] [Google Scholar]
- Nakamura K, Nemani VM, Azarbal F, Skibinski G, Levy JM, Egami K, Munishkina L, Zhang J, Gardner B, Wakabayashi J, Sesaki H, Cheng Y, Finkbeiner S, Nussbaum RL, Masliah E, Edwards RH. Direct membrane association drives mitochondrial fission by the Parkinson disease-associated protein alpha-synuclein. J Biol Chem. 2011;286:20710–20726. doi: 10.1074/jbc.M110.213538. [DOI] [PMC free article] [PubMed] [Google Scholar]
- Nemani VM, Lu W, Berge V, Nakamura K, Onoa B, Lee MK, Chaudhry FA, Nicoll RA, Edwards RH. Increased expression of alpha-synuclein reduces neurotransmitter release by inhibiting synaptic vesicle reclustering after endocytosis. Neuron. 2010;65:66–79. doi: 10.1016/j.neuron.2009.12.023. [DOI] [PMC free article] [PubMed] [Google Scholar]
- Perlmann T, Wallén-Mackenzie A. Nurr1, an orphan nuclear receptor with essential functions in developing dopamine cells. Cell Tissue Res. 2004;318:45–52. doi: 10.1007/s00441-004-0974-7. [DOI] [PubMed] [Google Scholar]
- Polymeropoulos MH, Lavedan C, Leroy E, Ide SE, Dehejia A, Dutra A, Pike B, Root H, Rubenstein J, Boyer R, Stenroos ES, Chandrasekharappa S, Athanassiadou A, Papapetropoulos T, Johnson WG, Lazzarini AM, Duvoisin RC, Di Iorio G, Golbe LI, Nussbaum RL. Mutation in the alpha-synuclein gene identified in families with Parkinson's disease. Science. 1997;276:2045–2047. doi: 10.1126/science.276.5321.2045. [DOI] [PubMed] [Google Scholar]
- Richfield EK, Thiruchelvam MJ, Cory-Slechta DA, Wuertzer C, Gainetdinov RR, Caron MG, Di Monte DA, Federoff HJ. Behavioral and neurochemical effects of wild-type and mutated human alpha-synuclein in transgenic mice. Exp Neurol. 2002;175:35–48. doi: 10.1006/exnr.2002.7882. [DOI] [PubMed] [Google Scholar]
- Rockenstein E, Schwach G, Ingolic E, Adame A, Crews L, Mante M, Pfragner R, Schreiner E, Windisch M, Masliah E. Lysosomal pathology associated with alpha-synuclein accumulation in transgenic models using an eGFP fusion protein. J Neurosci Res. 2005;80:247–259. doi: 10.1002/jnr.20446. [DOI] [PubMed] [Google Scholar]
- Satake W, Nakabayashi Y, Mizuta I, Hirota Y, Ito C, Kubo M, Kawaguchi T, Tsunoda T, Watanabe M, Takeda A, Tomiyama H, Nakashima K, Hasegawa K, Obata F, Yoshikawa T, Kawakami H, Sakoda S, Yamamoto M, Hattori N, Murata M, et al. Genome-wide association study identifies common variants at four loci as genetic risk factors for Parkinson's disease. Nat Genet. 2009;41:1303–1307. doi: 10.1038/ng.485. [DOI] [PubMed] [Google Scholar]
- Schapira AH. Pathogenesis of Parkinson's disease. Baillieres Clin Neurol. 1997;6:15–36. [PubMed] [Google Scholar]
- Simón-Sánchez J, Schulte C, Bras JM, Sharma M, Gibbs JR, Berg D, Paisan-Ruiz C, Lichtner P, Scholz SW, Hernandez DG, Krüger R, Federoff M, Klein C, Goate A, Perlmutter J, Bonin M, Nalls MA, Illig T, Gieger C, Houlden H, et al. Genome-wide association study reveals genetic risk underlying Parkinson's disease. Nat Genet. 2009;41:1308–1312. doi: 10.1038/ng.487. [DOI] [PMC free article] [PubMed] [Google Scholar]
- Singleton AB, Farrer M, Johnson J, Singleton A, Hague S, Kachergus J, Hulihan M, Peuralinna T, Dutra A, Nussbaum R, Lincoln S, Crawley A, Hanson M, Maraganore D, Adler C, Cookson MR, Muenter M, Baptista M, Miller D, Blancato J, et al. Alpha-synuclein locus triplication causes Parkinson's disease. Science. 2003;302:841. doi: 10.1126/science.1090278. [DOI] [PubMed] [Google Scholar]
- Smidt MP, Smits SM, Burbach JP. Homeobox gene Pitx3 and its role in the development of dopamine neurons of the substantia nigra. Cell Tissue Res. 2004;318:35–43. doi: 10.1007/s00441-004-0943-1. [DOI] [PubMed] [Google Scholar]
- Smits SM, Smidt MP. The role of Pitx3 in survival of midbrain dopaminergic neurons. J Neural Transm Suppl. 2006;70:57–60. doi: 10.1007/978-3-211-45295-0_10. [DOI] [PubMed] [Google Scholar]
- Song DD, Shults CW, Sisk A, Rockenstein E, Masliah E. Enhanced substantia nigra mitochondrial pathology in human alpha-synuclein transgenic mice after treatment with MPTP. Exp Neurol. 2004;186:158–172. doi: 10.1016/S0014-4886(03)00342-X. [DOI] [PubMed] [Google Scholar]
- Spillantini MG, Schmidt ML, Lee VM, Trojanowski JQ, Jakes R, Goedert M. Alpha-synuclein in Lewy bodies. Nature. 1997;388:839–840. doi: 10.1038/42166. [DOI] [PubMed] [Google Scholar]
- Stefanis L, Larsen KE, Rideout HJ, Sulzer D, Greene LA. Expression of A53T mutant but not wild-type alpha-synuclein in PC12 cells induces alterations of the ubiquitin-dependent degradation system, loss of dopamine release, and autophagic cell death. J Neurosci. 2001;21:9549–9560. doi: 10.1523/JNEUROSCI.21-24-09549.2001. [DOI] [PMC free article] [PubMed] [Google Scholar]
- Sudhof TC. The synaptic vesicle cycle. Annu Rev Neurosci. 2004;27:509–547. doi: 10.1146/annurev.neuro.26.041002.131412. [DOI] [PubMed] [Google Scholar]
- Tanaka Y, Engelender S, Igarashi S, Rao RK, Wanner T, Tanzi RE, Sawa A, Dawson L, Dawson TM, Ross CA. Inducible expression of mutant alpha-synuclein decreases proteasome activity and increases sensitivity to mitochondria-dependent apoptosis. Hum Mol Genet. 2001;10:919–926. doi: 10.1093/hmg/10.9.919. [DOI] [PubMed] [Google Scholar]
- Thiruchelvam MJ, Powers JM, Cory-Slechta DA, Richfield EK. Risk factors for dopaminergic neuron loss in human alpha-synuclein transgenic mice. Eur J Neurosci. 2004;19:845–854. doi: 10.1111/j.0953-816x.2004.03139.x. [DOI] [PubMed] [Google Scholar]
- van der Putten H, Wiederhold KH, Probst A, Barbieri S, Mistl C, Danner S, Kauffmann S, Hofele K, Spooren WP, Ruegg MA, Lin S, Caroni P, Sommer B, Tolnay M, Bilbe G. Neuropathology in mice expressing human alpha-synuclein. J Neurosci. 2000;20:6021–6029. doi: 10.1523/JNEUROSCI.20-16-06021.2000. [DOI] [PMC free article] [PubMed] [Google Scholar]
- Wakamatsu M, Ishii A, Iwata S, Sakagami J, Ukai Y, Ono M, Kanbe D, Muramatsu S, Kobayashi K, Iwatsubo T, Yoshimoto M. Selective loss of nigral dopamine neurons induced by overexpression of truncated human alpha-synuclein in mice. Neurobiol Aging. 2008;29:574–585. doi: 10.1016/j.neurobiolaging.2006.11.017. [DOI] [PubMed] [Google Scholar]
- Yorgason JT, España RA, Jones SR. Demon voltammetry and analysis software: analysis of cocaine-induced alterations in dopamine signaling using multiple kinetic measures. J Neurosci Methods. 2011;202:158–164. doi: 10.1016/j.jneumeth.2011.03.001. [DOI] [PMC free article] [PubMed] [Google Scholar]
- Zhong SC, Luo X, Chen XS, Cai QY, Liu J, Chen XH, Yao ZX. Expression and subcellular location of alpha-synuclein during mouse-embryonic development. Cell Mol Neurobiol. 2010;30:469–482. doi: 10.1007/s10571-009-9473-4. [DOI] [PubMed] [Google Scholar]