Abstract
The local delivery of extracellular high frequency stimulation (HFS) has been shown to be a fast acting and quickly reversible method of blocking neural conduction, and is currently being pursued for several clinical indications. However, the mechanism for this type of nerve block remains unclear. In this study, we investigate two hypotheses: 1) That depolarizing currents promote conduction block via inactivation of sodium channels, and 2) that the gating dynamics of the fast sodium channel are the primary determinate of minimal blocking frequency. Hypothesis 1 was investigated using a combined modeling and experimental study to investigate the effect of depolarizing and hyperpolarizing currents on high frequency block. The results of the modeling study show that both depolarizing and hyperpolarizing currents play an important role in conduction block and that the conductance to each of three ionic currents increases relative to resting values during HFS. However, depolarizing currents were found to promote the blocking effect, and hyperpolarizing currents were found to diminish the blocking effect. Inward sodium currents were larger than the sum of the outward currents, resulting in a net depolarization of the nodal membrane. Our experimental results support these findings and closely match results from the equivalent modeling scenario: intra-peritoneal administration of the persistent sodium channel blocker ranolazine resulted in an increase in the amplitude of HFS required to produce conduction block in rats, confirming that depolarizing currents promote the conduction block phenomenon. Hypothesis 2 was investigated using a spectral analysis of the channel gating variables in a single fiber axon model. The results of this study suggested a relationship between the dynamical properties of specific ion channel gating elements and the contributions of corresponding conductances to block onset. Specifically, we show that the dynamics of the fast sodium inactivation gate are too slow to track the high frequency changes in membrane potential during HFS, and that the behavior of the fast sodium current was dominated by the low frequency depolarization of the membrane. As a result, in the blocked state, only 5.4% of nodal sodium channels were found to be in the activatable state in the node closest to the blocking electrode, resulting in a conduction block. Moreover, we find that the corner frequency for the persistent sodium channel activation gate corresponds to the frequency below which high frequency stimuli of arbitrary amplitude are incapable of inducing conduction block.
Keywords: Nerve conduction block, sensitivity analysis, spectral analysis, high frequency, computational model, ranolazine
INTRODUCTION
The local delivery of high frequency alternating currents has been shown to be a fast acting (≤ 100 msec) and quickly reversible (≤ 1 sec) method of blocking neural conduction [1, 2]. High frequency block of nerve conduction (HFB) may provide a treatment alternative for diseases and disorders which are characterized by pathological or undesired neural activity such as neuropathic pain and spasticity [1]. However, the mechanism for this type of nerve block remains unclear.
Bugnard and Hill published the first study of axonal response to high frequency currents and demonstrated a diminished nerve response at frequencies greater than 600 Hz in the frog sciatic nerve [3]. Inspired by this study, Cattell and Gerard [4] performed compound nerve recordings in a similar preparation to determine whether higher frequencies resulted in a local suppression of excitability, or if Hill and his colleagues’ findings were the result of a distal Wedensky depletion of neurotransmitter at the axon terminals [5]. Cattell and Gerard were the first to conclude that at stimulation frequencies of 2,500 Hz and greater the nerve becomes “less irritable and conductive” in the region local to the electrode [4].
The effects of high frequency stimulation (HFS) on peripheral nerves has remained the subject of experimental interest since these pioneering studies. The gross effect of HFS on peripheral nerve activation has been studied extensively in single fiber preparations [6–8] and in whole nerve preparations [1, 4, 9–23]. Axonal membrane dynamics during HFS have been investigated through computer simulation [1, 12, 21, 24–31] and in an intranodal recording study in the frog motor axon by Bromm [32]. The use of HFS to induce a nerve conduction block has recently begun progressing directly towards clinical therapies including neural stimulators for pain relief (Neuros Medical, Inc., Cleveland, OH, USA), treatment of clinical obesity [33] and for neurogenic bladder voiding [20, 34].
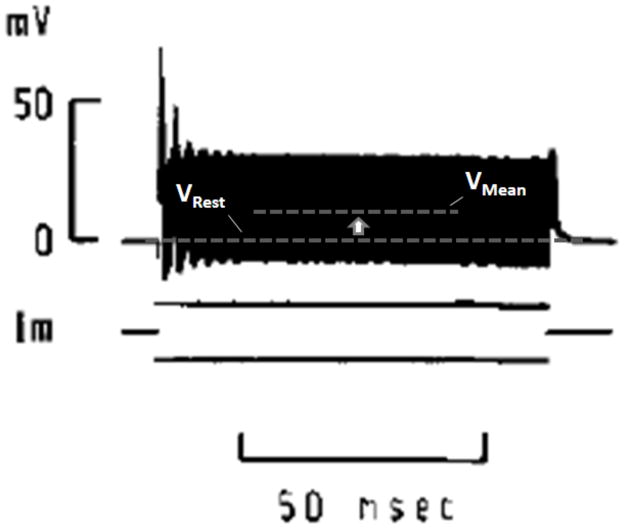
However, despite the long history of HFS investigation, the biophysical mechanism for HFS-induced conduction block remains unclear. Several biophysical explanations for HFB have been proposed in the literature (see Table 1). There are two modern hypotheses. Several recent simulation studies have noted a correlation between sodium channel inactivation and HFB, hypothesizing that the likely mechanism for conduction block is a sodium channel inactivation induced by membrane depolarization [1, 21, 25, 35]. A nodal recording study in the frog by Bromm describes axonal depolarization during HFS, supporting this hypothesis, although he did not explicitly address the mechanisms of the conduction blocking phenomenon (see Figure 1, reprint from Bromm 1975) [32]. Alternatively, several recent publications point to elevation of a potassium current during block conditions as the biophysical explanation for block [24, 26–30]. These studies cite a correlation between potassium channel activation and the HFB phenomenon. Based on this observation the authors of these studies have suggested that elevated potassium currents may overwhelm the inward sodium current caused by an action potential and cause a failure of action potentials to conduct.
Table 1.
Summary of each of five proposed biophysical explanations for HFS-induced conduction block, the study authors and the nature of the authors’ explanation.
| Explanation | Investigator | Nature of Explanation |
|---|---|---|
| Reacting Chemical Species | Cattell and Gerard 1935 [3] | Hypothetical surmise (several possibilities considered) |
| Extracellular Cation Accumulation | Cattell and Gerard 1935 [3] | Hypothetical surmise (several possibilities considered) |
| Intracellular Cation Accumulation | Bowman 1981 [7] | Calculated estimate of Nernst potential changes with accumulation. |
| Depolarization-induced sodium channel inactivation | Kilgore and Bhadra 2004 [1] Williamson and Andrews 2005 [10] Bhadra, et. al 2007 [19] ElBasiouny and Mushahwar 2007 [31] |
Computer simulation of HFS shows membrane depolarization and inactivation of sodium channels are both correlated with conduction block. |
| Outward potassium current overwhelming inward action potential currents | Tai, et. al 2005a [18] Tai, et. al 2005b [24] Xu, et. al 2006a [20] Xu, et. al 2006b [23] Wang, et. al. 2008 [21] Hailong, et. al. 2009 [22] |
Computer simulation of HFS shows increased potassium channel activation is correlated with conduction block |
Figure 1.
Figure from a 1975 study by Bromm showing an intracellular recording of a frog node of Ranvier in response to 10 kHz intracellular stimulation (reprinted with permission [32]). Note the elevation of mean membrane potential above the resting potential. The intracellular current stimulation had zero DC component. High frequency fluctuations appear as a solid bar due to temporal resolution.
In this study, we investigated two hypotheses: 1) Depolarizing currents promote conduction block via inactivation of sodium channels, and 2) Gating dynamics of the fast sodium channel are the primary determinate of minimum blocking frequency. We investigated the first hypothesis in simulation and experimentally. In simulation, we utilize a sensitivity analysis of nodal current conductances to quantify the roles of different currents on the blocking phenomenon. As an experimental complement to the sensitivity analysis, we used the persistent sodium channel blocker ranolazine in a rat sciatic nerve preparation, and compared the resulting changes in HFB thresholds with threshold changes in model simulations mimicking the presence of ranolazine. Ranolazine (Ranexa, CV Therapeutics, Palo Alto, CA) is a recently available pharmacological agent which is prescribed clinically for the treatment of angina [36], and has been under investigation for its potential to treat chronic inflammatory pain [37]. The molecule is a selective blocker for persistent (aka late; sustained) sodium currents in mammalian neuronal and cardiac tissue [38–40].
To investigate the second hypothesis, we performed a spectral analysis of the ability of distinct gating variables to follow a rapidly varying imposed voltage signal. Historically, discussions of the neuron as a band-pass filter have played a dominant role in neuroscience (see for example[41–43]); high frequency transmembrane currents are damped at frequencies above the RC cutoff associated with (passive) cell membrane properties. Less common is the recognition that the ion channels themselves contribute band pass characteristics to membrane behavior. In a standard conductance based model for transmembrane current (detailed under Methods) the fraction x(t) of an ion channel gating component in the conductive state obeys dx/dt=α(1−x)−βx, which is an inhomogeneous linear differential equation with variable coefficients (since α and β depend on the time dependent voltage). An applied sinusoidal voltage of a given mean, frequency and amplitude will induce a larger or smaller fluctuation in the gating variable x depending on the bandpass characteristic of the corresponding ion channel component. At very high frequencies, some channel components will become insensitive to voltage fluctuations before others. As shown below, the corner frequency of a Bode plot for different gating variables may shed some light on the contributions of different membrane currents to the onset of block as a function of frequency. As an additional test of the second hypothesis, we varied the time constants of each current’s gating dynamics and tested which variations had an effect on the minimum frequency at which HFB could be achieved. These tools provided additional insight into the blocking phenomenon in this study, and may aid in further assessment of block mechanisms in future studies.
METHODS
Double-Cable Myelinated Axon Model (McIntyre-Richardson-Grill (MRG) Model)
All simulations were performed in the Neuron simulation environment [44, 45]. Single fiber axons were simulated using the MRG double-cable myelinated fiber model [46]. This model is widely used for simulation studies of the effect of extracellular fields on mammalian axons. Most published work on HFB has been in myelinated mammalian preparations. We used the MRG model in this study to allow for comparison to these prior studies and to allow for direct comparison to other studies which have investigated HFB mechanisms using this model [12, 25]. HFB has also been observed in an unmyelinated preparation [16]. The dynamics of this fiber type during HFS could be investigated using an unmyelinated model (e.g. Hodgkin-Huxley [44]).
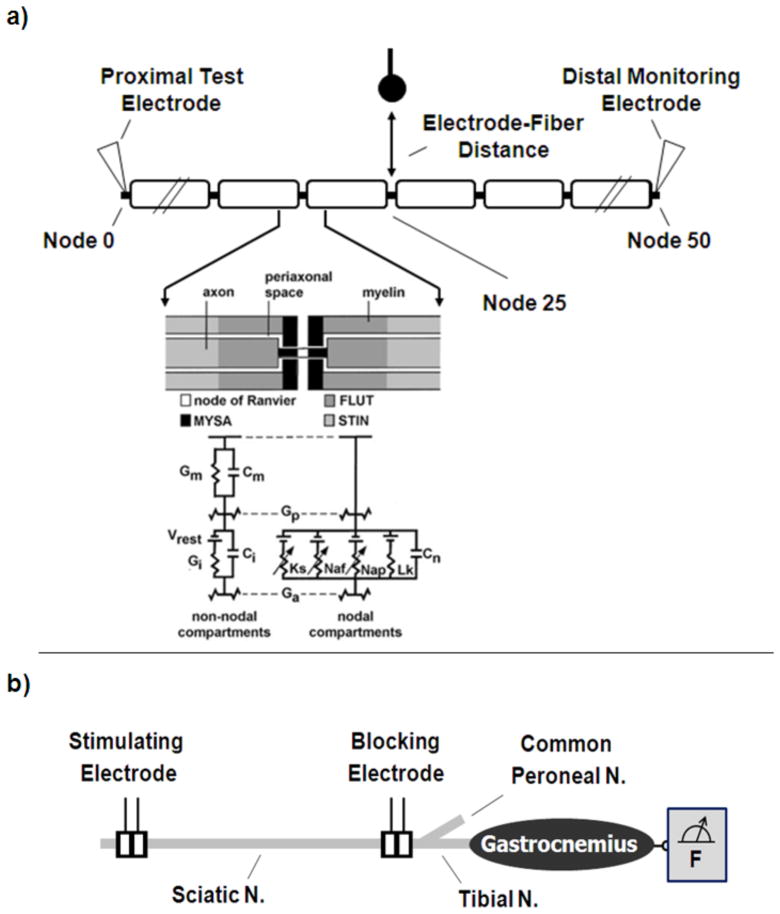
As depicted in Figure 2, the cable model is composed of single-segment nodal sections composed of linear and non-linear circuit elements, and multi-segment double-layered internodal sections incorporating linear dynamics. The model accounts for four nodal currents including fast sodium, persistent sodium, slow potassium and a linear leak current. The non-linear nodal dynamics are of the Hodgkin-Huxley type [47], parameterized to match mammalian spike physiology [46]. Axon diameters of 5.7 μm, 7.3 μm, 10.0 μm and 15.0 μm were evaluated. Nominal axon-specific parameters are identical to those in the original McIntyre paper. For reference, nominal maximum nodal conductances were 3.0 S/cm2, 0.08 S/cm2, 0.01 S/cm2, 0.007 S/cm2 for the fast sodium, potassium, persistent sodium and linear leakage currents, respectively [46]. The Neuron model was solved using backward Euler implicit integration using a time-step of at least one twenty-second the period of a sinusoidal stimulation cycle, with a minimum of 0.0045 msec.
Figure 2.
a) The double cable myelinated axon model used to simulate high frequency conduction block. The model included dynamics accounting for the following ionic currents: slow potassium, Ks, fast sodium, Naf, persistent sodium, Nap, and linear leakage, Lk. The passive network representing the fiber geometry accounted for capacitance contributions from the nodal membrane, Cn, internodal axolema, Ci, and myelin sheath, Cm, and for bulk ionic conductance of axoplasm, Ga, periaxonal space, Gp, internodal axolema, Gi, and myelin sheath, Gm. A simulated extracellular point source electrode was placed opposite the central node at a distance of 1.0 mm, and an intracellular point source electrode was placed in the first node. Inset used with permission (McIntyre, Richardson and Grill 2004 [46]). b) Diagram of the experimental setup in the rat showing sciatic nerve cuff electrode placement. The proximal electrode was utilized for test stimuli, and the distal electrode for HFS delivery. Muscle force was monitored using an axially loaded force transducer.
A 51 node axon model was evaluated for these simulations. As shown in Figure 2, two types of stimulation electrodes were simulated in the model as point sources: an extracellular monopolar electrode for delivery of the HFS and an intracellular monopolar electrode to test for conduction block. The extracellular environment was assumed to be isotropic and homogenous with an extracellular resistivity, ρe, of 500 Ω-cm [48]. The extracellular HFS electrode was placed directly above the center node of the axon at a distance of 1.0 mm. Zero-mean sinusoidal currents were delivered through the HFS electrode for each simulation with frequencies ranging from 6kHz to 40 kHz in 2kHz increments. The extracellular potential, Ve, was calculated using the following equation:
| (1) |
where Ielec is the electrode current and r is the distance from the electrode. The intracellular electrode was used to test whether conduction block was achieved, using the protocol described previously by Bhadra, et al. [25].
This model represents effects resulting from the axonal geometry and four nodal ion currents, and was chosen because it captures the experimentally observed HFB phenomena we are investigating. However, more complex models which capture three dimensional tissue geometry effects [49], ion accumulation [50], etc. have been developed, and may be useful for further investigation of HFB under other conditions.
Channel Conductance Sensitivity Analysis
The effect of each of the four nodal currents on the blocking effect was tested using a channel conductance sensitivity analysis. Sensitivity analysis is a powerful tool for characterizing the relationships between system parameters and performance [51]. To understand the contributions of different nodal currents to the mechanism of high frequency block we systematically varied the conductance of each channel type by ± 1, 2, 5, 10 and 20% of the nominal value, and assessed whether the blocking affect was enhanced or diminished. Limiting the change in conductance to a small range allowed us to focus on approximately linear effects on conduction block, for which one can quantitatively compare the relative contributions of different ionic currents to HFB. Computationally, we limited applied conductance changes to currents within a single node -- the node closest to the extracellularly applied high frequency stimulation -- rather than applying the changes equally to all nodes. Initial simulations showed that changing ionic current conductance at all nodes resulted in a distortion of the action potential shape and membrane excitability at nodes distal to the blocking electrode. By limiting the conductance changes to a single node closest to the electrode, we were able to isolate the conductance changes to the region of the axon most affected by the HFS without otherwise distorting normal action potential conduction.
In a separate series of simulations designed to parallel the experimental portion of the study, changes were made to all nodes in the model. In this series of simulations the nodal persistent sodium conductance was reduced to zero in all nodes, mimicking the effect of the channel blocker ranolazine which we evaluated experimentally.
Our measure for assessing enhancement or abatement of the blocking effect was the block threshold, the minimal current required to achieve block at a given stimulation frequency. Block threshold has been used as a measure in several experimental and simulation studies to test how isolated experimental variables such as waveform frequency [13–17, 21, 25, 30] or electrode configuration [12] augment or weaken conduction block. Variable changes that augment the blocking effect of HFS on nerve conduction result in a decrease in the block threshold from a control scenario. Variable changes that diminish the blocking effect of HFS on nerve conduction result in an increase in the block threshold from a control scenario. For these simulations, the amplitude of the extracellular high frequency current was varied using a binary search to find the block threshold (minimal current at which the axon achieved conduction block) with a resolution of 100 nA. For amplitudes at which block could be achieved, firing activity stabilized within approximately 30 msec [25]. After 40 msec of the HFS delivery a 0.1 msec, 10 nA current pulse was delivered at Node 0 (at one end of the fiber) using the intracellular electrode. The fiber was determined to be blocked if the action potential did not propagate through to the last node (node 50) on the other side of the blocking electrode.
Spectral Analysis of Channel Gating Variables
High frequency electrical stimulation by a sinusoidal waveform typically induces a high frequency oscillatory membrane potential response in the form of a sinusoid combined with a DC voltage offset of some tens of mV. We studied the ability of different channel gating variables to follow a rapidly fluctuating sinusoidal voltage with a given DC voltage level corresponding to that observed in simulation. We fixed a sinusoidal voltage signal in the form V(t)=A+Bsin(2πωt), where V(t) is the membrane voltage (mV), A=−50 mV is the mean and B=50 mV is the amplitude of the imposed voltage fluctuation. Each gating variable obeyed first order kinetics with voltage-dependent rate constants:
| (2) |
where αx and βx are particular nonlinear functions of the voltage for each gating variable (x = p - persistent sodium activation, h - fast sodium inactivation, m - fast sodium activation, or s - slow potassium activation) as described in [46]. The differential equations were solved numerically using a 4th order Runge Kutta method implemented in Matlab 7. Fifty frequencies were evaluated in the range 0.1 ≤ ω ≤ 100 kHz. For each frequency, a 100 msec initial transient was discarded, after which a time series consisting of at least 32 sinusoidal periods with a sampling rate of 8ω kHz was collected. The RMS power of the gating variable time series was determined from the FFT on 256 samples.
Effect of Changing Gating Variable Time Constants on Minimum Blocking Frequency
Simulations were conducted to explore the relationship of the lowest HFAC blocking frequency to global changes in tau for each of the four gates in the MRG model (m, h, p and s). The simulations were run on a 10 micrometer diameter axon with an external monopolar electrode positioned over the central node at 1 mm distance from the axon. Sinusoidal HFAC was injected and an iterative search conducted to identify the lowest frequency that produced axonal block. The value of tau was changed individually for each gate by plus and minus percentage changes.
Experimental Measurement of Effect of Ranolazine on Block Threshold
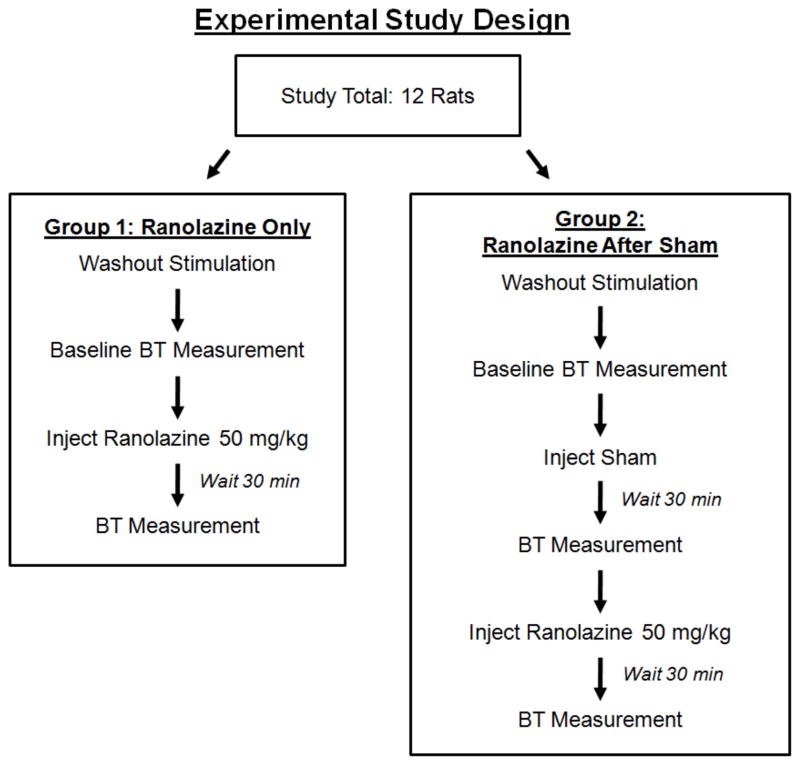
We conducted channel blocking experiments in a rat sciatic nerve preparation that paralleled a subset of the simulations investigated in silico. The effect of the persistent sodium channel blocker ranolazine on block threshold in vivo was measured using a sham-controlled study in twelve animals at two HFB frequencies: 20kHz (ten rats) and 30kHz (twelve rats). Ranolazine was chosen because 1) preliminary in silico analysis indicated that complete blockade of the persistent sodium channel still allowed for action potential conduction (important for analysis of effects in a whole nerve/muscle preparation), and 2) because Ranolazine may have clinical relevance as a combination therapy by potentially allowing for separation of blocking thresholds between myelinated and unmyelinated fibers. 20 kHz and 30 kHz were chosen because they resulted in a reasonably short duration of onset response firing [15] and did not require large current amplitudes to achieve conduction block. Figure 3 describes the experimental design in detail. Briefly, there were two groups of six animals each: Group 1, which received a ranolazine treatment, and Group 2, which received a sham treatment followed by a second treatment with ranolazine. In each animal, block thresholds were measured after each treatment, and compared to a baseline measurement taken before any treatments were administered.
Figure 3.
Experimental study design showing animal grouping and experimental protocol. The study included a total of 12 rats, distributed equally between two groups; (1) a ranolazine treatment group or (2) a two stage sham and ranolazine treatment group.
The experiments were performed in a rat sciatic nerve and gastrocnemius-soleus muscle preparation which has been used in other HFB studies in the rat [12, 13, 15, 18]. All protocols involving animal use were approved by our institutional animal care and use committee. The animals were anesthetized with intraperitoneal, IP, injections of Nembutal (pentobarbital sodium), which has previously been used in rat preparations investigating the effects of ranolazine [52, 53]. The Nembutal dosage was an initial 25 mg IP followed by 12.5 mg IP approximately every 1 to 1.5 hours. The left hind leg was shaved and an incision was made along the posterior aspect of the hind leg and thigh. A 1.5 cm length of the sciatic nerve was exposed under microscopic dissection proximally from the popliteal fossa. The gastrocnemius-soleus muscle complex was dissected, and the calcaneal (Achilles) tendon was severed from its distal attachment at the heel. The ipsilateral tibia was stabilized to the experimental rig via a clamp, and the calcaneal tendon was tethered to a force transducer with 1–2 N of passive tension.
Block thresholds were measured using a procedure similar to that used in several other studies [12, 13, 15]. Two bipolar silastic rubber nerve cuff electrodes with a J-shaped cross-section and 3mm × 1mm rectangular platinum contacts were placed on the sciatic nerve (the 1 mm dimension was along the longitudinal axis of the nerve) [54]. Each electrode had a 2.0 mm inter-contact spacing [12], and the electrodes were separated from one another by approximately 1 – 4 mm. The proximal electrode was used to generate gastrocnemius-soleus muscle twitches with the delivery of 1.5 Hz, 50 μsec supramaximal (typically 300 – 600 μA) cathodic pulses using a Grass S88 (Grass Technologies, West Warwick, RI, USA) stimulator with a current-controlled output stage. Current-controlled 20 kHz or 30 kHz sinusoidal blocking waveforms were delivered through the distal electrode using a Keithley 6221 waveform generator (Keithley Instruments, Cleveland, OH, USA). Block threshold trials were computer-controlled and consisted of a period of ~3 seconds of 1 Hz proximal stimulation, followed by a period of proximal stimulation combined with distal 20 kHz or 30 kHz HFS delivery. For each trial the HFS amplitude was initially 11.0 mApeak. After 10 seconds (to allow the onset activation to subside), the amplitude of the high frequency waveform was decremented by 0.1 mA/sec. The lowest amplitude at which no muscle twitches were present was determined to be the block threshold. Each trial was followed by a 3 minute wait to minimize any effect of trial-trial nerve accommodation to the HFS on the block threshold.
Preliminary experiments showed a transient but sustained increase in block thresholds which occurred with cumulative HFS (without administration of any sham or ranolazine treatment). To prevent this transient increase in block thresholds from confounding the experimental measures, each animal was exposed to pre-treatment exposure to HFS at 20 kHz and 30 kHz until the block threshold measurements stabilized (this was achieved using repeated block threshold measurements until the measurements reached a plateau). The pretreatment HFS was followed by a baseline block threshold measurement before any treatment was administered. After the baseline threshold measurement, we applied the branched protocol described in Figure 3 by injecting either an IP sham or ranolazine treatment. The ranolazine was prepared and administered according to published protocol [37, 55]. The ranolazine treatment was prepared by dissolving 500 mg Ranexa into 20 mL of 0.9% isotonic saline. The solution pH was adjusted to either 3.0 (three rats in each Group) or 6.0 (three rats in each Group) using sodium hydroxide and hydrochloric acid [37]. A pH matched saline sham was prepared in the same manner. Ranolazine was delivered via intraperitoneal injection at a dose of 50 mg/kg [37, 55]. For the sham treatments, an equivalent saline volume was injected. Each treatment was followed by a 30 minute wait to ensure approximate peak plasma uptake [37]. There were four repeated block threshold measurements at each frequency after each treatment (the measurement order was block randomized).
Experimental Data Analysis and Statistics
For each of the two frequencies tested, the change in block threshold from the baseline measurement (mApeak) was assessed for each of the treatment groups in each animal. The changes in block threshold from baseline for the “sham” group and the “ranolazine” treatment group were compared to one another using a Student’s t-test at the 0.01 significance level. The changes in block threshold from baseline for the “sham” and “ranolazine after sham” treatment groups were compared to one another using a paired Student’s t-test at the 0.01 significance level (a paired test was used since the experiments were performed in the same animals). Data are displayed as relative changes (% change in BT) from baseline so a direct comparison could be made to the simulation results.
RESULTS
Axon Behavior Under High Frequency Stimulation
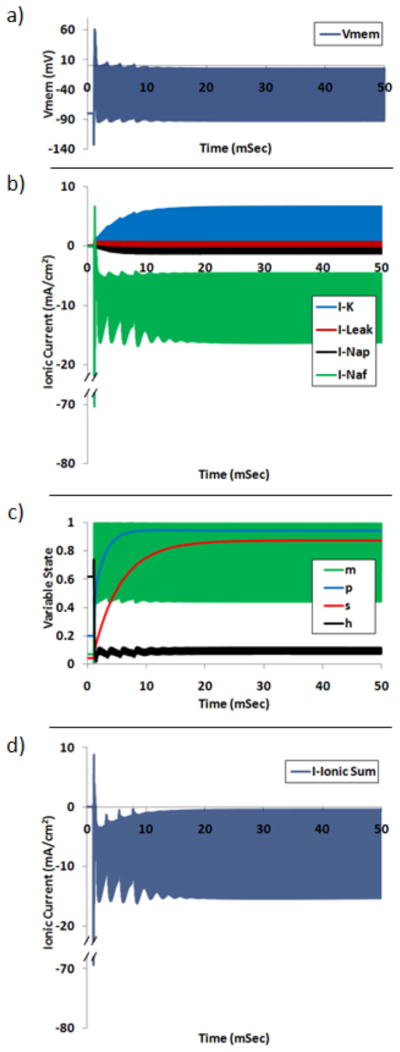
Each of the simulated axons exhibited a net membrane depolarization when in the blocked state. An example of this depolarization is shown in Figure 4a for a 10 μm fiber (with nominal conductance values) subjected to sinusoidal stimulation of 10 kHz at the block threshold electrode amplitude of 0.571 mA. The fiber exhibited conduction block for times greater than approximately 20 mSec. Figure 4b shows each of the four ionic currents for Node 25 (closest to the blocking electrode) during the 10 kHz stimulation. Inward currents are represented as negative in the plot, and outward currents are positive. Each of the currents experienced a transient period and stabilized to a quasi-steady-state within approximately 20 msec. This transient oscillatory behavior is referred to as the onset response and has been more thoroughly investigated in other studies [9, 23, 25]. The model exhibited a zero-mean sinusoidal capacitive membrane current (not pictured). Figure 4c shows the net ionic current for Node 25 (the sum of each of the ionic currents). The net ionic current was oscillating and inward for the period of the simulation. Figure 4d shows each of the four channel gating variables during the simulation: m (fast sodium activation), p (persistent sodium), s (potassium) and h (fast sodium inactivation). For simulation times in which the fiber is in the blocked state (simulation times greater than approximately 20 msec), each of the gating variables exhibits quasi-steady-state behavior. The m variable exhibits the largest amplitude quasi-steady-state oscillations, followed by h, p and s. In the blocked state the mean of the variable states for the m, h, p and s variables are 0.75, 0.09, 0.94 and 0.87, respectively. Each of the three voltage gated ionic conductances have a net increase in the blocked state. The mean multiple increase in conductance for the fast sodium, potassium and persistent sodium currents is 157.9, 20.3 and 4.7, respectively. The equivalent percentage of fast sodium channels in each of the three functional states are 3.8% conducting (open, m3h), 5.4% activatable (closed, 1− m3h−(1−h)) and 90.8% inactivated (closed, 1−h).
Figure 4.
Simulation output for Node 25 (central node) under 10 kHz stimulation at block threshold amplitude. a) Membrane potential. b) Ionic currents: potassium, K, linear leakage, Leak, persistent sodium, Nap, fast sodium, Naf. c) Each of four membrane gating variables: fast sodium activation, m, persistent sodium, p, potassium, s, and fast sodium inactivation, h. d) Sum of all four nodal ionic currents. High frequency fluctuations appear as a solid bar due to temporal resolution.
Hypothesis 1: Depolarizing currents promote conduction block via inactivation of sodium channels
Sensitivity Analysis
Hypothesis 1 was confirmed using a sensitivity analysis of the nodal current conductances. Increasing the conductance of depolarizing currents was found to decrease block thresholds, promoting the blocking effect. Increasing the conductance of hyperpolarizing currents was found to decrease block thresholds, diminishing the blocking effect.
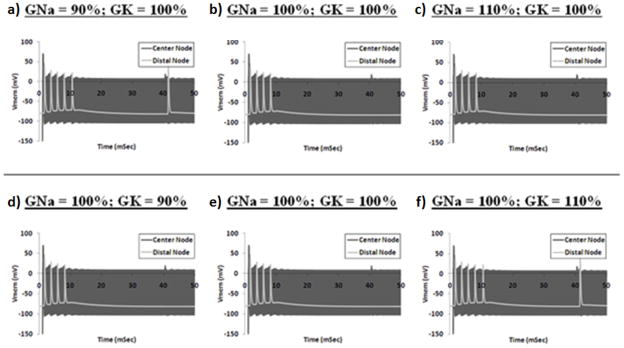
Figure 5 shows plots of membrane voltages for Node 25 (closest to the blocking electrode) and for Node 50 (node distal to the block electrode) of a 10 μm fiber when subjected to 10 kHz sinusoidal stimulation under various ionic conductance conditions. The electrode amplitude is 0.571 mA, which is the block threshold for a fiber with nominal ionic conductances (± 100 nA). Figures 5a–c show simulations for which the sodium conductance is 90%, 100% or 110% of the nominal value, respectively, and the potassium conductance is equal to 100% of the nominal value. Figures 5d–f show simulations for which the potassium conductance is 90%, 100% or 110% of the nominal value, respectively, and the sodium conductance is equal to 100% of the nominal value. Figure 5a shows that a 10% reduction in the fast sodium conductance from the nominal value results in a condition in which the fiber does not block a proximally elicited action potential with an electrode current amplitude of 0.571 mA. Figure 5b shows that a fiber with nominal conductance values blocks the proximally elicited action potential under the same simulation conditions. Figure 5c depicts the simulation of a fiber with a 10% increase in the fast sodium conductance in which the proximally elicited action potential is blocked under the same simulation conditions. Figures 5d–f show that changes in the potassium conductance also influence the blocking nature of the fiber under identical sinusoidal stimulation conditions. Figure 5d shows that a fiber with a 10% reduction in the potassium conductance from the nominal value continues to block a proximally elicited action potential. Figure 5f shows that a fiber with a 10% increase in the potassium conductance does not block the action potential.
Figure 5.
Membrane voltages for Node 25 and Node 50 of a 10 μm fiber when subjected to 10 kHz sinusoidal stimulation at block threshold amplitude under various ionic conductance conditions. Electrode amplitude is 0.571 mA for all simulations. For each simulation, a test pulse initiated an outwardly propagating action potential at T=40 msec. a–c) Simulations for which the sodium conductance is 90%, 100% or 110% of the nominal value, respectively, and the potassium conductance is equal to 100% of the nominal value. d–f) Simulations for which the potassium conductance is 90%, 100% or 110% of the nominal value, respectively, and the sodium conductance is equal to 100% of the nominal value. High frequency fluctuations appear as a solid bar due to temporal resolution.
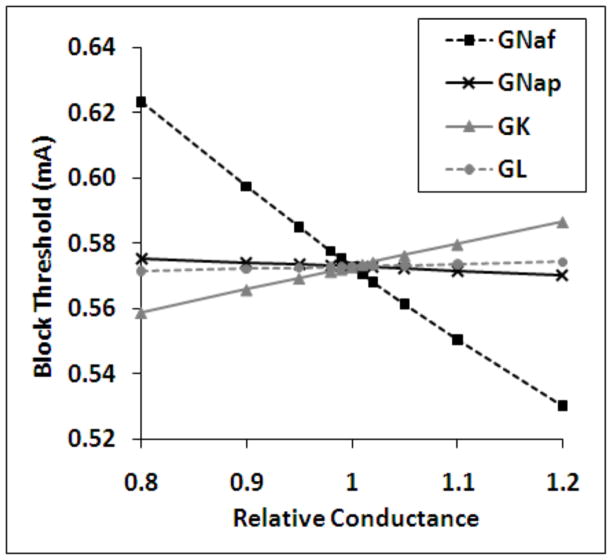
Figure 6 shows summary data for an ion conductance sensitivity analysis performed for a 10 μm fiber using a 10kHz extracellular sinusoidal blocking waveform. The abscissa depicts the relative conductance of each of the four ionic conductances which was simulated for each data point in the figure. The ordinate displays the minimum amplitude of the sinusoidal electrode current required to induce conduction block in the fiber in mA (block threshold). The block threshold was most sensitive to relative changes in the fast sodium conductance, followed by the potassium, persistent sodium and leak conductances, respectively. The fast and persistent sodium conductances exhibited negative sensitivity values (a decrease in block threshold for increases in conductance). The potassium and leak conductances exhibited positive sensitivity values. The same analysis was performed over a frequency range of 6 kHz – 40 kHz for fibers with diameter of 5.7 μm, 7.3 μm, 10.0 μm and 15.0 μm. This analysis showed a similar trend for all frequencies and fiber diameters. Table 2 summarizes the data measured over the range of simulations and describes the overall effect of each ionic current on the nodal potential (depolarize or hyperpolarize), the effect of increasing each ion’s conductance on the block threshold (increase or decrease), the effect of decreasing each ion’s conductance on the block threshold (increase or decrease) and the range of the numerical sensitivity of the block threshold to each of the ionic conductances as measured over the range of variables tested (ΔBT/ΔG).
Figure 6.
Results of the sensitivity analysis for 10 μm fibers under 10 kHz sinusoidal stimulation. Abscissa: the relative conductance of each of a single ionic conductance which was modified for each data point in the figure. Ordinate: the minimum amplitude of the sinusoidal electrode current required to induce conduction block in the fiber in mA (block threshold). Legend: fast sodium, GNaf, persistent sodium, GNap, potassium, GK, and linear leakage, GL.
Table 2.
Summary of effects of each of four nodal currents on the membrane potential, the blocking phenomenon and the range of sensitivities measured for each of the conductances. The effect of each current was evaluated by varying the conductance of each channel type by ± 1, 2, 5, 10 and 20% of the nominal value, and observing the corresponding increase or decrease in conduction block threshold at a given frequency. Stimulation frequencies tested ranged from 0.1 kHz to 100 kHz.
| Nodal Current | Effect on Vmem | Effect of Increasing Conductivity | Effect of Decreasing Conductivity | Sensitivity Range (ΔBT/ΔG) |
|---|---|---|---|---|
| Na (Fast) | Depolarize | Decrease BT | Increase BT | −0.39 – −0.34 |
|
| ||||
| (Per.) | Depolarize | Decrease BT | Increase BT | −0.017 –−0.024 |
|
| ||||
| Leak | Hyperpolarize | Increase BT | Decrease BT | 0.010 – 0.013 |
|
| ||||
| K | Hyperpolarize | Increase BT | Decrease BT | 0.10 – 0.12 |
Na (Fast) = fast sodium current; Na (Per.) = persistent sodium current; Leak = leak current; K = potassium current; BT = block threshold; ΔBT/ΔG = relative change in block threshold per change in maximal conductance.
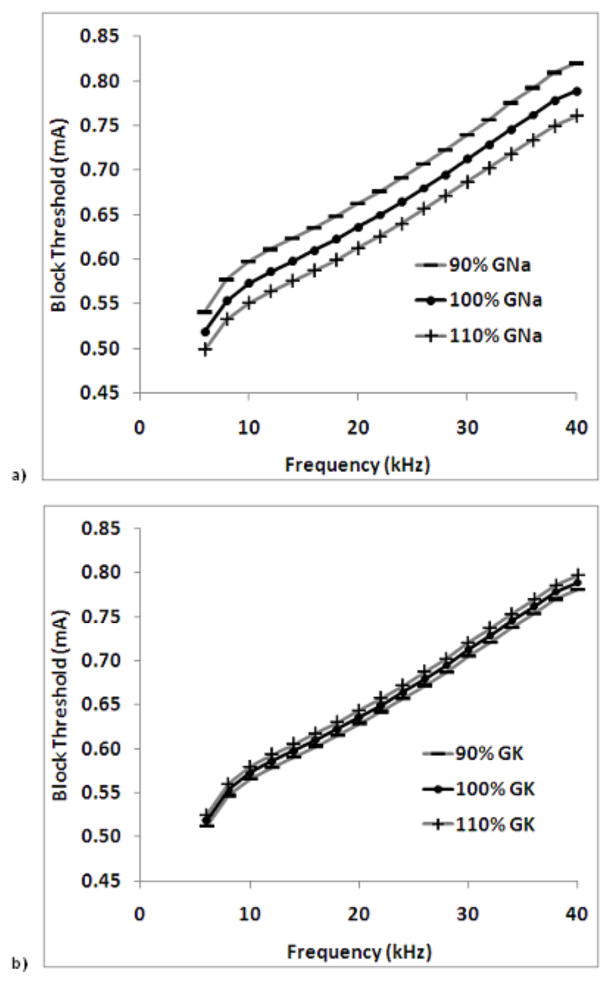
Figure 7 shows the effect of increasing and decreasing ionic conductance on the block threshold over a range of frequencies for the two ions which exhibited sensitivities of the largest magnitude: fast sodium and potassium. These data are for a 10.0 μm fiber. Figure 7a shows that block thresholds are increased for a reduction in fast sodium conductance, and that block thresholds are decreased for increases in fast sodium conductance over the frequency range tested. Figure 7b shows that block thresholds are decreased for a reduction in potassium conductance, and that block thresholds are increased for increases in potassium conductance over the frequency range tested.
Figure 7.
Effect of increasing and decreasing ionic conductance on the block threshold over a range of frequencies for the two ions which exhibited sensitivities of the largest magnitude: a) fast sodium and b) potassium. These data are for a 10.0 μm fiber.
Effect of Ranolazine on Experimental Block Threshold
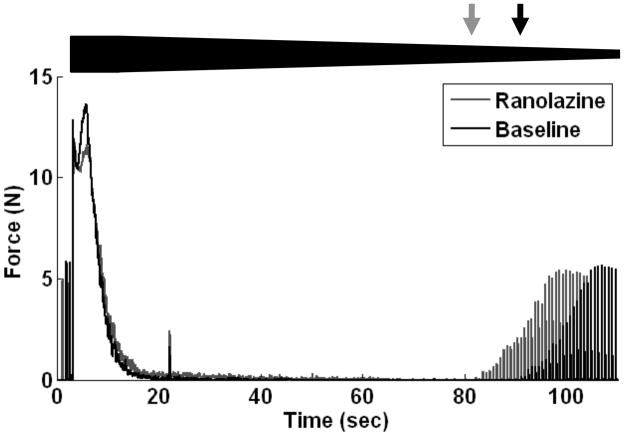
As an experimental adjunct to the sensitivity analysis, the effect of the persistent sodium channel blocker Ranolazine on block threshold was tested in vivo. Figure 8 shows 110 seconds of a typical complete HFS conduction block trial using a frequency of 20 kHz both at baseline and after injection of ranolazine. The relative HFS amplitude is shown with the bold trapezoid in the figure. Each trace represents the recorded gastrocnemius-soleus muscle force for a separate block threshold measurement trial in which the HFS amplitude was decremented from 11.0 mA in 0.1 mA/sec steps. The absence of muscle twitches during a proximal stimulation pulse indicates complete conduction block, and submaximal amplitude muscle twitches indicate partial conduction block. The black and grey arrows in Figure 8 indicate the block threshold amplitude for the baseline and ranolazine traces, respectively. After injection of ranolazine, the block threshold for the nerve increased as indicated by the presence of muscle twitches at higher blocking current amplitudes than for baseline. The slight twitch after 20 seconds of HFS delivery in both trials sometimes occurred when the stimulator switched from 11.0 mA to 10.0 mA.
Figure 8.
Typical complete HFS conduction block trial using a frequency of 20 kHz both at baseline and after injection of ranolazine. The relative HFS amplitude is shown with the bold line in the figure. Black and gray arrows indicate the block threshold amplitude for the baseline and ranolazine traces, respectively.
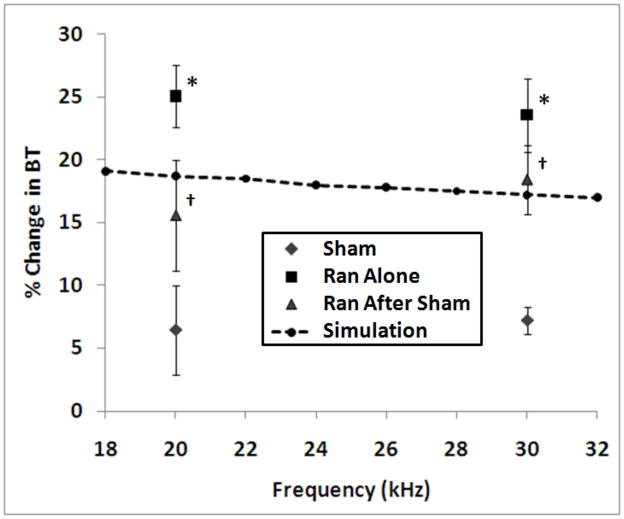
Figure 9 shows summary results from the channel blocking experiments. The abscissa shows the blocking frequency, and the ordinate shows the mean percent change in block threshold from baseline after each treatment (sham, ranolazine and sham + ranolazine). The error bars show the standard error from the mean. The ‘*’ symbol indicates a significant difference from the baseline group using an unpaired t-test, and the ‘†’ symbol indicates a significant difference from the baseline group using a paired t-test. At 20 kHz the sham and ranolazine groups were found to be significantly different with p = 0.001, and the sham and sham + ranolazine groups were found to be significantly different with p = 0.005. At 30 kHz the sham and ranolazine groups were found to be significantly different with p = 0.006, and the sham and sham + ranolazine groups were found to be significantly different with p = 0.001. The effect of ranolazine on block threshold was simulated using a 10 μm diameter single fiber model by setting the persistent sodium conductance to zero for each node in the fiber. The results of these simulations are shown in Figure 9, which shows the percent change in block threshold resulting from this blockade over the frequency range evaluated experimentally (change is relative to the same fiber with nominal conductance values).
Figure 9.
Summary results from the channel blocking experiments. The abscissa shows the blocking frequency, and the ordinate shows the mean percent change in block threshold from baseline after each treatment (sham, ranolazine, and sham + ranolazine). The error bars show the standard error from the mean. The ‘*’ symbol indicates a significant difference from the baseline group using an unpaired t-test, and the ‘†’ symbol indicates a significant difference from the baseline group using a paired t-test. The change in block threshold for a simulated 10 micron fiber with complete persistent sodium blockade is overlaid on the plot (change is relative to the same fiber with nominal conductance values).
Hypothesis 2: Gating dynamics of the fast sodium channel are the primary determinate of minimum blocking frequency
Spectral Analysis of Channel Gating Variables
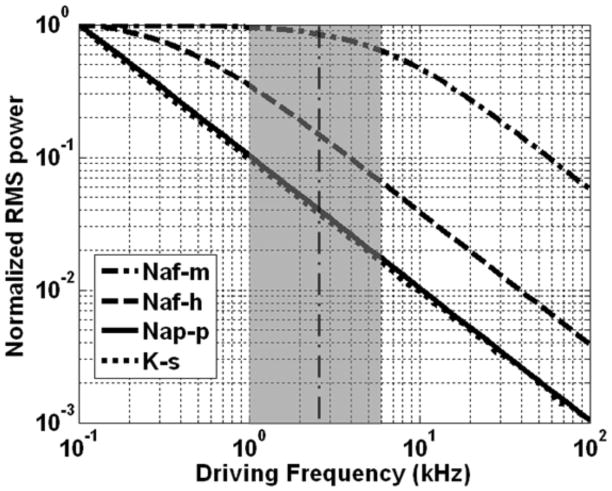
Hypothesis 2 was confirmed using a spectral analysis of the nodal current variables, and by testing the effect of modification of the gating time constants on the minimum blocking frequency. Figure 10 shows the results of this analysis performed for each of the gating variables. This analysis depicts the relative magnitude of gate variable response due to oscillatory changes in membrane voltage over a frequency range of 0.1 kHz – 100 kHz. The abscissa shows the frequency of the sinusoidal driving potential (log scale, kHz), and the ordinate shows the RMS power of the oscillations for each of the four gating variables when driven by the sinusoidal potential oscillations (normalized power on a log scale). Each of the gating variables exhibits a typical first-order low-pass response: the variables exhibit a response of uniform magnitude for low frequencies and a log-linear -10 dB/decade decrease in response for frequencies above a particular corner frequency. The fast sodium activation gating variable exhibited the fastest dynamics as indicated by its wide bandwidth in Figure 10, followed by the fast sodium inactivation, persistent sodium and potassium gating variables. The vertical bold dashed line depicts the minimum sinusoidal frequency for which conduction block could be achieved in this modeling study (above which conduction block occurred, and below which repetitive activation occurred): ~2.5 kHz. The grey shaded region depicts the range of the experimentally measured minimum blocking frequency for mammalian preparations [4, 7, 14, 17, 20].
Figure 10.
Results of the spectral analysis performed for each of the gating variables. Abscissa: frequency of the sinusoidal driving potential (log scale, kHz). Ordinate: normalized RMS power of the oscillations for each of the four gating variables when driven by the sinusoidal potential oscillations (log scale, unitless). Vertical dashed line at 2.45 kHz indicates the minimum block frequency observed for the nominal conductance values. The gray region illustrates the range of minimum blocking frequencies which have been published in the literature.
Minimum Blocking Frequency & Gating Time Constants
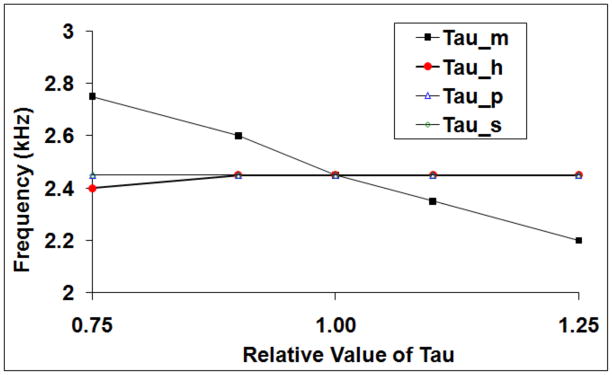
Hypothesis 2 was tested experimentally by determining the minimum blocking frequency under conditions of modification of a single gating variable time constant (tau). Each of the four gating time constants (fast sodium activation, fast sodium inactivation, persistent sodium and potassium) was modified by up to +/− 25% of its nominal value. Figure 11 shows that changes in minimum blocking frequency were dominated by changes in the fast sodium activation gate time constant (tau_m), and that the other three gates exhibited little effect on the minimum blocking frequency.
Figure 11.
Effect of modifying channel gating time constant on minimum blocking frequency. The abscissa shows the relative value of tau compared to the default value; the ordinate shows the minimal block frequency. Observed changes in minimum blocking frequency were dominated by changes in fast sodium activation gate time constant.
It can be seen mathematically that a shift in tau results directly in a corresponding log linear shift in the corner frequency of the low-pass response. Consider a gating variable x obeying the inhomogeneous linear differential equation (2), with time varying coefficients α(V(t)) and β(V(t)). If we perform a change of variables to new time units u=kt, we find that x obeys
If x=f(t) is a solution to the equation (2) for a given sinusoidal voltage clamp V(t), then x=f(t/k) is a solution to equation (3). These two solutions will have exactly the same power in response to sinusoidal forcing V = A + B sin(2πωt) at frequencies ω and ω/k, respectively. Therefore the Bode plots will be identical, except for a constant shift (on the log scale) of exactly log(k).
DISCUSSION
In this study, we investigated two hypotheses: 1) Depolarizing currents promote conduction block via inactivation of sodium channels, and 2) Gating dynamics of the fast sodium channel are the primary determinate of minimum blocking frequency.
Hypothesis 1
The first hypothesis was confirmed through a combination of 1) an ionic conductance sensitivity analysis in silico, and 2) experimental administration of the persistent sodium channel blocker Ranolazine.
The sensitivity analysis performed in this study shows that both depolarizing and hyperpolarizing currents play an important role in HFB, however each with opposing effects. In simulation, depolarizing currents were found to contribute to the blocking effect, and hyperpolarizing currents were found to diminish the blocking effect. The depolarizing and hyperpolarizing currents for which the block threshold exhibited the largest sensitivity in the model were the fast sodium current, and potassium current, respectively. The system is likely the most sensitive to these two currents as a result of their large maximum conductance relative to the other depolarizing and hyperpolarizing ionic currents.
Figure 4a shows the membrane voltage of a fiber during delivery of blocking HFS. In this simulation (and in each of the others where HFB was observed), depolarizing currents were larger in magnitude than hyperpolarizing currents, resulting in net membrane depolarization and a high degree of sodium channel inactivation. Figure 1 depicts an intracellular recording of a frog node of Ranvier under 10 kHz intracellular stimulation as recorded by Bromm in a 1975 study [32]. The time course and depolarized nature of the membrane voltage are qualitatively consistent with our simulation findings, suggesting a dominance of depolarizing currents in Bromm’s in vivo study as well.
The sensitivity analysis presented here suggests that depolarizing sodium currents played a block-promoting role, while hyperpolarizing potassium currents played a block-diminishing role. Net depolarization occurred despite an increase in conductance for potassium currents, because the increase in conductance to sodium currents was larger than the increase in conductance to potassium currents. This net depolarization resulted in a low mean value for the sodium inactivation gating variable during HFB. The simulation data are supported by our experimental findings: administration of Ranolazine resulted in an increase in the block threshold. By chemically blocking the HFB-promoting persistent sodium current, block thresholds increased. The data are quantitatively similar to the analogous simulation performed in silico.
In conclusion, depolarizing currents were found to promote conduction block, and hyperpolarizing currents were found to inhibit conduction block. Our simulation results indicate that conduction block is mediated by inactivation of sodium channels.
Hypothesis 2
The second hypothesis (Gating dynamics of the fast sodium channel are the primary determinate of minimum blocking frequency) was confirmed through 1) a spectral analysis of each of four gating variables, and 2) testing the effect of modification of channel gating time constants on minimum blocking frequency in silico.
Each of the four gating variables displayed a typical first-order low-pass spectral response, showing larger magnitude oscillations for a low frequency driving potential than for a driving potential higher than a particular corner frequency. The difference in the frequency response of the gating variables is evident in the spectral plot of Figure 7, and in the time plots in Figure 4d. Figure 4d shows each gating variable’s behavior when a simulated axon was driven with 10 kHz extracellular sinusoidal stimulation. The p and s variables exhibited almost no oscillatory behavior, the h variable exhibited only minimal oscillation and the m variable exhibited significant oscillation. The magnitude of these oscillations was consistent with the spectral analysis presented in Figure 10. The p and s variables exhibited only ~1 % of the passband oscillation power at 10 kHz, the h variable exhibited only 4 %, and the m variable exhibited 50 % of the passband power.
As shown in Figure 4d, each of the four gating variables also exhibited a baseline shift when the membrane was in the depolarized conduction block state. Since the dynamics of each of the gating variables were low-pass in nature, each readily tracked the low frequency (~0 Hz) depolarized shift in the membrane potential. As a result, the mean values of m, p and s are increased from rest and the mean value of h is decreased when the axon is in the block state. A mean of 90.2% of the nodal sodium conductance was inactivated, 3.8% was actively conductive to sodium current, and only a small fraction was activatable (mean of 5.4 %). These same data show that potassium and persistent sodium channels had increased conductance from resting values, but to a lesser extent than fast sodium.
Figure 11 shows the effects of gating time constant on minimum blocking frequency. Increasing the time constant for a gating variable effectively decreases the low-pass corner frequency for the gate. The fast sodium channel activation gate has the primary influence on the minimum blocking frequency. This is likely because oscillations in the fast sodium current result in repetitive action potential activity [25]. When these oscillations are diminished for a given frequency, the fiber achieves block for a lower electrode current.
In conclusion, the gating dynamics of the fast sodium channel are the primary determinate of minimum blocking frequency.
Summary of Membrane Behavior During High Frequency Block
During HFS simulation, each of the three ionic currents became active relative to resting values. Inward sodium currents were larger than the sum of the outward currents and resulted in a net depolarization of the nodal membrane. The results of the spectral analysis suggest that the dynamics of the fast sodium channel were too slow to track high frequency changes in membrane potential during HFS. As a result, the behavior of the fast sodium current was dominated by the low frequency depolarization of the membrane and not the high frequency oscillations. In the central node of the simulated axons, only 5.4% of the fast sodium conductance was in the activatable state during HFB (and thus available for saltatory propagation of an action potential). This small fraction is likely insufficient to generate enough sodium current to perpetuate an action potential. Nodes beyond the central node showed an asymptotically decreasing degree of inactivation in both directions. This phenomenon is similar to intracellular direct current blocking stimulation, which results in the firing of a few action potentials followed by a quiescent depolarized steady-state as shown experimentally by Bromm [32]. Similarly, the intracellular depolarization technique blocks action potential conduction by inactivation of sodium channels. The experimentally observed increase in block threshold in the ranolazine study supported the simulation finding that depolarizing phenomenon (in this case persistent sodium current) promoted blocking behavior.
Extracellular cation accumulation may also play a role in HFB. Extracellular potassium accumulation is known to cause membrane depolarization [56], and has been associated with conduction block in neurons of the central nervous system [57, 58]. Large changes in the Nernst potential, and therefore large changes in extracellular potassium concentration would be required to block an axon via this mechanism alone. Any depolarization resulting from extracellular potassium accumulation would augment depolarization induced by nodal currents. The slow accumulation of potassium may contribute to the dynamics of the seconds long “onset response” firing that sometimes occurs when the HFS is first applied [1, 6, 7, 13–16, 18–21, 23]. Cation accumulation is worthy of further investigation, perhaps using sensitivity analysis techniques to compare the relative effect of potassium accumulation to nodal currents.
Acknowledgments
This work was supported in part by NSF Grants No. DMS-0720142 and DMS-1010434, NIBIB Grant No. R01-EB-002091 and the Oberlin College Library. The authors thank K. Kilgore and H. Chiel for their helpful comments and discussion, and M. Kilgore for his assistance running some of the simulations.
References
- 1.Kilgore K, Bhadra N. Nerve conduction block utilizing high-frequency alternating current. Medical and Biological Engineering and Computing. 2004;42:394–406. doi: 10.1007/BF02344716. [DOI] [PubMed] [Google Scholar]
- 2.Foldes E, Ackermann D, Bhadra N, Kilgore K. Counted Cycles Method to Quantify the Onset Activity in High-Frequency Peripheral Nerve Block. Proceedings of International Conf of the IEEE EMBS. 2009:614–617. doi: 10.1109/IEMBS.2009.5332758. [DOI] [PubMed] [Google Scholar]
- 3.Bugnard L, Hill A. The Effect of Frequency of Excitation on the Total Electric Response of Medullated Nerve. J Physiol. 1935;83:394–406. doi: 10.1113/jphysiol.1935.sp003237. [DOI] [PMC free article] [PubMed] [Google Scholar]
- 4.Cattel M, Gerard R. The inhibitory effect of high-frequency stimulation and the excitation state of the nerve. The Journal of Physiology. 1935;83:407–415. doi: 10.1113/jphysiol.1935.sp003238. [DOI] [PMC free article] [PubMed] [Google Scholar]
- 5.Wedensky N. Die Erregung, Hemmung und Narkose. Pfluger’s Arch. 100:1903. [Google Scholar]
- 6.Woo MY, Campbell B. Asynchronous Firing and Block of Peripheral Nerve Conduction by 20 kC Alternating Current. Bull Los Angel Neuro Soc. 1964;29:87. [PubMed] [Google Scholar]
- 7.Bowman B, McNeal D. Response of Single Alpha Motorneurons to High-Frequency Pulse Trains. Appl Neurophysiol. 1986;49:121–138. doi: 10.1159/000100137. [DOI] [PubMed] [Google Scholar]
- 8.Bowman B. Electrical Engineering. Ljubljana, Yugoslavia: University of Ljubljana; 1981. Electrical Block of Peripheral Motor Activity; p. 272. vol. Doctor of Science. [Google Scholar]
- 9.Gerges M, Foldes E, Ackermann D, Bhadra N, Bhadra N, Kilgore K. Frequency and amplitude transitioned waveforms mitigate the onset response in high frequency nerve block. J Neural Eng. 2010;7 doi: 10.1088/1741-2560/7/6/066003. [DOI] [PMC free article] [PubMed] [Google Scholar]
- 10.Ackermann D, Foldes E, Bhadra N, Kilgore K. Peripheral Nerve Block Using Combined High Frequency Alternating and Direct Currents for Mitigation of Onset Firing. Medical and Biological Engineering and Computing. 2010 doi: 10.1007/s11517-010-0679-x. vol. In Press. [DOI] [PMC free article] [PubMed] [Google Scholar]
- 11.Ackermann D, Foldes E, Bhadra N, Kilgore K. Nerve Block Using Combined Thermoelectric Cooling and High Frequency Alternating Current: Electrical Block Without Onset Response. J Neuroscience Methods. 2010;193:72–76. doi: 10.1016/j.jneumeth.2010.07.043. [DOI] [PMC free article] [PubMed] [Google Scholar]
- 12.Ackermann D, Foldes E, Bhadra N, Kilgore K. Effect of Bipolar Cuff Electrode Design on Block Thresholds in High Frequency Electrical Neural Conduction Block. IEEE Transactions on Neural Systems and Rehabilitation Engineering. 2009;17:469–477. doi: 10.1109/TNSRE.2009.2034069. [DOI] [PMC free article] [PubMed] [Google Scholar]
- 13.Ackermann D, Foldes E, Bhadra N, Kilgore K. Conduction block of peripheral nerve using high frequency alternating currents delivered through an intrafascicular electrode. Muscle and Nerve. 2010;41:117–119. doi: 10.1002/mus.21496. [DOI] [PMC free article] [PubMed] [Google Scholar]
- 14.Bhadra N, Bhadra N, Kilgore K, Gustafson KJ. High frequency electrical conduction block of the pudendal nerve. Journal of Neural Engineering. 2006;3:180. doi: 10.1088/1741-2560/3/2/012. [DOI] [PMC free article] [PubMed] [Google Scholar]
- 15.Bhadra N, Kilgore KL. High-frequency electrical conduction block of mammalian peripheral motor nerve. Muscle and Nerve. 2005;32:782. doi: 10.1002/mus.20428. [DOI] [PubMed] [Google Scholar]
- 16.Joseph L, Butera RJ. Unmyelinated Aplysia nerves exhinit a non monotonic blocking response to high frequency stimulation. IEEE Transactions on Neural Systems and Rehabilitation Engineering. 2009;17:537–544. doi: 10.1109/TNSRE.2009.2029490. [DOI] [PubMed] [Google Scholar]
- 17.Gaunt R, Prochazka A. Transcutaneously coupled, high-frequency electrical stimulation of the pudendal nerve blocks external urethral sphincter contractions. Neurorehabil Neural Repair. 2009;23:615. doi: 10.1177/1545968308328723. [DOI] [PubMed] [Google Scholar]
- 18.Miles JD, Kilgore K, Bhadra N, Lahowetz E. Effects of ramped amplitude waveforms on the onset response of high-frequency mammalian nerve block. Journal of Neural Engineering. 2007;4:390. doi: 10.1088/1741-2560/4/4/005. [DOI] [PubMed] [Google Scholar]
- 19.Rosenblueth A, Reboul J. The Blocking and Deblocking Effects of Alternating Currents on Nerve. Am J Physiol. 1939;125:251–264. [Google Scholar]
- 20.Tai C, Roppolo JR, de Groat WC. Block of external Urethral Sphincter Contraction by High Frequency Electrical Stimulation of Pudendal Nerve. The Journal of Urology. 2004;172:2069–2072. doi: 10.1097/01.ju.0000140709.71932.f0. [DOI] [PubMed] [Google Scholar]
- 21.Williamson RP, Andrews BJ. Localized electrical nerve blocking. IEEE Transactions on Biomedical Engineering. 2005;52:362. doi: 10.1109/TBME.2004.842790. [DOI] [PubMed] [Google Scholar]
- 22.Ackermann D, Ethier C, Foldes E, Oby E, Tyler D, Bauman M, Bhadra N, Miller L, Kilgore K. Electrical Conduction Block in Large Nerves: High Frequency Current Delivery in the Nonhuman Primate. Muscle and Nerve. 2011 doi: 10.1002/mus.22037. vol. Online Preprint. [DOI] [PMC free article] [PubMed] [Google Scholar]
- 23.Ackermann D, Bhadra N, Foldes E, Kilgore K. Effect of Nerve Cuff Electrode Geometry on Onset Response Firing in Conduction Block of Whole Nerve Using High Frequency Alternating Currents. IEEE Transactions on Neural Systems and Rehabilitation Engineering. 2010 doi: 10.1109/TNSRE.2010.2071882. vol. In Press, online. [DOI] [PMC free article] [PubMed] [Google Scholar]
- 24.Tai Simulation of nerve block by high-frequency sinusoidal electrical current based on the Hodgkin-Huxley model. IEEE Transactions on Neural Systems and Rehabilitation Engineering. 2005;13:415. doi: 10.1109/TNSRE.2005.847356. [DOI] [PubMed] [Google Scholar]
- 25.Bhadra N, Lahowetz E, Foldes S, Kilgore K. Simulation of high-frequency sinusoidal electrical block of mammalian myelinated axons. J Comput Neurosci. 2007;22:313–326. doi: 10.1007/s10827-006-0015-5. [DOI] [PubMed] [Google Scholar]
- 26.Xu Z, Roppolo JR, de Groat WC, Changfeng T. Mechanism of Nerve Conduction Block Induced by High-Frequency Biphasic Electrical Currents. Biomedical Engineering, IEEE Transactions on. 2006;53:2445–2454. doi: 10.1109/TBME.2006.884640. [DOI] [PMC free article] [PubMed] [Google Scholar]
- 27.Wang Influence of frequency and temperature on the mechanisms of nerve conduction block induced by high-frequency biphasic electrical current. Journal of Computational Neuroscience. 2008;24:195. doi: 10.1007/s10827-007-0050-x. [DOI] [PMC free article] [PubMed] [Google Scholar]
- 28.Hailong L, Roppolo JR, de Groat WC, Tai C. The Role of Slow Potassium Current in Nerve Conduction Block Induced by High-Frequency Biphasic Electrical Current. Biomedical Engineering, IEEE Transactions on. 2009;56:137–146. doi: 10.1109/TBME.2008.2006013. [DOI] [PMC free article] [PubMed] [Google Scholar]
- 29.Xu Z, Roppolo JR, de Groat WC, Changfeng T. Simulation analysis of conduction block in myelinated axons induced by high-frequency biphasic rectangular pulses. Biomedical Engineering, IEEE Transactions on. 2006;53:1433–1436. doi: 10.1109/tbme.2006.873689. [DOI] [PubMed] [Google Scholar]
- 30.Tai C, de Groat WC, Roppolo JR. Simulation analysis of conduction block in unmyelinated axons induced by high-frequency biphasic electrical currents. Biomedical Engineering, IEEE Transactions on. 2005;52:1323–1332. doi: 10.1109/tbme.2005.847561. [DOI] [PMC free article] [PubMed] [Google Scholar]
- 31.Haeffele BD, Butera RJ. Modifying the Hodgkin-Huxley Model for High Frequency AC Stimulation. presented at Neural Engineering, 2007. CNE ‘07. 3rd International IEEE/EMBS Conference on; 2007. [DOI] [PubMed] [Google Scholar]
- 32.Bromm Spike frequency of the nodal membrane generated by high-frequency alternating current. Pfl. 1975;353:1. doi: 10.1007/BF00584507. [DOI] [PubMed] [Google Scholar]
- 33.Camilleri M, Toouli J, Herrera MF, Kow L, Pantoja JP, Billington CJ, Tweden KS, Wilson RR, Moody FG. Selection of electrical algorithms to treat obesity with intermittent vagal block using an implantable medical device. Surgery for obesity and related diseases: official journal of the American Society for Bariatric Surgery. 2009;5:224. doi: 10.1016/j.soard.2008.09.006. [DOI] [PubMed] [Google Scholar]
- 34.Boger A, Bhadra N, Gustafson KJ. Bladder voiding by combined high frequency electrical pudendal nerve block and sacral root stimulation. Neurourology and Urodynamics. 2008;27:435. doi: 10.1002/nau.20538. [DOI] [PubMed] [Google Scholar]
- 35.ElBasiouny SM, Mushahwar VK. Modulation of motoneuronal firing behavior after spinal cord injury using intraspinal microstimulation current pulses: a modeling study. J Appl Physiol. 2007;103:276–286. doi: 10.1152/japplphysiol.01222.2006. [DOI] [PubMed] [Google Scholar]
- 36.Chaitman BR, Pepine CJ, Parker JO, Skopal J, Chumakova G, Kuch J, Wang W, Skettino SL, Wolff AA. Effects of Ranolazine With Atenolol, Amlodipine, or Diltiazem on Exercise Tolerance and Angina Frequency in Patients With Severe Chronic Angina: A Randomized Controlled Trial. JAMA. 2004;291:309–316. doi: 10.1001/jama.291.3.309. [DOI] [PubMed] [Google Scholar]
- 37.Casey GP, Roberts JS, Paul D, Diamond I, HJ G., III Ranolazine Attenuation of CFA-induced Mechanical Hyperalgesia. Pain Medicine. 2010;11:119–126. doi: 10.1111/j.1526-4637.2009.00763.x. [DOI] [PubMed] [Google Scholar]
- 38.Sridharan R, Nesrine E-B, John CS, Jonathan CM, Luiz B. Use-dependent block of cardiac late Na+ current by ranolazine. Heart rhythm: the official journal of the Heart Rhythm Society. 2009;6:1625–1631. doi: 10.1016/j.hrthm.2009.07.042. [DOI] [PMC free article] [PubMed] [Google Scholar]
- 39.Rajamani S, Shryock J, Belardinelli L. Block of tetrodotoxin-sensitive, Nav 1.7, and tetrodotoxinresistant, Nav 1.8, Na+ channels by ranolazine. Channels. 2008;2:449–460. doi: 10.4161/chan.2.6.7362. [DOI] [PubMed] [Google Scholar]
- 40.Belardinelli L, Shryock JC, Fraser H. Inhibition of the late sodium current as a potential cardioprotective principle: effects of the late sodium current inhibitor ranolazine. Heart. 2006;92:iv6–iv14. doi: 10.1136/hrt.2005.078790. [DOI] [PMC free article] [PubMed] [Google Scholar]
- 41.Redman S, Lampard D. Monosynaptic stochastic stimulation of cat spinal motoneurons II. Frequency Transfer Characteristics. J Neurophysiol. 1968;31:499–508. doi: 10.1152/jn.1968.31.4.499. [DOI] [PubMed] [Google Scholar]
- 42.Redman S, Lampard D. Monosynaptic stochastic stimulation of cat spinal motoneurons I. Response of motoneurons to sustained stimulation. J Neurophysiol. 1968;31:485–498. doi: 10.1152/jn.1968.31.4.485. [DOI] [PubMed] [Google Scholar]
- 43.Lloyd D. Monosynaptic reflex response of individual motoneurons as a function of frequency. J Gen Physiol. 1956;40:435–450. doi: 10.1085/jgp.40.3.435. [DOI] [PMC free article] [PubMed] [Google Scholar]
- 44.Hines ML, Carnevale NT. The NEURON Simulation Environment. Neural Computation. 1997;9:1179. doi: 10.1162/neco.1997.9.6.1179. [DOI] [PubMed] [Google Scholar]
- 45.Carnevale NT, Hines ML. The NEURON Book. United Kingdom: Cambridge University Press; 2006. [Google Scholar]
- 46.McIntyre CC, Richardson AG, Grill WM. Modeling the excitability of mammalian nerve fibers: influence of afterpotentials on the recovery cycle. Journal of Neurophysiology. 2002;87:995. doi: 10.1152/jn.00353.2001. [DOI] [PubMed] [Google Scholar]
- 47.Hodgkin AL, Huxley AF. A quantitative description of membrane current and its application to conduction and excitation in nerve. The Journal of physiology. 1952;117:500. doi: 10.1113/jphysiol.1952.sp004764. [DOI] [PMC free article] [PubMed] [Google Scholar]
- 48.Richardson AG, McIntyre CC, Grill WM. Modelling the effects of electric fields on nerve fibres: influence of the myelin sheath. Medical and Biological Engineering and Computing. 2000;38:438. doi: 10.1007/BF02345014. [DOI] [PubMed] [Google Scholar]
- 49.Schiefer A Model of Selective Activation of the Femoral Nerve With a Flat Interface Nerve Electrode for a Lower Extremity Neuroprosthesis. IEEE Transactions on Neural Systems and Rehabilitation Engineering. 2008;16:195. doi: 10.1109/TNSRE.2008.918425. [DOI] [PMC free article] [PubMed] [Google Scholar]
- 50.Bellinger Submyelin potassium accumulation may functionally block subsets of local axons during deep brain stimulation: a modeling study. Journal of Neural Engineering. 2008;5:263. doi: 10.1088/1741-2560/5/3/001. [DOI] [PubMed] [Google Scholar]
- 51.Aldridge BB, Burke JM, Lauffenburger DA, Sorger PK. Physicochemical modelling of cell signalling pathways. Nature Cell Biology. 2006;8:1195. doi: 10.1038/ncb1497. [DOI] [PubMed] [Google Scholar]
- 52.Hwang H, Arcidi JM, Hale SL, Simkhovich BZ, Belardinelli L, Dhalla AK, Shryock JC, Kloner RA. Ranolazine as an Adjunct to Cardioplegia: A Potential New Therapeutic Application. Journal of Cardiovascular Pharmacology and Therapeutics. 2009;14:125–133. doi: 10.1177/1074248409333491. [DOI] [PubMed] [Google Scholar]
- 53.Dhalla AK, Wang W-Q, Dow J, Shryock JC, Belardinelli L, Bhandari A, Kloner RA. Ranolazine, an antianginal agent, markedly reduces ventricular arrhythmias induced by ischemia and ischemia-reperfusion. Am J Physiol Heart Circ Physiol. 2009;297:H1923–1929. doi: 10.1152/ajpheart.00173.2009. [DOI] [PubMed] [Google Scholar]
- 54.Foldes E, Ackermann D, Bhadra N, Kilgore K, Bhadra N. Design, fabrication and evaluation of a conforming circumpolar peripheral nerve cuff electrode for acute experimental use. J Neuroscience Methods. 2011;196:31–37. doi: 10.1016/j.jneumeth.2010.12.020. [DOI] [PMC free article] [PubMed] [Google Scholar]
- 55.Gould HJI, Garrett C, Donahue RR, Paul D, Diamond I, Taylor BK. Ranolazine attenuates behavioral signs of neuropathic pain. Behavioural Pharmacology. 2009;20:755–758. doi: 10.1097/FBP.0b013e3283323c90. [DOI] [PMC free article] [PubMed] [Google Scholar]
- 56.Frankenhaeuser B. The after-effects of impulses in the giant nerve fibres of Loligo. Journal of Physiology (Paris) 1956;131:341. doi: 10.1113/jphysiol.1956.sp005467. [DOI] [PMC free article] [PubMed] [Google Scholar]
- 57.Jensen ADD. High frequency stimulation can block axonal conduction. Experimental Neurology. 2009;220:57. doi: 10.1016/j.expneurol.2009.07.023. [DOI] [PMC free article] [PubMed] [Google Scholar]
- 58.Bellinger SMG, Steinmetz P. Submyelin potassium accumulation may functionally block subsets of local axons during deep brain stimulation: a modeling study. Journal of Neural Engineering. 2008;5:263. doi: 10.1088/1741-2560/5/3/001. [DOI] [PubMed] [Google Scholar]


