

Abstract
BACKGROUND AND PURPOSE
Developmental switches in NMDA receptor subunit expression have been inferred from studies of GluN2 expression levels, changes in kinetics of glutamatergic synaptic currents and sensitivity of NMDA receptor-mediated currents to selective GluN2B antagonists. Here we use TCN 213, a novel GluN2A-selective antagonist to identify the presence of this subunit in functional NMDA receptors in developing cortical neurones.
EXPERIMENTAL APPROACH
Two-electrode voltage-clamp (TEVC) recordings were made from Xenopus laevis oocytes to determine the pharmacological activity of TCN 213 at recombinant NMDA receptors. TCN 213 antagonism was studied in cultures of primary cortical neurones, assessing the NMDA receptor dependency of NMDA-induced excitotoxicity and monitoring developmental switches in NMDA receptor subunit composition.
KEY RESULTS
TCN 213 antagonism of GluN1/GluN2A NMDA receptors was dependent on glycine but independent of glutamate concentrations in external recording solutions. Antagonism by TCN 213 was surmountable and gave a Schild plot with unity slope. TCN 213 block of GluN1/GluN2B NMDA receptor-mediated currents was negligible. In cortical neurones, at a early developmental stage predominantly expressing GluN2B-containing NMDA receptors, TCN 213 failed to antagonize NMDA receptor-mediated currents or to prevent GluN2B-dependent, NMDA-induced excitoxicity. In older cultures (DIV 14) or in neurones transfected with GluN2A subunits, TCN 213 antagonized NMDA-evoked currents. Block by TCN 213 of NMDA currents inversely correlated with block by ifenprodil, a selective GluN2B antagonist.
CONCLUSIONS AND IMPLICATIONS
TCN 213 selectively blocked GluN1/GluN2A over GluN1/GluN2B NMDA receptors allowing direct dissection of functional NMDA receptors and pharmacological profiling of developmental changes in native NMDA receptor subunit composition.
Keywords: NMDA, glutamate, glycine, antagonism, oocyte, two-electrode voltage clamp, electrophysiology, neurotoxicity, development
Introduction
NMDA receptors are a subclass of ligand-gated ion channels activated by the CNS excitatory neurotransmitter l-glutamate (receptor nomenclature follows Alexander et al. 2011). In addition to their fundamental role in mediating the slow component of the glutamatergic excitatory postsynaptic potential/current, these receptors play pivotal roles in CNS development, learning and memory and pathophysiology. NMDA receptors are tetrameric proteins, the majority of which comprise two GluN1 and two GluN2 subunits (see Erreger et al., 2004, Chen and Wyllie, 2006; Traynelis et al., 2010). The GluN1 subunit exists in eight isoforms that are generated by alternative splicing of exons 5, 21 and 22 (Sugihara et al., 1992) while GluN2A-D subunits are encoded by four separate genes (Monyer et al., 1992). Uniquely among the family of glutamate ionotropic receptors, NMDA receptors require both glutamate and glycine (a co-agonist) to bind to the receptor for channel activation to occur (Figure S1A; Johnson and Ascher, 1987; Kleckner and Dingledine, 1988) with the glycine binding site being formed by the S1 and S2 domains of the GluN1 subunit and glutamate binding site being formed from the homologous regions on the GluN2 subunit. GluN2 subunit expression is regulated both spatially and temporally (Monyer et al., 1994), and it is the identity of the GluN2 subunits contained within the tetrameric NMDA receptor complex that determines many of the distinct biophysical and pharmacological properties of NMDA receptor subtypes (see Erreger et al., 2004, Chen and Wyllie, 2006; Traynelis et al., 2010).
The obligatory requirement of agonist and co-agonist binding for NMDA receptor activation means that the function of these receptors can be blocked by antagonists that act either at the glycine (GluN1-located) site or at the glutamate (GluN2-located) site. A few NMDA receptor subtype selective antagonists already exist: non-competitive antagonists such as ifenprodil (Williams, 1993), R-(R*,S*)-α-(4-hydroxyphenyl)-β-methyl-4-(phenylmethyl)-1-piperidine propranol (Ro 25–6981; Fischer et al., 1997) and (1S,2S)-1-(4-hydroxyphenyl)-2-(4-hydroxy-4-phenylpiperidino)-1-propanol (CP 101 606; Mott et al., 1998) display a selectivity for GluN1/GluN2B NMDA receptors over other heterodimeric NMDA receptor combinations that is enough to allow these antagonists to be used to probe effectively NMDA receptor subunit composition and function in native neurones. However an antagonist that selectively blocks the GluN1/GluN2A receptor combination while sparing other NMDA receptor subtypes is lacking. Although (R)-[(S)-1-(4-bromo-phenyl)-ethylamino]-(2,3-dioxo-1,2,3,4-tetrahydroquinoxalin-5-yl)-methyl]-phosphonic acid (NVP-AAM077; Auberson et al., 2002) shows increased potency at GluN2A- over GluN2B-containing NMDA receptors, the difference in the respective equilibrium constants is not enough for this antagonist to discriminate unambiguously between these two receptor combinations (Frizelle et al., 2006; Wyllie and Chen, 2007).
A recent study by Bettini et al. (2010) identified a series of novel NMDA receptor receptor antagonists from a chemical library of around two million compounds using high-throughput screening methods. One of their ‘hits’, N-(cyclohexylmethyl)-2-({5-[(phenylmethyl)amino]-1,3,4-thiadiazol-2-yl}thio)acetamide (Figure S1B), referred to as Compound 13 in their study and now named ‘TCN 213’ by Tocris Bioscience, was shown to preferentially block GluN2A-containing over GluN2B-containing NMDA receptors. Their study demonstrated that antagonism by this compound could be reversed by increasing glycine but not glutamate concentrations, suggesting that this antagonist acted at the GluN1 subunit. This observation in itself raises the notion that the nature of the interaction of GluN1 and GluN2 subunits in tetrameric NMDA receptor complexes may be dependent on the identity of the GluN2 subunit and may confer distinct pharmacology to the GluN1 subunit. Indeed, this type of GluN2-dependent pharmacology for agonists acting at the GluN1 subunit has been reported (Chen et al., 2008). However, in a binding assay, TCN 213 failed to displace the GluN1 ligand MDL 105 519, raising the possibility that TCN 213 acts at a site on the GluN1 subunit that is distinct from the glycine binding site itself. In addition no assessment has been made of the ability of TCN 213 to antagonize NMDA receptor-mediated currents using electrophysiological recording techniques. Moreover, assessment of the potency of TCN 213 acting at GluN2A- and GluN2B-containing NMDA receptors under conditions where both receptors are activated to a similar extent is lacking.
Our study assessed the conditions under which TCN 213 displayed selective antagonism of GluN2A-containing NMDA receptors and extended the investigation to the study of native NMDA receptors in cortical neurones to assess the action of TCN 213 on NMDA-evoked currents and NMDA-evoked excitotoxic neuronal cell death. Furthermore, we demonstrated that TCN 213 allowed direct pharmacological assessment of the expression of GluN2A subunits in developing cortical neurones in dissociated culture. Our data indicate that this antagonist and its related sulphonamide derivatives (Bettini et al., 2010) provide promising novel pharmacological tools to investigate NMDA receptor function and permit new opportunities to monitor developmental changes in native NMDA receptor subunit composition.
Methods
Plasmid constructs, cRNA synthesis and receptor expression in oocytes
Nomenclature of NMDA receptor subunits follows Collingridge et al. (2009) and Alexander et al. (2011). The expression plasmids for rat GluN1-1a (excluding exon 5, including exons 21 and 22, and referred to here as ‘GluN1’) and GluN2A subunits have been described previously (Chen et al., 2005). The cDNA construct containing the rat GluN2B subunit was a gift from Dr Stephen Traynelis (Emory University, Atlanta, GA). cRNA for each of the NMDA receptor subunits was synthesized as run-off transcripts as described previously (Chen et al., 2005; 2008; Erreger et al., 2007). cRNA amounts and integrity were estimated by intensity of fluorescence in ethidium bromide-stained agarose gels. GluN1 and GluN2 cRNAs were mixed at a nominal ratio of 1:1 and diluted with nuclease-free water to 5 ng·µL−1, prior to injection.
All animal care and experimental procedures complied with current UK Home Office regulations. Stage V–VI oocytes were obtained from Xenopus laevis that had been anaesthetized by immersion in a solution of 3-amino-benzoic acid ethylester (0.5%) and then killed by injection of an overdose of pentobarbital (0.4 mL of 20% solution) followed by decapitation and exsanguination after the confirmation of loss of cardiac output. Before injection with cRNA mixtures of interest, the follicular membranes of the oocytes were removed. After injection oocytes were placed in separate wells of 24-well plates containing a modified Barth's solution with the following composition (in mM): NaCl 88, KCl 1, NaHCO3 2.4, MgCl2 0.82, CaCl2 0.44, Ca(NO3)2 0.33, Tris–Cl 15, adjusted to pH 7.35 with NaOH (Sigma-Aldrich, Poole, UK). This solution was supplemented with 50 IU·mL−1 penicillin, 50 µg·mL−1 streptomycin (Invitrogen, Paisley, UK) and. 50 µg·mL−1 tetracycline (Sigma-Aldrich). Oocytes were placed in an incubator (19°C) for 24–48 h to allow for receptor expression and then stored at 4°C until required for electrophysiological measurements.
Culture of rat cortical neurones
Cortical neurones from E21 Sprague–Dawley rat embryos were cultured as described previously (Bading and Greenberg, 1991; Papadia et al., 2008; Martel et al., 2009), except that the Neurobasal-A growth medium contained B27 (Invitrogen), 1% rat serum (Harlan UK Ltd., Oxon, UK) and 1 mM glutamine. On the 4th day of culture (DIV 4), 1 mL growth medium containing 9.6 µM cytosine β-d-arabinofuranoside hydrochloride (AraC) was added to each well to inhibit glial cell proliferation. Culture media were replenished every 2 days after DIV 9 by replacing 1 mL of the conditioned media with 1 mL of fresh growth medium that lacked rat serum but was supplemented with glucose (10 mM). Prior to the excitotoxicity assay the cultures were transferred from the growth medium to a non-trophic medium that lacked glycine. This non-trophic medium contained 10% MEM (Invitrogen) and a glycine-free salt-glucose medium (in mM): NaCl 114, KCl 5.3, MgCl2 1, CaCl2 2, HEPES 10, glucose 30, Na-pyruvate 0.5 with NaHCO3 (0.2%) and phenol red (0.1%).
Transfection of cortical neurones
Neurones were transfected between DIV 5–9 using Lipofectamine 2000 (Invitrogen) according to the manufacturer's suggested protocol. β-globin or pCis-GluN2A (Rutter and Stephenson, 2000) were co-transfected with enhanced green fluorescent protein (eGFP), to identify transfected cells, in a ratio of 2:1. Transfection efficiency was approximately 5% with >99% of eGFP-expressing cells being identified as positive for the neuronal nuclear antigen (NeuN), while <1% were positive for glial fibrillary acidic protein (GFAP) (Soriano et al., 2008). Electrophysiological recordings were made from transfected neurones 48 h post transfection.
Electrophysiological recordings and solutions
Two-electrode voltage-clamp (TEVC) recordings were made at room temperature (18–21°C) using a GeneClamp 500 (Molecular Devices, Sunnyvale, CA) from oocytes that were placed in a solution that contained (in mM) NaCl 115, KCl 2.5, HEPES 10, BaCl2 1.8, EDTA 0.01; pH 7.3 with NaOH. EDTA was included to chelate contaminating low nanomolar levels of Zn2+ present in our solutions, which cause a potent but voltage-independent block of GluN2A-containing NMDA receptors. Current and voltage electrodes were made from thin-walled borosilicate glass (GC150TF-7.5, Harvard Apparatus, Kent, UK) using a PP-830 electrode puller (Narashige Instruments, Tokyo, Japan) and, when filled with 0.3 M KCl, possessed resistances of between 1 and 2 MΩ. Oocytes were voltage-clamped at −40 mV. Application of solutions was controlled manually, and data were filtered at 10 Hz and digitized at 100 Hz via a Digidata 1200 A/D interface (Molecular Devices) using WinEDR software (Strathclyde Electrophysiology Software, Strathclyde University, UK).
Whole-cell NMDA-evoked currents in cultured rat cortical neurones were recorded using an Axopatch 200B amplifier (Molecular Devices) using patch pipettes made from thick-walled borosilicate glass with a tip resistance of 4–8 MΩ, which were filled with an ‘internal’ solution that contained (in mM) potassium gluconate 141, NaCl 2.5, HEPES 10, EGTA 11; pH 7.3 with KOH. Experiments were conducted at room temperature (18–21°C) in an ‘external’ solution containing (in mM): NaCl 150, KCl 2.8, HEPES 10, CaCl2 2, glucose 10, EDTA 0.01; pH to 7.3 with NaOH. Picrotoxin (50 µM) and tetrodotoxin (300 nM) were included to block GABAA receptor-mediated responses and action potential-driven excitatory/inhibitory postsynaptic events respectively. Access resistances (17.9 ± 1.1 MΩ) were monitored and, recordings where this changed by >20% were discarded. Currents were filtered at 2 kHz and digitized at 5 kHz via a BNC-2090A/PCI-6251 DAQ board interface (National Instruments, Austin, TX) and analysed using WinEDR software (Dr John Dempster, University of Strathclyde, Glasgow, UK).
Assessment of antagonist potencies
Concentrations of TCN 213 and 5,7 dichlorokynurenic acid (5,7 DCKA) required to inhibit 50% (IC50) of agonist-evoked responses were determined by fitting inhibition curves with the following equation:
where nH is the Hill coefficient, I[B]0 is the predicted current in the absence of antagonist and [B] is the concentration of the antagonist. Each data point was then normalized to the predicted maximum of the dose–response curve. These normalized values were then pooled and averaged for each construct and fitted again with this same equation, with the maximum and minimum for each curve being constrained to asymptote to 1 and 0 respectively (Wrighton et al., 2008; Otton et al., 2011). We estimated the equilibrium constant (KB) for TCN 213 acting at GluN1/GluN2A NMDA receptors using the Schild method (Arunlakshana and Schild, 1959; Wyllie and Chen, 2007). Briefly, dose ratios (r) from individual oocytes were determined at low agonist concentrations by constructing a partial concentration–response curve generated in the absence of antagonist and in the presence of a series of increasing antagonist concentrations. Each series of two-point concentration–response curves were plotted on a log–log scale, and each data set was fitted with a straight line with the same slope. These parallel fits were used to calculate an overall mean r-value for each antagonist concentration (3, 10 and 30 µM), which were then used to construct a Schild plot (Frizelle et al., 2006; Otton et al., 2011; Figure S2). For technical reasons, the dose ratio estimate for the highest concentration of TCN 213 (30 µM) had to be determined in a separate set of experiments from those carried out for the lower two concentrations (3 and 10 µM).
NMDA-induced excitotoxicity assay
To assess NMDA-induced cell death, neurones were exposed to NMDA (40 µM + glycine, 1.5 µM) for 1 h in the absence or presence of either ifenprodil (3 µM), 5,7 DCKA (10 µM) or TCN 213 (10 µM). Exposure to excitotoxic concentrations of NMDA leads to neurones displaying swollen cell bodies and pyknotic nuclei with small irregular chromatin inclusions. Such characteristics are indicative of necrotic, as opposed to apopotic, cell death (Fujikawa et al., 2000; Hardingham et al., 2002). Assessment of cell death was made 24 h after exposure to NMDA by calculating the ratio of 4′, 6-diamidino-2-phenyl indole-stained pyknotic nuclei as a percentage of the total nuclei.
Statistical analysis
Results are presented as mean ± SEM, and statistical comparison between data sets was assessed using either Student's t-test (paired where appropriate) or anova tests to determine whether differences between mean values were significant (P < 0.05). Microcal Origin v6.0 software (Microcal, Northampton, MA, USA) was used for graphical presentation.
Materials
Glutamate and glycine were purchased from Sigma-Aldrich. N-(cyclohexylmethyl)-2-({5-[(phenylmethyl)amino]-1,3,4-thiadiazol-2-yl}thio)acetamide (TCN 213) was originally purchased from Enamine (Kiev, Ukraine) and subsequently from Tocris Bioscience (Bristol, UK). 5,7 DCKA, N-methyl-d-aspartate, ifenprodil, picrotoxin and tetrodotoxin were purchased from Tocris Bioscience. Stock solutions of TCN 213 were made by dissolving the antagonist in DMSO. We confirmed in a series of preliminary experiments that DMSO at the highest final concentration present in our experiments (0.3%) did not have any effect on the magnitude of NMDA receptor-mediated responses (data not shown).
Results
Antagonism of NMDA receptor-mediated responses by TCN 213 is dependent on glycine concentration
The study of Bettini et al. (2010) suggested that the antagonist action of TCN 213 was in part mediated by inhibition of glycine binding at NMDA receptors. In order to assess this, we conducted a series of initial experiments to determine whether the extent of the antagonism produced by TCN 213 was dependent on the concentration of glycine and/or glutamate used to evoke NMDA receptor-mediated currents. Figure 1A (upper panel) shows a series of representative TEVC current traces obtained from an oocyte expressing GluN1/GluN2A NMDA receptors in response to application of glutamate (100 µM) and three different concentrations of glycine (0.1, 1 and 10 times its EC50 value; Chen et al., 2008). As can be seen from the traces, the extent of the block produced by TCN 213 (10 µM) was dependent on the glycine concentration. Almost complete block of the current was seen when glycine is present at 150 nM (0.1 × EC50), whereas substantially less block was seen when glycine is present at 15 µM (10 × EC50). Mean data, indicating the extent of the block of steady-state responses, from a series of similar experiments (n= 6) are illustrated in Figure 1C. In contrast and as illustrated in the lower panel of Figure 1A, TCN 213 antagonism was not dependent on the glutamate concentration used to evoke NMDA receptor-mediated currents. In these experiments, glutamate was applied at concentrations again corresponding to 0.1, 1 and 10 times its EC50 value (Erreger et al., 2007), while glycine (50 µM) was present at a maximal concentration. Mean data from a series of experiments (n= 6) examining the effect of glutamate concentration are illustrated in Figure 1D. The extent of the inhibition produced by TCN 213 was not significantly different for any of the glutamate concentrations (F2,15= 0.76, P= 0.48; one-way anova).
Figure 1.

TCN 213 antagonism of NMDA receptor-mediated responses is both subtype- and glycine-dependent. (A) Upper panel, TEVC currents recorded from an oocyte expressing GluN1/GluN2A NMDA receptors in response to application of glutamate (100 µM) and glycine, which was applied at a concentration indicated as a multiple of its EC50 value (1.5 µM for GluN1/GluN2A NMDA receptors). TCN 213 (10 µM) was applied as indicated and inhibited the glutamate/glycine evoked response, but the extent of the inhibition was dependent on the glycine concentration. Lower panel, a series of similar TEVC current traces but recorded in the presence of a saturating concentration of glycine (50 µM) and variable concentrations of glutamate. The extent of the inhibition produced by TCN 213 is similar in each case. (B) A series of representative TEVC current traces illustrating similar experiments to those shown in panel A but for recordings made from oocytes expressing GluN1/GluN2B NMDA receptors. Note here the modest inhibition produced by TCN 213. (C) Bar graphs summarizing the mean data obtained from a series of experiments (n= 6) that investigated the glycine dependency of TCN 213 antagonism of steady-state responses at both GluN1/GluN2A and GluN1/GluN2B NMDA receptors. (D) As in panel C but for experiments where the glycine concentration was fixed (50 µM) and glutamate was applied at 0.1, 1 and 10 times its EC50 concentration. Calibration bars for TEVC traces illustrated in panels A and B: 750 nA, 50 s.
Next we carried out the same two sets of experiments as described above but recording from oocytes expressing GluN1/GluN2B NMDA receptors. As it exemplified by the upper panel in Figure 1B, TCN 213 (10 µM) only modestly antagonized responses even when the glycine concentration was low (0.1 × EC50 value) with the mean data from a series of similar experiments (n= 6) plotted next to the corresponding GluN1/GluN2A dataset in the bar graph illustrated in Figure 1C. For GluN2B-containing NMDA receptors, the extent of the inhibition produced by TCN 213 is not significantly different for any of these glycine concentrations (F2,15= 0.74, P= 0.49; one-way anova). In addition, in the presence of 50 µM glycine, no antagonism by TCN 213 was observed at three different glutamate concentrations (Figure 1B, lower panel, Figure 1D).
IC50 values for TCN 213 and 5,7 DCKA acting at GluN1/GluN2A and GluN1/GluN2B NMDA receptors
The experiments illustrated in Figure 1 each examined the effects of TCN 213 at a fixed concentration (10 µM). In order to quantify its antagonist potency at GluN2A- and GluN2B-containing NMDA receptors, we carried out a series of experiments to determine concentrations of TCN 213 that produced 50% inhibition (IC50 values) of glutamate/glycine evoked currents. For comparison, we calculated comparable values for the prototypical glycine-site antagonist, 5,7 DCKA. As IC50 values are dependent on the agonist concentration (see Wyllie and Chen, 2007), we again used equipotent concentrations of glycine based on its EC50 value when acting at GluN1/GluN2A and GluN1/GluN2B NMDA receptors (Chen et al., 2008). Thus, for GluN2A-containing NMDA receptors, IC50 values were determined at 0.15, 1.5 and 15 µM glycine (+100 µM glutamate) representing 0.1, 1 and 10 times its EC50 value respectively. Mean inhibition curves for TCN 213 acting at GluN1/GluN2A NMDA receptors are illustrated in Figure 2A. As is to be expected, the IC50 values for TCN 213 (Table 1) increased with increasing glycine concentrations for GluN1/GluN2A NMDA receptors. However, for GluN1/GluN2B NMDA receptors (Figure 2B), we observed negligible inhibition of currents when glycine was applied at 1 and 10 times its EC50 value even when TCN 213 was applied at 30 µM. Indeed, we were unable to determine an IC50 value even for the lowest glycine concentration applied (75 nM = 0.1 × EC50). Thus, TCN 213 appears to preferentially block GluN1/GluN2A over GluN1/GluN2B NMDA receptors and inasmuch as our data can be compared with the high-throughput screening assays reported previously, this antagonist does discriminate effectively between GluN2A- and GluN2B-containing NMDA receptors (Bettini et al., 2010). In direct comparison, inhibition curves for the prototypical glycine site antagonist, 5,7 DCKA, were similar when it was used to block responses mediated by GluN1/GluN2A and GluN1/GluN2B NMDA receptors (Figure 2C,D). The IC50 values for 5,7 DCKA obtained at each of the glycine concentrations are reported in Table 1.
Figure 2.

Inhibition curves for TCN 213 and 5,7 DCKA antagonism of GluN1/GluN2A and GluN1/GluN2B NMDA receptor-mediated responses. (A) Mean inhibition curves for TCN 213 block of GluN1/GluN2A NMDA receptor-mediated currents. Currents were evoked by glutamate (100 µM) and glycine (0.1 × EC50; EC50,or 10 × EC50). The data points were fitted with the Hill equation (see Methods), and the mean IC50 values are indicated by the vertical dashed lines. (B) Summary of the mean inhibition of GluN1/GluN2B NMDA receptor-mediated currents by TCN 213. The low potency of TCN 213 at this receptor combination prevented the estimation of an IC50 value at any of the glycine concentrations used. (C, D) as in panel A but for 5,7 DCKA antagonism of GluN1/GluN2A or GluN1/GluN2B NMDA receptor-mediated currents respectively. The mean IC50 values for TCN 213 and 5,7 DCKA antagonism are reported in Table 1.
Table 1.
IC50 values for TCN 213 and 5,7 DCKA acting at GluN1/GluN2A or GluN1/GluN2B NMDA receptors, in the presence of different concentrations of glycine (gly)
| Antagonist IC50 (µM) | ||
|---|---|---|
| TCN 213 | 5,7 DCKA | |
| GluN1/GluN2A | ||
| [gly]= 0.1 EC50 | 0.55 ± 0.05 (7) | 0.13 ± 0.01 (6) |
| [gly]= EC50 | 3.5 ± 0.05 (7) | 0.42 ± 0.03 (9) |
| [gly]= 10 EC50 | 40 ± 3.5 (6) | 4.1 ± 0.3 (4) |
| GluN1/GluN2B | ||
| [gly]= 0.1 EC50 | n.d. | 0.074 ± 0.01 (6) |
| [gly]= EC50 | n.d. | 0.49 ± 0.01 (6) |
| [gly]= 10 EC50 | n.d. | 4.1 ± 0.4 (6) |
Values are given as mean ± SEM with the number of experiments given in parentheses.
n.d., not determined.
Schild analysis of TCN 213 antagonism of GluN1/GluN2A NMDA receptor-mediated currents
While IC50 values are commonly reported to describe the potency of an antagonist, they suffer from the fact that they are dependent on both the nature and the concentration of the agonist used to evoked the response to be antagonized (see Wyllie and Chen, 2007). Schild analysis (Arunlakshana and Schild, 1959) does not have such limitations, and we have used this method to determine the equilibrium constant (KB) for TCN 213 acting at GluN1/GluN2A NMDA receptors. Figure 3A shows a series of pairs of TEVC current traces recorded in the absence or the presence of TCN 213 (3, 10 or 30 µM). In all recordings, the glutamate concentration was fixed at 100 µM to ensure full occupancy of its binding site on the GluN2A NMDA receptor subunit, and we attempted to match the magnitude of the responses recorded in the absence of TCN 213 by increasing the concentration of glycine that was co-applied with TCN 213. Figure 3B shows the ‘two-point’ concentration–response curves obtained from the TEVC current traces like those illustrated in Figure 3A and from which we estimated the dose ratio (r) for each antagonist concentration. Pooling data from a series of similar experiments gave mean r-values of 1.31 ± 0.17, 5.20 ± 0.79 and 17.22 ± 1.69 for 3, 10 and 30 µM TCN 213 respectively (n= 5, 5 and 4). The resulting Schild plot obtained from these data is shown in Figure 3C, and a linear fit of the data points with the slope constrained to be unity gave a KB value of 2.06 ± 0.17 µM. We also estimated the KB value by simply calculating the value from the Schild equation using the individual r-values obtained from individual experiments – this gave a mean value of 2.2 ± 0.2 µM, whilst confirming that the individual estimates of such KB values were independent of the antagonist concentration (F2,11= 1.13, P= 0.36; one-way anova). A potential limitation of our use of low agonist concentrations to generate ‘two-point’ dose–response curves is that while these allow us to assess parallel shifts in the dose–response curves, it does not allow us to determine whether antagonism is surmountable as would be anticipated for a competitive antagonist. We therefore carried out a further set of experiments to show that antagonism by TCN 213 of a response evoked by maximal concentrations of both glutamate (100 µM) and glycine (50 µM) could be overcome by increasing the glycine concentration. The results from these experiments are summarized in Figure 3D.
Figure 3.
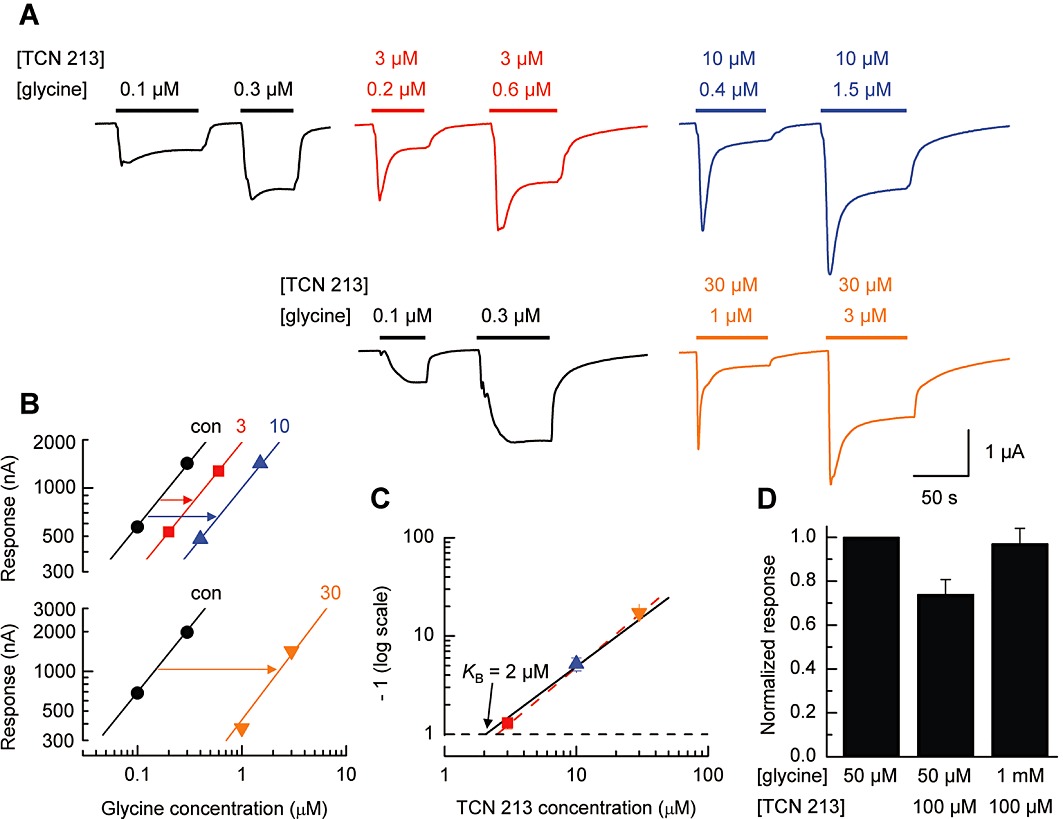
Schild analysis of TCN 213 antagonism of GluN1/GluN2A NMDA receptor-mediated responses. (A) Illustration of a set of TEVC current traces, obtained from an oocyte expressing GluN1/GluN2A NMDA receptors, and used to generate ‘two-point’ dose–response curves in either the absence or presence of TCN 213. (B) Partial, low-concentration dose–response curves obtained from the TEVC current traces illustrated in panel A and used to estimate dose ratios (r). The slope of the fitted line to the control responses (no TCN 213) was used to fit the responses obtained in the presence of 3 µM, 10 µM and 30 µM TCN 213. (C) Schild plot for antagonism by TCN 213 of GluN1/GluN2A NMDA receptors using dose ratios estimated from a series of experiments (n= 5, 5, 4), such as that illustrated in panel B. The dashed line represents a ‘free’ fit of the data and has a slope of 1.13. This was considered not to be significantly different from 1 (95% confidence interval: 0.94–1.31) and the solid line is the fit of the data points to the Schild equation (i.e. the slope of this line is unity). The intercept on the abscissa (where the log10 value of the dose ratio equals zero) gives an equilibrium constant (KB) value for TCN 213 of 2.06 ± 0.17 µM. (D) Bar graph summary showing that antagonism of GluN1/GluN2A NMDA receptor-mediated currents is surmountable when the glycine concentration is increased.
TCN 213 and native GluN2B-containing NMDA receptors
The experiments described so far have only examined the effect of TCN 213 on heterologously expressed recombinant NMDA receptors where the subunit composition of the population of receptors is known. We next wanted to assess the ability of TCN 213 to antagonize native NMDA receptors. NMDA receptor subunit expression displays both temporal and spatial regulation (Monyer et al., 1994) where in early post-natal forebrain development the GluN2B subunit expression is highest and most ubiquitous. We therefore first chose to study native NMDA receptors in cultures of rat cortical neurones at a stage (DIV 7–10) where it would be anticipated that the most prominent NMDA receptor combination is that formed by GluN1 and GluN2B subunits. Figure 4A (trace on left) shows a whole-cell current recording from a cortical pyramidal cell, voltage-clamped at −70 mV, where application of NMDA (50 µM) in the presence of glycine (1.5 µM) gives an inward current that was not antagonized by TCN 213 (10 µM). This glycine concentration was chosen as a priori we did not know the composition of the NMDA receptor population in these neurones and considered it better to use a glycine concentration that was equivalent to the higher of the EC50 values for GluN2A- and GluN2B-containing NMDA receptors. The average inhibition of NMDA receptor-mediated currents recorded from cortical neurones at this stage of development was only 2 ± 3% (n= 12 cells from five separate cultures; Figure 4B). The strong ifenprodil block together with the lack of TCN 213 block of NMDA receptor-mediated currents in these neurones is indicative that the majority of NMDA receptors present in these cells are made up of only GluN1 and GluN2B subunits since with the glycine and TCN 213 concentrations used, we would have expected around 75% block of the current if the population had been made up entirely of GluN2A-containing NMDA receptors (Figure 2A). Indeed, to confirm this, we measured the amount of antagonism produced by ifenprodil (3 µM), the GluN2B-selective antagonist. Our data indicate that NMDA receptor-mediated currents in these neurones were strongly inhibited by this blocker (Figure 4A, trace on right). On average, ifenprodil (3 µM) blocked NMDA receptor-mediated currents by 72 ± 2% (n= 12 cells from five separate cultures; Figure 4B). This confirms that the majority of NMDA receptors present in these cells are made up of only GluN1 and GluN2B subunits (note that ifenprodil is a non-competitive antagonist that at most blocks 75–80% of the current mediated by GluN1/GluN2B NMDA receptors). Furthermore, if we restrict our analysis to a subset of recordings that showed the greatest block by ifenprodil (78 ± 1%; n= 7 cells from four separate cultures), which will presumably identify cells with the largest GluN1/GluN2B NMDA receptor content, the extent of the TCN 213 block is 4 ± 2% (n= 7). Ifenprodil also antagonizes heterotrimeric NMDA receptors containing GluN1, GluN2A and GluN2B subunits (Kew et al., 1998; Tovar and Westbrook, 1999; Hatton and Paoletti, 2005), and this combination is considered to form a significant population of native NMDA receptors (Chazot and Stephenson, 1997; Rauner and Köhr, 2011). Nevertheless, the concentration of ifenprodil required to block such heterotrimeric receptors combination is higher than that used here. In addition, the extent of the block produced by ifenprodil (72%) is very similar to the block produced by this concentration when applied to recombinant NMDA receptors containing only GluN1 and GluN2B subunits. Thus, in the conditions studied here (rat cortical neurones, 7–10 DIV), the vast majority of NMDA receptors are heterodimers of the GluN1/GluN2B subtype.
Figure 4.

Activity of TCN 213 at native NMDA receptor-mediated responses in rat cortical cultures (DIV 7–9). (A) Whole-cell current recording made from a rat cortical pyramidal cell (7 DIV) and voltage-clamped at −70 mV. TCN 213 (10 µM) does not antagonize the NMDA (50 µM) + glycine (1.5 µM) evoked current, whereas ifenprodil (3 µM) reduces the current by around 75% indicating the presence of a large population of GluN1/GluN2B NMDA receptors in this neurone. (B) Bar graph summary (n= 12 cells) illustrating the mean TCN 213 and ifenprodil block of NMDA/glycine evoked currents. (C) Typical micrographs of neurones used to determine the extent of cell death elicited by each of the treatments. Note the high ratio of pyknotic nuclei compared with non-pyknotic nuclei when neurones are exposed to NMDA (40 µM) in the presence of TCN 213 (10 µM). Calibration bar 20 µm. (D) Summary of the percentage cell death observed in response to 1 h exposure to NMDA at the concentrations indicated (+1.5 µM glycine). Note the neuroprotective effects of the GluN1/GluN2B NMDA receptor selective antagonist, ifenprodil (3 µM) and the non-selective GluN1-site antagonist, 5,7 DCKA (10 µM). TCN 213 (10 µM) is, however, not neuroprotective.
In a separate series of experiments, we assessed the ability of TCN 213 to block NMDA-induced excitoxicity in cortical cultures (DIV 7–10). We have previously demonstrated that NMDA-induced cell death in hippocampal neurones at this stage of development in vitro can be completely attenuated by ifenprodil indicating that this process is mediated by GluN2B-containing NMDA receptors (Martel et al., 2009). Figure 4C shows example images of neuronal cell bodies from untreated and NMDA (40 µM)-treated cultures. In the absence of neurotoxic insult, neurones display regularly sized cell bodies (Figure 4Ci). This is also seen when NMDA is applied in the presence of ifenprodil (Figure 4Ciii) or the non-selective GluN1-site antagonist, 5,7 DCKA (Figure 4Civ). However in the absence of any NMDA receptor antagonists (Figure 4Cii) or TCN 213 (Figure 4Cv), the presence of a high percentage of pyknotic cell nuclei is evident. Figure 4D summarizes a series of experiments where we have quantified the neuroprotective effects of ifenprodil, 5,7 DCKA and TCN 213. The extent of cell death seen in the presence of TCN 213 was not significantly different from that seen in cultures treated with NMDA alone. Both ifenprodil (3 µM) and 5,7 DCKA (10 µM) reduced significantly the percentage of neurones displaying pyknotic nuclei (P < 0.05 with Bonferroni correction; n= 3–4 repeats for each condition).
TCN 213 antagonism of GluN2A-containing NMDA receptors in cortical neurones
The experiments illustrated in Figure 4 show that neurones predominantly express GluN2B-containing NMDA receptors at DIV 7–10. Thus, in a final series of experiments, we assessed the ability of TCN 213 to block native NMDA receptors containing GluN2A subunits. For these experiments, we increased the concentration of glycine (to 3 µM) in our external recording as we wanted to increase the proportion of GluN2A-containing NMDA receptors that would be activated in this set of experiments. We confirmed, however, that the effect of this increased glycine concentration did not prevent us from blocking selectively GluN1/GluN2A over GluN1/GluN2B NMDA receptors by measuring the extent of TCN 213 antagonism at recombinantly expressed NMDA receptors (Figure S3A,B). For GluN1/GluN2A NMDA receptors, TCN 213 (30 µM) produced a mean block of 78 ± 4% (n= 5), whereas at GluN1/GluN2B NMDA receptors only 2 ± 0.5% (n= 4) of the NMDA-evoked current was antagonized.
To compare TCN 213 block of NMDA-evoked currents from a similar developmental age with those used in the experiments illustrated in Figure 4 but where GluN2A subunits were now present, we transfected cortical cultures (DIV 5–9) with a plasmids containing either GluN2A cDNA or cDNA encoding globin (to act as a control; see Methods). In a separate series of experiments, we recorded form cortical neurones at a later developmental stage (DIV 14–17) when one would anticipate that expression levels of GluN2A subunits are increased (Monyer et al., 1994). The results of these experiments are illustrated in Figure 5. Figure 5A shows typical whole-cell currents recorded from either a globin-transfected (upper trace), a GluN2A-transfected (middle trace) or an older non-transfected (lower trace) cortical neurone. Control responses to NMDA (50 µM) and glycine (3 µM) established the magnitude of NMDA receptor-mediated response in each neurone prior to the application of NMDA and glycine together with the GluN2B-selective antagonist, ifenprodil (3 µM). The extent of the ifenprodil block (Figure 5B) was greatest in globin-transfected neurones and lower in both GluN2A-transfected neurones and non-transfected neurones. Once a steady-state response was obtained in response, we applied TCN 213 (30 µM) to determine the amount of the remaining current that was sensitive to this GluN2A-selective antagonist. For TCN 213 antagonism (Figure 5C), we observed that the mean block was greatest at GluN2A-transfected neurones and lower at both non-transfected neurones and globin-transfected neurones. However, these mean values for ifenprodil and TCN 213 block of NMDA-evoked currents in each of these three categories of neurones obscure the fact that there was a highly correlated (R2= 0.87) relationship between the magnitude of ifenprodil block and TCN 213 block in each cell we examined (Figure 5D). Thus, an NMDA-evoked current that showed high ifenprodil sensitivity was only weakly antagonized by TCN 213, whereas strong block of currents by TCN 213 was observed in cells, which showed lower sensitivity to ifenprodil. This reciprocal relationship in antagonism by two NMDA receptor subtype-selective blockers is a key observation and allows pharmacological profiling of NMDA receptor subunit composition.
Figure 5.
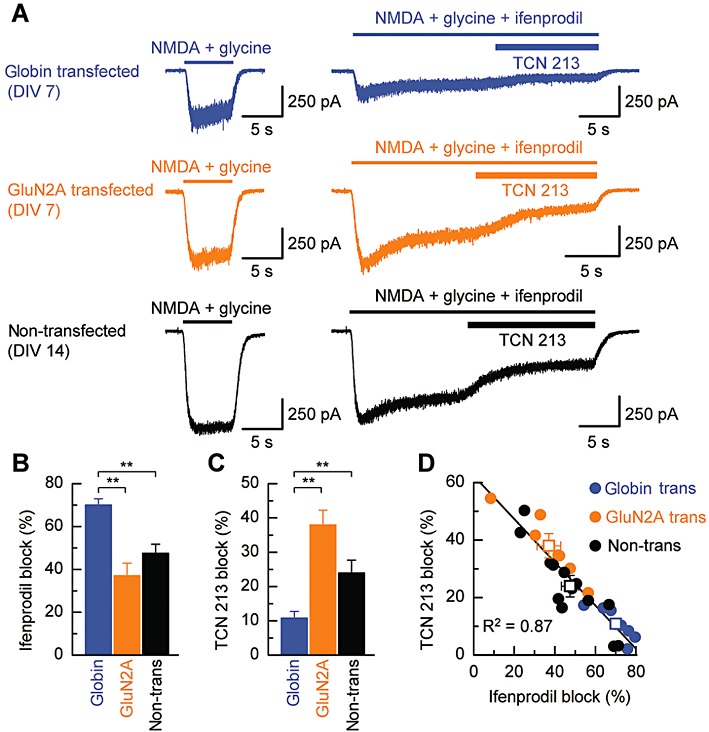
TCN 213 antagonism of GluN2A-containing cortical neurones. (A) Example whole-cell currents recorded from cortical pyramidal cells voltage-clamped at −70 mV. Upper left trace: example of an NMDA receptor-mediated current elicited by NMDA (50 µM) in the presence of glycine (3 µM) and recorded from a globin-transfected (control) pyramidal neurone (DIV 7). The trace to the right illustrates the NMDA receptor-mediated current recorded from the same cell and to the same concentrations of NMDA and glycine but also in the presence of the GluN2B-selective antagonist, ifenprodil (3 µM). Once a steady-state response was established, TCN 213 (30 µM) was applied to determine the amount of the ifenprodil-unblocked current that was sensitive to this GluN2A-selective antagonist. Middle and lower traces: examples of whole-cell currents recorded from either a GluN2A-transfected (DIV 7; middle trace) or non-transfected (DIV 14; lower trace) pyramidal neurone using the same drug application protocol as described above. (B) Bar graph summaries illustrating the mean ifenprodil block of NMDA receptor-mediated currents recorded from neurones in each of the three categories described in panel A. Ifenprodil block is greatest in young (DIV 7–11) neurones transfected with globin (n= 8), and this is significantly greater (P < 0.01, t-test with Bonferroni correction) than the ifenprodil block of NMDA-induced currents in either GluN2A-transfected (n= 7) or older (DIV 14–17; n= 13) pyramidal neurones. (C) Equivalent bar graph summaries to those illustrated in panel B, but for TCN 213 block of NMDA receptor-mediated currents. In this case TCN 213 antagonism is observed to be the greatest at GluN2A-transfected neurones and weakest at globin-transfected neurones. (D) Plot illustrating the extent of ifenprodil and TCN 213 antagonism (in the same cell) of NMDA-evoked currents. While a wide range in the amount of block produced by either ifenprodil or TCN 213 is observed (particularly for recordings from GluN2A-transfected and from neurones in older cultures), there is a strong (negative) correlation (R2= 0.87) between the amount of block produced by ifenprodil and TCN 213.
Discussion
Our data demonstrate clearly that TCN 213 showed selective antagonism of GluN1/GluN2A over GluN1/GluN2B NMDA receptors. This antagonism could be surmounted by increasing the concentration of glycine but not glutamate present in the external recording solution. Over the concentration range examined, Schild analysis of TCN 213 antagonism gave a Schild plot with unity slope, which is indicative of competitive antagonism (but see below for further discussion). Our observations are not only consistent with some of those made in the study of Bettini et al. (2010) but also extend these earlier findings as we have calculated for the first time a KB value for TCN 213 acting at GluN1/GluN2A NMDA receptors. In addition, we show that TCN 213 permits direct pharmacological identification of functional NMDA receptors containing GluN2A subunits and thus will have considerable utility for the study of, and changes in, NMDA receptor composition.
TCN 213 permits pharmacological profiling of developmental changes in native NMDA receptor subunit composition
Early studies describing the in situ expression of mRNA levels of GluN1 and GluN2 subunits indicated both spatial and temporal control of NMDA receptor subtypes (Monyer et al., 1994). Indeed, developmental changes in the subunit composition of native NMDA receptors are well-documented in, for example, cortical neurones (Carmignoto and Vicini, 1992; Hestrin, 1992; Sheng et al., 1994; Crair and Malenka, 1995; Flint et al., 1997; Stocca and Vicini, 1998) cerebellar neurones (Farrant et al., 1994) and striatal neurones (Logan et al., 2007; Brothwell et al., 2008). For cortical neurones, NMDA receptor composition switches from a population made up from predominantly GluN1 and GluN2B subunits to ones that are heterodimeric combinations of GluN1 and GluN2A, and GluN1 and GluN2B subunits as well as heterotrimeric combinations of each of these three subunits. The evidence for such changes in subunit composition comes from changes in the kinetics of glutamatergic synaptic currents, protein and mRNA expression levels, co-immunoprecipitation with subunit-specific antibodies and the sensitivity of NMDA receptor-mediated currents to selective GluN2B antagonists (see van Zundert et al., 2004). What has been lacking, to date, is the ability to block selectively NMDA receptors comprising of GluN1 and GluN2A subunits. Although competitive antagonists such as NVP-AAM077 show some selectivity for GluN1/GluN2A over GluN1/GluN2B NMDA receptors (Auberson et al., 2002), this selectivity is not enough to allow unequivocal NMDA receptor subunit identification (Frizelle et al., 2006). Therefore, novel ligands such as TCN 213 and 3-chloro-4-fluoro-N-[4-[[2-(phenylcarbonyl)hydrazino]carbonyl]benzyl] benzenesulphonamide (Bettini et al., 2010), with their greater selectivity, offer greater potential for elucidation of NMDA receptor composition. Our data clearly show that for cortical neurones at early developmental stages (DIV 7–10), the vast majority of NMDA receptors are comprised of only GluN1 and GluN2B subunits since their sensitivity to ifenprodil is very similar to that seen with recombinant GluN1/GluN2B NMDA receptors. The range of ifenprodil and TCN 213 block in older cultures (DIV 14–17) indicates that this population of neurones express both GluN2A- and GluN2B-containing NMDA receptors. Our data do not address directly the proportion of NMDA receptors that are triheteromeric complexes of GluN1, GluN2A and GluN2B subunits (Chazot and Stephenson, 1997; Rauner and Köhr, 2011) as we do not know how effective TCN 213 is at blocking such receptor combinations. Nevertheless, comparison with our data from recombinant NMDA receptors indicates, for recordings where TCN 213 blocked around 50% of the current remaining following the application of ifenprodil, that heterotrimeric complexes are unlikely to represent the majority of NMDA receptors in the total population.
The nature of TCN 213 subtype selective NMDA receptor antagonism of GluN1/GluN2A NMDA receptors
Our data show that TCN 213 can produce complete block of GluN1/GluN2A NMDA receptor-mediated responses, while sparing responses mediated by GluN1/GluN2B NMDA receptors. However, this was only achieved when the glycine concentration was low (0.1 × EC50; Figure 3A,B). At higher glycine concentrations, complete block of GluN1/GluN2A NMDA receptors was not achieved, although the selectivity of TCN 213 is still sufficient to discriminate very effectively between GluN1/GluN2A and GluN1/GluN2B NMDA receptors (Figure S3). It could be argued that one need only increase the concentration of antagonist to overcome higher concentrations of glycine. However, extrapolation of our data (Figure 2A) shows that for a glycine concentration that is 10 times its EC50 value, it is predicted that a concentration of around 1 mM TCN 213 would be required to block fully a GluN1/GluN2A NMDA receptor-mediated response. It remains unclear whether at such high concentration if TCN 213 would still retain selectivity of GluN1/GluN2A NMDA receptor-mediated responses over those mediated by GluN2B-containing NMDA receptors, notwithstanding that the solubility of TCN 213 would make it unlikely that such high concentrations could be used effectively.
Let us now consider how the selectivity of TCN 213 for GluN1/GluN2A NMDA receptors may come about. The glycine dependency of the IC50 values for TCN 213, the Schild analysis giving a unity slope and the fact that the antagonism can be surmounted and a maximum response retained by increasing the glycine concentration are consistent with the notion that TCN 213 is a competitive, reversible antagonist that acts at the GluN1 glycine binding site. Why therefore is TCN 213 selective for GluN1/GluN2A over GluN1/GluN2B NMDA receptors as they both contain the same GluN1 subunit? A potential explanation for this could be that the conformation or accessibility of the site to which TCN 213 binds is different when GluN1 is associated with GluN2A or GluN2B NMDA receptor subunits. Our previous work (Chen et al., 2008) has documented the relative potencies of a series of GluN1 (glycine site) full and partial agonists for each of the four NMDA receptor subtypes. These data showed that for all agonists the rank order of potency was GluN1/GluN2D > GluN1/GluN2C > GluN1/GluN2B > GluN1/GluN2A. These data refer to potencies of agonist where the EC50 value reflects all the rate constants governing ‘binding’ and ‘gating’ steps in the reaction scheme that describes the activation of the receptor. Indeed, our data concerning the actions of agonists at the GluN1 NMDA receptor subunit suggested that differences in the potencies of glycine-site agonists were due to interactions between amino acids at the interface of GluN1 and GluN2 NMDA receptor subunits, and that this most likely contributed to altered ‘gating’ of GluN1-dependent reactions when GluN1 was co-expressed with each of the GluN2 NMDA receptor subunits. This interpretation was consistent with our findings from Schild analysis, which indicated that the KB values for 5,7 DCKA at GluN1/GluN2A and GluN1/GluN2D NMDA receptors were indistinguishable (Chen et al., 2008). Thus, 5,7 DCKA binds to the GluN1 site in GluN1/GluN2A and GluN1/GluN2D NMDA receptors with equal affinity despite the fact there is a 10-fold difference in the potency of glycine at GluN1/GluN2A and GluN1/GluN2D NMDA receptors. Nevertheless, two derivatives of 5,7 DCKA do exhibit some subtype selectivity for GluN2A- and GluN2B-containing NMDA receptors. L-689 560 (Hess et al., 1996) shows a modest (5-fold) selectivity for GluN2A- over GluN2B-containing NMDA receptors, whereas CGP-61594 (Honer et al., 1998) is 10-fold more potent at GluN1/GluN2B NMDA receptors compared with GluN1/GluN2A NMDA receptors. Our data for TCN 213 were quite different and suggested a far greater selectivity of TCN 213 than those reported for those antagonists based on the 5,7 DCKA structure. While the data illustrated in Figure 2B do not allow any estimation of an IC50 value for TCN 213 acting at GluN1/GluN2B NMDA receptors, we would estimate that the IC50 value would need to be in excess of 300 µM (for glycine concentration equal to its EC50). This would indicate a selectivity of around 100-fold, which is considerably greater than that reported for antagonists based on the 5,7 DCKA structure.
We need also to consider an alternative explanation for the antagonism produced by TCN 213. The study of Bettini et al. (2010) showed that TCN 213 failed to displace the GluN1 ligand MDL 105 519, which can be taken to indicate that TCN 213 does not act competitively (i.e. mutually exclusive binding with glycine), but rather that it acts allosterically to modulate glycine binding in a manner which cannot be distinguished by the types of experiments we have carried out in the present study. For example, if TCN 213 caused an increase in the dissociation rate of glycine from its binding site on the GluN1 subunit, then our experiments and the limited concentration range of TCN 213 we have used could not distinguish between this alternative mode of action and competitive, reversible antagonism (SF Traynelis, K Hansen and K Odgen, pers. comm.). Evidence for either a competitive antagonist mechanism or an allosteric modulation of glycine (un)binding will be provided from studies examining crystal structures bound with TCN 213 and detailed investigations of the kinetics of TCN 213 blocking and unblocking rates.
Conclusion
While precise details concerning the mode of action of TCN 213 remain, it is clear that this ligand and the related sulphonamide derivatives (Bettini et al., 2010; Ogden and Traynelis, 2011) offer us new pharmacological tools to probe NMDA receptor function and specifically afford us the opportunity to antagonize selectively GluN1/GluN2A NMDA receptors. Our study took advantage of this selective antagonism by TCN 213 and allowed us to use a pharmacological approach to monitor directly changes in subunit composition in functional NMDA receptors in developing cortical neurones.
Acknowledgments
This work was supported by the funds from The Wellcome Trust and the Honours Programmes in Pharmacology and Neuroscience at The University of Edinburgh. We thank Matt Livesey for constructive comments on the manuscript and Steve Traynelis, Kasper Hansen and Kevin Ogden (Emory University) for helpful discussions and for sharing unpublished data.
Glossary
- 5,7 DCKA
5,7 dichlorokynurenic acid
- DIV
days in vitro
- TCN 213
N-(cyclohexylmethyl)-2-({5-[(phenylmethyl)amino]-1,3,4-thiadiazol-2-yl}thio)acetamide
- TEVC
two-electrode voltage clamp
Conflicts of interest
The authors state no conflict of interest.
Supporting information
Additional Supporting Information may be found in the online version of this article:
Figure S1 Requirement of glycine for NMDA receptor activation and structures of the GluN1 NMDA receptor subunit antagonists, TCN 213 and 5,7 DCKA. (A) TEVC recording from an oocyte expressing recombinant GluN1/GluN2A NMDA receptors and voltage-clamped at −40 mV. Application of glutamate (100 µM) in the absence of glycine (indicated by the grey bar and trace) evokes only a small (<20 nA) in ward current. Simultaneous application (indicated by the black bars) of both glutamate and glycine (50 µM) results in a large (2.5 µA) inward current. On average, the mean current evoked by glutamate in the absence of added glycine was 1.2 ± 0.4% (n = 4) of the current recorded when both glutamate and glycine were present. (B) Structure of the novel glycine site antagonist, TCN 213, characterized in this study. (C) Structure of the prototypical glycine site antagonist, 5,7 DCKA.
Figure S2 Schild analysis using two-point dose–response curves. (A) Del-Castillo–Katz reaction scheme showing mutually exclusive binding of an agonist, A, and an antagonist, B, to a receptor, R. The active state of the receptor AR* is reached via an intermediate liganded but inactive state AR. The antagonist when bound to R results in the inactive state, BR. Equilibrium constants for agonist and antagonist binding are denoted as KA and KB, respectively, while the equilibrium constant for the isomerization reaction of AR to the AR* state is denoted by E. In the absence of antagonist and using the equilibrium constants as shown,the proportion (pAR*) of receptors in the AR* state has a maximum value (i.e. KA/1 + E) of 1.5 µM. (B) Series of predicted dose-response curves generated in the absence or presence of antagonist for the reaction scheme shown in A. In the presence of the antagonist, the dose–response curves are shifted in a parallel manner to the right and retain the maximum response that is achieved in the absence of the antagonist. In the presence of the antagonist, the EC50 is shifted by a factor of 1 + cB, where cB = [B]/KB. (C) The are enclosed by the dashed grey box in panel B is expanded to show the profile of the dose–response curves on a conventional semi-log plot (upper graph) and a log–log plot (lower graph). Note the linear transformation of the data when log–log scales are used. Since each of the lines are parallel, dose ratios (r) can easily be obtained by dividing the concentration of agonist required to evoke a response in the presence of a given antagonist concentration by the agonist concentration that produces the same response in the absence of antagonist. Thus, only two data points are required to define each line on the log-log plot when low agonist concentrations are used – this is the basis ofour methodology. (D) Schild plot using the dose ratio values obtained from C. The data points are fitted with a straight line with unity slope. The intercept on the abscissa recovers the KB value of 2 µM used in the reaction scheme in panel A.
Figure S3 Antagonism of recombinant NMDA receptors at higher glycine concentrations. (A) Upper trace: example of TEVC current trace recorded from an oocyte expressing GluN1/GluN2A NMDA receptors. NMDA receptors were activated by NMDA (50 µM) and glycine (3 µM). Application of TCN 213 (30µM) results is an approximately 75% reduction in the amplitude of the current response. Lower trace: TEVC current recorded under the same conditions but from an oocyte expressing GluN1/GluN2B NMDA receptors. Note that TCN 213 produces very little block of the NMDA receptor-mediated current and therefore at these concentrations of NMDA (50 µM) and glycine (3 µM) discriminates between these two NMDA receptor subtypes. (B) Bargraph illustrating the mean block produced by TCN 213 of GluN1/GluN2A and GluN1/GluN2B NMDA receptor-mediated currents. On average, GluN1/GluN2A NMDA receptor currents were blocked by 78± 4% (n = 5), whereas GluN1/GluN2B NMDA receptor currents were blocked by 2 ± 0.5% (n = 4).
Please note: Wiley-Blackwell are not responsible for the content or functionality of any supporting materials supplied by the authors. Any queries (other than missing material) should be directed to the corresponding author for the article.
References
- Alexander SPH, Mathie A, Peters JA. Guide to Receptors and Channels (GRAC), 5th Edition. Br J Pharmacol. 2011;164(Suppl. 1):S1–S324. doi: 10.1111/j.1476-5381.2011.01649_1.x. [DOI] [PMC free article] [PubMed] [Google Scholar]
- Arunlakshana O, Schild HO. Some quantitative uses of drug antagonists. Br J Pharmacol Chemother. 1959;14:48–57. doi: 10.1111/j.1476-5381.1959.tb00928.x. [DOI] [PMC free article] [PubMed] [Google Scholar]
- Auberson YP, Allgeier H, Bischoff S, Lingenhoehl K, Moretti R, Schmutz M. 5-Phosphonomethylquinoxalinediones as competitive NMDA receptor antagonists with a preference for the human 1A/2A, rather than 1A/2B receptor composition. Bioorg Med Chem Lett. 2002;12:1099–1102. doi: 10.1016/s0960-894x(02)00074-4. [DOI] [PubMed] [Google Scholar]
- Bading H, Greenberg ME. Stimulation of protein tyrosine phosphorylation by NMDA receptor activation. Science. 1991;253:912–914. doi: 10.1126/science.1715095. [DOI] [PubMed] [Google Scholar]
- Bettini E, Sava A, Griffante C, Carignani C, Buson A, Capelli A, et al. Identification and characterization of novel NMDA receptor antagonists selective for NR2A- over NR2B-containing receptors. J Pharmacol Exp Ther. 2010;335:636–644. doi: 10.1124/jpet.110.172544. [DOI] [PubMed] [Google Scholar]
- Brothwell SL, Barber JL, Monaghan DT, Jane DE, Gibb AJ, Jones S. NR2B- and NR2D-containing synaptic NMDA receptors in developing rat substantia nigra pars compacta dopaminergic neurones. J Physiol. 2008;586:739–750. doi: 10.1113/jphysiol.2007.144618. [DOI] [PMC free article] [PubMed] [Google Scholar]
- Carmignoto G, Vicini S. Activity-dependent decrease in NMDA receptor responses during development of the visual cortex. Science. 1992;258:1007–1011. doi: 10.1126/science.1279803. [DOI] [PubMed] [Google Scholar]
- Chazot PL, Stephenson FA. Molecular dissection of native mammalian forebrain NMDA receptors containing the NR1 C2 exon: direct demonstration of NMDA receptors comprising NR1, NR2A, and NR2B subunits within the same complex. J Neurochem. 1997;69:2138–2144. doi: 10.1046/j.1471-4159.1997.69052138.x. [DOI] [PubMed] [Google Scholar]
- Chen PE, Wyllie DJA. Pharmacological insights obtained from structure-function studies of ionotropic glutamate receptors. Br J Pharmacol. 2006;147:839–853. doi: 10.1038/sj.bjp.0706689. [DOI] [PMC free article] [PubMed] [Google Scholar]
- Chen PE, Geballe MT, Stansfeld PJ, Johnston AR, Yuan H, Jacob AL, et al. Structural features of the glutamate binding site in recombinant NR1/NR2A N-methyl-D-aspartate receptors determined by site-directed mutagenesis and molecular modeling. Mol Pharmacol. 2005;67:1470–1484. doi: 10.1124/mol.104.008185. [DOI] [PubMed] [Google Scholar]
- Chen PE, Geballe MT, Katz E, Erreger K, Livesey M, O'Toole KK, et al. Modulation of glycine potency in rat recombinant NMDA receptors containing chimeric NR2A/2D subunits expressed in Xenopus laevis oocytes. J Physiol. 2008;586:227–245. doi: 10.1113/jphysiol.2007.143172. [DOI] [PMC free article] [PubMed] [Google Scholar]
- Collingridge GL, Olsen RW, Peters JA, Spedding M. A nomenclature for ligand-gated ion channels. Neuropharmacology. 2009;56:2–5. doi: 10.1016/j.neuropharm.2008.06.063. [DOI] [PMC free article] [PubMed] [Google Scholar]
- Crair MC, Malenka RC. A critical period for long-term potentiation at thalamocortical synapses. Nature. 1995;375:325–328. doi: 10.1038/375325a0. [DOI] [PubMed] [Google Scholar]
- Erreger K, Chen PE, Wyllie DJA, Traynelis SF. Glutamate receptor gating. Crit Rev Neurobiol. 2004;16:187–224. doi: 10.1615/critrevneurobiol.v16.i3.10. [DOI] [PubMed] [Google Scholar]
- Erreger K, Geballe MT, Kristensen A, Chen PE, Hansen KB, Lee CJ, et al. Subunit-specific agonist activity at NR2A, NR2B, NR2C, and NR2D containing N-methyl-D-aspartate glutamate receptors. Mol Pharmacol. 2007;72:907–920. doi: 10.1124/mol.107.037333. [DOI] [PubMed] [Google Scholar]
- Farrant M, Feldmeyer D, Takahashi T, Cull-Candy SG. NMDA-receptor channel diversity in the developing cerebellum. Nature. 1994;368:335–339. doi: 10.1038/368335a0. [DOI] [PubMed] [Google Scholar]
- Fischer G, Mutel V, Trube G, Malherbe P, Kew JNC, Mohacsi E, et al. Ro- 25–6981, a highly potent and selective blocker of N-methyl-D-aspartate receptors containing the NR2B subunit. Characterisation in vitro. J Pharmacol Exp Ther. 1997;283:1285–1292. [PubMed] [Google Scholar]
- Flint AC, Maisch US, Weishaupt JH, Kriegstein AR, Monyer H. NR2A Subunit expression shortens NMDA receptor synaptic currents in developing neocortex. J Neurosci. 1997;17:2469–2476. doi: 10.1523/JNEUROSCI.17-07-02469.1997. [DOI] [PMC free article] [PubMed] [Google Scholar]
- Frizelle PA, Chen PE, Wyllie DJA. Equilibrium constants for (R)-[(S)-1-(4-bromo-phenyl)-ethylamino]-(2,3-dioxo-1,2,3,4-tetrahydroquinoxalin-5-yl)-methyl]-phosphonic acid (NVP-AAM077) acting at recombinant NR1/NR2A and NR1/NR2B N-methyl-D-aspartate receptors: implications for studies of synaptic transmission. Mol Pharmacol. 2006;70:1022–1032. doi: 10.1124/mol.106.024042. [DOI] [PubMed] [Google Scholar]
- Fujikawa DG, Shinmei SS, Cai B. Kainic acid-induced seizures produce necrotic, not apoptotic, neurons with internucleosomal DNA cleavage: implications for programmed cell death mechanisms. Neuroscience. 2000;98:41–53. doi: 10.1016/s0306-4522(00)00085-3. [DOI] [PubMed] [Google Scholar]
- Hardingham GE, Fukunaga Y, Bading H. Extrasynaptic NMDARs oppose synaptic NMDARs by triggering CREB shut-off and cell death pathways. Nat Neurosci. 2002;5:405–414. doi: 10.1038/nn835. [DOI] [PubMed] [Google Scholar]
- Hatton CJ, Paoletti P. Modulation of triheteromeric NMDA receptors by N-terminal domain ligands. Neuron. 2005;46:261–274. doi: 10.1016/j.neuron.2005.03.005. [DOI] [PubMed] [Google Scholar]
- Hess SD, Daggett LP, Crona J, Deal C, Lu CC, Urrutia A, et al. Cloning and functional characterization of human heteromeric N-methyl-D-aspartate receptors. J Pharmacol Exp Ther. 1996;278:808–816. [PubMed] [Google Scholar]
- Hestrin S. Developmental regulation of NMDA receptor mediated synaptic currents at a central synapse. Nature. 1992;357:686–689. doi: 10.1038/357686a0. [DOI] [PubMed] [Google Scholar]
- Honer M, Benke D, Laube B, Kuhse J, Heckendorn R, Allgeier H, et al. Differentiation of glycine antagonist sites of N-methyl-D-aspartate receptor subtypes. Preferential interaction of CGP 61594 with NR1/2B receptors. J Biol Chem. 1998;273:11158–11163. doi: 10.1074/jbc.273.18.11158. [DOI] [PubMed] [Google Scholar]
- Johnson JW, Ascher P. Glycine potentiates the NMDA response in cultured mouse brain neurons. Nature. 1987;325:529–531. doi: 10.1038/325529a0. [DOI] [PubMed] [Google Scholar]
- Kew JN, Richards JG, Mutel V, Kemp JA. Developmental changes in NMDA receptor glycine affinity and ifenprodil sensitivity reveal three distinct populations of NMDA receptors in individual rat cortical neurons. J Neurosci. 1998;18:1935–1943. doi: 10.1523/JNEUROSCI.18-06-01935.1998. [DOI] [PMC free article] [PubMed] [Google Scholar]
- Kleckner NW, Dingledine R. Requirement for glycine in activation of NMDA-receptors expressed in Xenopus oocytes. Science. 1988;241:835–837. doi: 10.1126/science.2841759. [DOI] [PubMed] [Google Scholar]
- Logan SM, Partridge JG, Matta JA, Buonanno A, Vicini S. Long-lasting NMDA receptor-mediated EPSCs in mouse striatal medium spiny neurons. J Neurophysiol. 2007;98:2693–2704. doi: 10.1152/jn.00462.2007. [DOI] [PubMed] [Google Scholar]
- Martel MA, Wyllie DJ, Hardingham GE. In developing hippocampal neurons, NR2B-containing NMDA receptors can mediate signalling to neuronal survival and synaptic potentiation, as well as neuronal death. Neuroscience. 2009;158:334–343. doi: 10.1016/j.neuroscience.2008.01.080. [DOI] [PMC free article] [PubMed] [Google Scholar]
- Monyer H, Sprengel R, Schoepfer R, Herb A, Higuchi M, Lomeli H, et al. Heteromeric NMDA receptors: molecular and functional distinctions of subtypes. Science. 1992;256:1217–1221. doi: 10.1126/science.256.5060.1217. [DOI] [PubMed] [Google Scholar]
- Monyer H, Burnashev N, Laurie DJ, Sakmann B, Seeburg PH. Developmental and regional expression in the rat brain and functional properties of four NMDA receptors. Neuron. 1994;12:529–540. doi: 10.1016/0896-6273(94)90210-0. [DOI] [PubMed] [Google Scholar]
- Mott DD, Doherty JJ, Zhang S, Washburn MS, Fendley MJ, Lyuboslavsky P, et al. Phenylethanolamines inhibit NMDA receptors by enhancing proton inhibition. Nat Neurosci. 1998;1:659–667. doi: 10.1038/3661. [DOI] [PubMed] [Google Scholar]
- Ogden KK, Traynelis SF. New advances in NMDA receptor pharmacology. Trends Pharmacol Sci. 2011;32:726–733. doi: 10.1016/j.tips.2011.08.003. [DOI] [PMC free article] [PubMed] [Google Scholar]
- Otton HJ, Lawson McLean A, Pannozzo MA, Davies CH, Wyllie DJA. Quantification of the Mg2+-induced potency shift of amantadine and memantine voltage-dependent block in human recombinant GluN1/GluN2A NMDARs. Neuropharmacology. 2011;60:388–396. doi: 10.1016/j.neuropharm.2010.10.008. [DOI] [PubMed] [Google Scholar]
- Papadia S, Soriano FX, Léveillé F, Martel MA, Dakin KA, Hansen HH, et al. Synaptic NMDA receptor activity boosts intrinsic antioxidant defences. Nat Neurosci. 2008;11:476–487. doi: 10.1038/nn2071. [DOI] [PMC free article] [PubMed] [Google Scholar]
- Rauner C, Köhr G. Triheteromeric NR1/NR2A/NR2B receptors constitute the major N-methyl-D-aspartate receptor population in adult hippocampal synapses. J Biol Chem. 2011;286:7558–7566. doi: 10.1074/jbc.M110.182600. [DOI] [PMC free article] [PubMed] [Google Scholar]
- Rutter AR, Stephenson FA. Coexpression of postsynaptic density-95 protein with NMDA receptors results in enhanced receptor expression together with a decreased sensitivity to L-glutamate. J Neurochem. 2000;75:2501–2510. doi: 10.1046/j.1471-4159.2000.0752501.x. [DOI] [PubMed] [Google Scholar]
- Sheng M, Cummings J, Roldan LA, Jan YN, Jan LY. Changing subunit composition of heteromeric NMDA receptors during development of rat cortex. Nature. 1994;368:144–147. doi: 10.1038/368144a0. [DOI] [PubMed] [Google Scholar]
- Soriano FX, Martel MA, Papadia S, Vaslin A, Baxter P, Rickman C, et al. Specific targeting of pro-death NMDA receptor signals with differing reliance on the NR2B PDZ ligand. J Neurosci. 2008;28:10696–10710. doi: 10.1523/JNEUROSCI.1207-08.2008. [DOI] [PMC free article] [PubMed] [Google Scholar]
- Stocca G, Vicini S. Increased contribution of NR2A subunit to synaptic NMDA receptors in developing rat cortical neurons. J Physiol. 1998;507:13–24. doi: 10.1111/j.1469-7793.1998.013bu.x. [DOI] [PMC free article] [PubMed] [Google Scholar]
- Sugihara H, Moriyoshi K, Ishri T, Masu M, Nakanishi S. Structures and properties of seven isoforms of the NMDA receptor generated by alternative splicing. Biochem Biophys Res Commun. 1992;185:826–832. doi: 10.1016/0006-291x(92)91701-q. [DOI] [PubMed] [Google Scholar]
- Tovar KR, Westbrook GL. The incorporation of NMDA receptors with a distinct subunit composition at nascent hippocampal synapses in vitro. J Neurosci. 1999;19:4180–4188. doi: 10.1523/JNEUROSCI.19-10-04180.1999. [DOI] [PMC free article] [PubMed] [Google Scholar]
- Traynelis SF, Wollmuth LP, McBain CJ, Menniti FS, Vance KM, Ogden KK, et al. Glutamate receptor ion channels: structure, regulation and function. Pharmacol Rev. 2010;62:405–496. doi: 10.1124/pr.109.002451. [DOI] [PMC free article] [PubMed] [Google Scholar]
- Williams K. Ifenprodil discriminates subtypes of the N-methyl-D-aspartate receptor: selectivity and mechanisms at recombinant heteromeric receptors. Mol Pharmacol. 1993;44:851–859. [PubMed] [Google Scholar]
- Wrighton DC, Baker EJ, Chen PE, Wyllie DJA. Mg2+ and memantine block of rat recombinant NMDA receptors containing chimeric NR2A/2D subunits expressed in Xenopus laevis oocytes. J Physiol. 2008;586:211–225. doi: 10.1113/jphysiol.2007.143164. [DOI] [PMC free article] [PubMed] [Google Scholar]
- Wyllie DJA, Chen PE. Taking the time to study competitive antagonism. Br J Pharmacol. 2007;150:541–551. doi: 10.1038/sj.bjp.0706997. [DOI] [PMC free article] [PubMed] [Google Scholar]
- van Zundert B, Yoshii A, Constantine-Paton M. Receptor compartmentalization and trafficking at glutamate synapses: a developmental proposal. Trends Neurosci. 2004;27:428–437. doi: 10.1016/j.tins.2004.05.010. [DOI] [PubMed] [Google Scholar]
Associated Data
This section collects any data citations, data availability statements, or supplementary materials included in this article.