

Abstract
BACKGROUND AND PURPOSE
PPARγ agonists [thiazolidinediones (TZDs)] are known to exert anti-fibrotic effects in the kidney. In addition, we previously demonstrated that sphingosine kinase 1 (SK-1) and intracellular sphingosine-1-phosphate (S1P), by reducing the expression of connective tissue growth factor (CTGF), have a protective role in the fibrotic process.
EXPERIMENTAL APPROACH
Here, we investigated the effect of TZDs on intracellular sphingolipid levels and the transcriptional regulation of SK-1 in mesangial cells to evaluate potential novel aspects of the anti-fibrotic capacity of TZDs.
KEY RESULTS
Stimulation with the TZDs, troglitazone and rosiglitazone, led to increased S1P levels in rat mesangial cells. This was paralleled by increased SK-1 activity as a consequence of direct effects of the TZDs on SK-1 expression. GW-9662, a PPARγ antagonist, inhibited the stimulating effect of TZDs on SK-1 mRNA and activity levels and intracellular S1P concentrations. Furthermore, SK-1 up-regulation by TZDs was functionally coupled with lower amounts of pro-fibrotic CTGF. SK-1 inhibition with SKI II almost completely abolished this effect in a dose-dependent manner. Moreover, the CTGF lowering effect of TZDs was fully blocked in MC isolated from SK-1 deficient mice (SK-1−/−) as well as in glomeruli of SK-1−/− mice compared with wild-type mice treated with TRO and RSG.
CONCLUSION AND IMPLICATIONS
These data show that TZD-induced SK-1 up-regulation results in lower amounts of CTGF, demonstrating novel facets for the anti-fibrotic effects of this class of drugs.
Keywords: thiazolidinedione, sphingosine kinase, sphingosine-1-phosphate, connective tissue growth factor, mesangial cell
Introduction
Fibrosis is a well-known endpoint of many forms of chronic kidney diseases. One of the most prominent profibrotic cytokines is TGFβ, which supports, for instance, mesangial cell (MC) activation and enhanced extracellular matrix protein production and abnormal glomerular accumulation of these proteins (Schnaper et al., 2003; Leask and Abraham, 2004). Another molecule recently identified as playing a critical role in the progression of fibrosis is the TGFβ-induced gene connective tissue growth factor (CTGF), which is a member of the CCN family of matricellular proteins (Bork, 1993). CTGF expression is induced in the course of fibrotic renal diseases and is proposed to mediate some of the fibrogenic effects of TGFβ, for example, matrix production and increased adhesion and migration of several cell types (Riser et al., 2003; Crean et al., 2004).
Because of their major role in progressive fibrosis, TGFβ as well as CTGF are attractive therapeutic targets for a pharmacological intervention (Boor et al., 2007). Not surprisingly, in the past decade both molecules were in the spotlight of numerous studies investigating the anti-fibrotic potency of several strategies known to influence the TGFβ downstream signalling or to neutralize the effects of CTGF (Zeisberg et al., 2003; Abdel Wahab and Mason, 2004). Most interestingly, thiazolidinediones (TZDs), a class of anti-diabetic drugs, were identified to act in an anti-fibrotic manner in kidney diseases (Isshiki et al., 2000; Ma et al., 2001). Thereby, TZDs [e.g. rosiglitazone (RSG), troglitazone (TRO)] act through activation of the γ isoform of PPARs. In the kidney, PPARγ shows the strongest expression in the collecting duct but is also present in several glomerular cell types such as podocytes and MCs (Yang et al., 1999; Scholz-Pedretti et al., 2002; Miglio et al., 2011). The mode of action of PPARγ is based on its binding to specific PPAR response elements (PPREs) in the promoter region and further activation of the transcription of its target genes, which play important roles in a variety of cellular processes such as lipid and glucose homeostasis (Desvergne and Wahli, 1999).
Independent of their systemic effects on glucose or insulin metabolism during chronic diabetic kidney diseases, several studies have demonstrated that PPARγ agonists directly decrease glomerular TGFβ expression and thereby protect against glomerular fibrosis in non-diabetic diseases (Isshiki et al., 2000; Ma et al., 2001). Recently, we showed that TGFβ not only stimulates the expression of pro-fibrotic CTGF but also increases the activity of sphingosine kinase 1 (SK-1), whereas SK-2 activity was not affected (Ren et al., 2009). Both subtypes, SK-1 and SK-2, are ubiquitously expressed and catalyse the synthesis of the bioactive molecule S1P from sphingosine (Liu et al., 2000; Melendez et al., 2000). S1P is involved in a large number of cellular actions like proliferation and differentiation, survival and migration (Huwiler et al., 2000; Hla, 2003). Our group also demonstrated that SK-1 overexpression reduces CTGF induction in human podocytes, an effect that was exclusively mediated via enhanced intracellular S1P levels (Ren et al., 2009). Moreover, SK-1 depletion or its pharmacological inhibition led to accelerated CTGF expression, suggesting a protective role of SK-1 in renal fibrotic processes.
In this study, we investigated whether there are additional modes of action for the anti-fibrotic capacity of PPARγ agonists possibly linking TZDs action and S1P generation. In this context, we show that TRO and RSG led to increased S1P levels by SK-1, which was preceded by elevated mRNA and protein expression in vitro and in vivo. Pharmacological antagonism with GW-9662 and SK-1 promoter analysis demonstrated that the induction of SK-1 mRNA involves a putative PPRE in the SK-1 promoter. Furthermore, SK-1 up-regulation by TZDs was functionally coupled with lower amounts of pro-fibrotic CTGF. SK-1 inhibition with SKI II almost completely abolished this effect in a dose-dependent manner. Moreover, the CTGF lowering effect of TZDs was fully blocked in MC isolated from SK-1 deficient mice (SK-1−/−) as well as in glomeruli of SK-1−/− mice compared with wild-type mice treated with TRO and RSG. Altogether, the present study reveals new facets to explain the anti-fibrotic potency of TZDs due to their impact on sphingolipid metabolism.
Methods
Chemicals
TRO was obtained from Enzo Life Sciences (Lörrach, Germany). RSG was from Cayman Chemicals (Ann Arbor, MI, USA). MTT (3-(4,5-dimethylthiazol-2-yl)-2,5-diphenyltetrazolium) and SKI II were from Sigma-Aldrich (Munich, Germany). GW-9662 was obtained from Biomol (Hamburg, Germany). Rabbit Pan-specific anti-TGFβ antibody was purchased from R&B Systems (Wiesbaden, Germany). CTGF (L-20), PPARγ (H-100) and β-actin (I-19) antibodies were from Santa Cruz (Heidelberg, Germany); the SK-1-specific antibody was generated and characterized as previously described (Huwiler et al., 2006).
Cell culture and stimulation
Rat and mouse MC were isolated, cultivated and characterized as described previously (Pfeilschifter and Vosbeck, 1991; Hofmann et al., 2008). Human mesangial cells were a gift from Prof. Radeke (see Acknowledgements) and prepared exactly as described previously (Radeke et al., 1990; Francki et al., 1995); the cells were isolated from healthy, tumour-free, tissue of kidneys from donors undergoing tumour nephrectomy. All cell culture media and supplements were purchased from Life Technologies (Karlsruhe, Germany). Passages between 12–19 for rat, 3–15 for human and 10–14 for mouse MC were seeded in 60 mm-diameter dishes and used after reaching confluence. The cells were pre-incubated with Dulbecco's modified Eagle's medium (DMEM) containing 0.1 mg·mL−1 of fatty acid-free BSA for 16 h and then stimulated for 4–16 h with 1–20 µM TRO and 1–50 µM RSG added to the medium (DMEM) from a stock solution in DMSO. Final DMSO concentration did not exceed 0.2% (v v-1). Viability of MC after treatment for 24 h with 1–20 µM TRO and 1–50 µM RSG, respectively, was assessed using the MTT assay and was not reduced by this treatment (data not shown).
RT-PCR analysis
The total RNA, 1.2 µg, was isolated from MC and mice glomeruli with TRIZOL™ reagent (Sigma-Aldrich, Munich, Germany) according to the manufacturer's protocol, and was used for RT-PCR (RevertAid™ first strand cDNA synthesis kit, Fermentas, St.Leon-Rot, Germany) utilizing an oligo (dT) primer for amplification. Real-time PCR (TaqMan®) was performed using the Applied Biosystems 7500 Fast Real-Time PCR System. Probes, primers and the reporter dyes 6-FAM and VIC were from Applied Biosystems (Darmstadt, Germany). The cycling conditions were as following: 95°C for 15 min (one cycle), 95°C for 15 s and 60°C for 1 min (40 cycles). The threshold cycle (Ct) was calculated by the instrument's software (7500 Fast System SDS Software version 1.4). Analysis of mRNA expression levels was performed using the ΔΔCt method and GAPDH for normalization.
Western blot analysis
Stimulated cells were homogenized in lysis buffer and equal amounts of protein (30 µg) were separated on SDS-PAGE, transferred to a nitrocellulose membrane and subjected to Western blot analysis as described previously (Huwiler et al., 1995). For determination of secreted CTGF protein, cell supernatants were centrifuged (10 min; 16,200 g) and the supernatant were precipitated using 70% trichloroacetic acid. After incubation for 30 min on ice and an additional centrifugation (30 min; 16,200 g) pellets were resuspend in Tris buffer (pH 8.5) and used for Western blot analysis.
SK activity assay
In vitro SK-1 activity assay was performed as described previously (Huwiler et al., 2006).
Sphingolipid quantification by LC/MS/MS
Rat MC in 60 mm-diameter dishes were stimulated as indicated. Lipid extraction and LC/MS/MS analysis were performed as described previously (Huwiler et al., 2006).
Cell transfections and SK-1 promoter studies
Different rat SK-1 promoter fragments with sizes of 4009, 2415 and 822 bp were cloned from rat genomic DNA (Novagen, Darmstadt, Germany) by PCR using the same reverse primer: 5′-CGCACTCGAGAGCTGCTTATCGGTGT-3′ and the following forward primers: 4009 bp: 5′-GCAGGTACCAGCCTTGAATTCCTGGGTGC-3′; 2415 bp: 5′-GCAGGTACCGTTCTTGCTCCCTCCAACTC-3′; and 822 bp: 5′-GCAGGTACCGATCCCTTGGAGTCTGTGTG-3′. These fragments were gel-purified and cloned into pBlueScript (pBS) vector (Invitrogen, Darmstadt, Germany) and verified by sequencing. The putative SK-1 promoters were excised using KpnI and XhoI and ligated into the pGL3 Basic luciferase vector (Promega, Mannheim, Germany). Normal rat kidney (NRK) fibroblasts (American Type Culture Collection, Rockville, MD, USA) were cultured in modified Eagle's minimum essential medium supplemented with 5% fetal calf serum and antibiotics. For the experiments, NRK cells (passages 15–30) were seeded in 12-well plates and transfected in serum-free media with 150 ng of reporter plasmid DNA and 30 ng of Renilla luciferase reporter plasmid using FugeneHD (Roche, Mannheim, Germany). After 12 h, NRK cells were pre-incubated with DMEM containing 0.1 mg·mL−1 of fatty acid-free BSA for 8 h and then stimulated with 20 µM TRO and 50 µM RSG for 16 h. To measure SK-1 promoter activity, a luciferase reporter gene assay was performed using a Lumat LB9507 luminometer (Berthold Detection Systems, Pforzheim, Germany). Values for SK-1 promoter activity were calculated from the ratio of firefly to Renilla luciferase activities and expressed as a percentage of control.
Site-directed mutagenesis of the SK-1 promoter
Site-directed mutagenesis of PPRE7 (mutation of −261 to −251 bp) in SK-1 promoter fragments rSK-1_I (4009 bp) and rSK-1_III (822 bp) was carried out with ‘QuickChange Site-Directed Mutagenesis Kit’ (Stratagene Technologies, Waldbronn, Germany). The primer pair (mutation sides are underlined) used for ΔPPRE7 was for.: 5′-GGCCTCTGGTTCCGCACCCTGTCC-3′ and rev.: 5′-GGACAGGGTGCGGAACCAGAGGCC-3′. The mutations were confirmed by DNA sequencing.
Preparation of nuclear extracts
After treatment with TRO (20 µM) and RSG (50 µM) for 16 h, nuclear extracts from 1 × 10⁶ rat MC were prepared. The cells were washed with ice-cold PBS, and re-suspended in buffer containing 10 mM HEPES (pH 7.9), 10 mM KCl, 0.1 mM EDTA, 0.1 mM EGTA, 1 mM DTT and 0.5 mM PMSF, and incubated on ice for 15 min. Cells were then lysed by adding 0.1% Nonidet P-40 and vortexed vigorously for 10 s. Nuclei were pelleted by centrifugation at 16,200 g for 1 min at 4°C and resuspended in buffer containing 20 mM HEPES (pH 7.9), 25% glycerol, 400 mM KCl, 0.1 mM EDTA, 0.1 mM EGTA, 1 mM DTT and 0.5 mM PMSF, and incubated on ice for a further 20 min. The resultant supernatants from centrifugation at 16,200 g for 20 min at 4°C were obtained as nuclear fractions.
Electrophoretic mobility shift assay
For the labelling of the DNA and the setup of the reaction mixture for the EMSA, the DIG gel shift kit (Roche, Mannheim) was used following the supplier's protocol. The following oligonucleotides were annealed: PPRE7 (for.: 5′-GGCCTCTGGTTGGGCACCCTGTCC-3′, rev.: 5′-GGACAGGGTGCCCAACCAGAGGCC-3′) and ΔPPRE7 (see Site-directed mutagenesis section), 100 ng double-stranded DNA-probes were labelled with digoxigenin-11-ddUTP (DIG). Thereafter, 0.4 ng of labelled DNA-probes and 5 µg of nuclear extracts were used for EMSA. For competition experiments, unlabelled double-stranded oligonucleotides were pre-incubated in 20-fold excess with the protein for 20 min before labelled oligonucleotides were added. All samples were analysed by electrophoresis on 6% native polyacrylamide gels using 0.5 × TBE running buffer for 1.5 h at 80 V and transferred to a positively charged nylon membrane. The DIG-labelled DNA was detected by chemiluminescence according to the manufacturer's protocol.
Animal experiments
All animal care and experimental procedures were conducted in accordance with the German Animal Protection Law and were approved by the Ethics Review Committee of the District Governments of Darmstadt, Germany. Three- to four-month-old female wild-type C57BL/6NCrl and SK-1−/− mice (33 mice in total) (Hofmann et al., 2008) with a body weight (±SEM) of 23.45 ± 0.15 g (wild-type) and 22.67 ± 0.47 g (SK-1−/−) were kept in a room controlled for temperature (22 ± 2°C), relative humidity (50–60%) and light (12 h light/dark cycle) and treated with TRO and RSG (15 mg·kg−1 of body weight) dissolved in DMSO : oil (1:15; v : v) by gavage as described previously (Koch et al., 2008). Control animals were treated with 200 µL DMSO/oil. Food and water were available ad libitum during the whole experiment. After 24 h, the mice were killed by decapitation under anaesthesia with isoflurane (4%) and kidneys (n= 8 per group for wild-type; n= 3 per group for SK-1−/−) were extracted and taken for isolation of glomeruli using a differential sieving method.
Statistical analysis
Means of treatment and control groups were compared by one-way anova using the Minitab Statistical Software Rel. 13.0 (Minitab, State College, PA, USA). Differences with P < 0.05 were considered to be significant.
Results
TZDs stimulate cellular S1P generation by SK-1 activation
To test whether PPARγ agonists act in an anti-fibrotic manner via the activation of SK-1 and enhanced intracellular S1P levels, we first analysed the effect of TZDs on the sphingolipid levels in rat renal MC. As shown in Figure 1, cellular S1P levels measured by mass spectrometry (MS) were significantly higher after incubation with different concentrations of TRO and RSG at the time points indicated. The absolute value of S1P in control samples was 2.59 ± 0.36 ng·mg−1 protein (mean ± SEM; n= 4–5). Concentrations of sphingosine (14.02 ± 0.32 ng·mg−1 protein) and C16-ceramide (9.75 ± 0.69 ng·mg−1 protein) were not significantly affected by this treatment (data not shown, absolute values of control samples; means ± SEM; n= 4–5). Next, we analysed the activity of SK-1 after TZD treatment to see whether the increase in intracellular S1P levels is due to altered S1P generation and/or degradation. As illustrated in Figure 2A, TRO and RSG treatment of rat MC for 16 h led to a significant increase in SK-1 activity. In parallel, SK-1 protein levels were also significantly enhanced (Figure 2B). We detected the highest protein expression after 16 h (Figure 2C). This was preceded by enhanced SK-1 mRNA expression, which we detected in a dose-dependent manner after 8 h (Figure 2D). Increased SK-1 mRNA levels were also detectable after 4 and 16 h stimulation with 10 µM TRO and 20 µM RSG (Figure 2E). In contrast, SK-2 mRNA levels were not affected by TZD treatment (Figure 2D, E). Moreover, the mRNA levels of S1P degrading enzymes [S1P lyase, S1P phosphatase (SPP)1 and SPP2] remained constant (data not shown).
Figure 1.
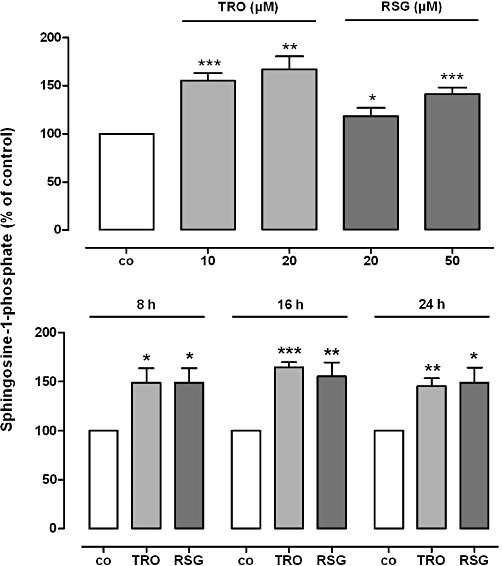
Effect of TRO and RSG on cellular S1P levels in rat MCs. Quiescent cells were stimulated for 24 h with the indicated concentrations of TRO and RSG (upper panel) or for the indicated time points with 20 µM TRO and 50 µM RSG (lower panel). Lipid concentrations were measured using LC/MS/MS as described in the Methods section. S1P levels in treated cells are shown relative to control cells [vehicle alone; co, S1P conc. ± SEM = 2.59 ± 0.36 ng·mg−1 protein]. Values are means ± SEM (n= 4–5). *P < 0.05, **P < 0.01, ***P < 0.001, compared with the respective control cells.
Figure 2.
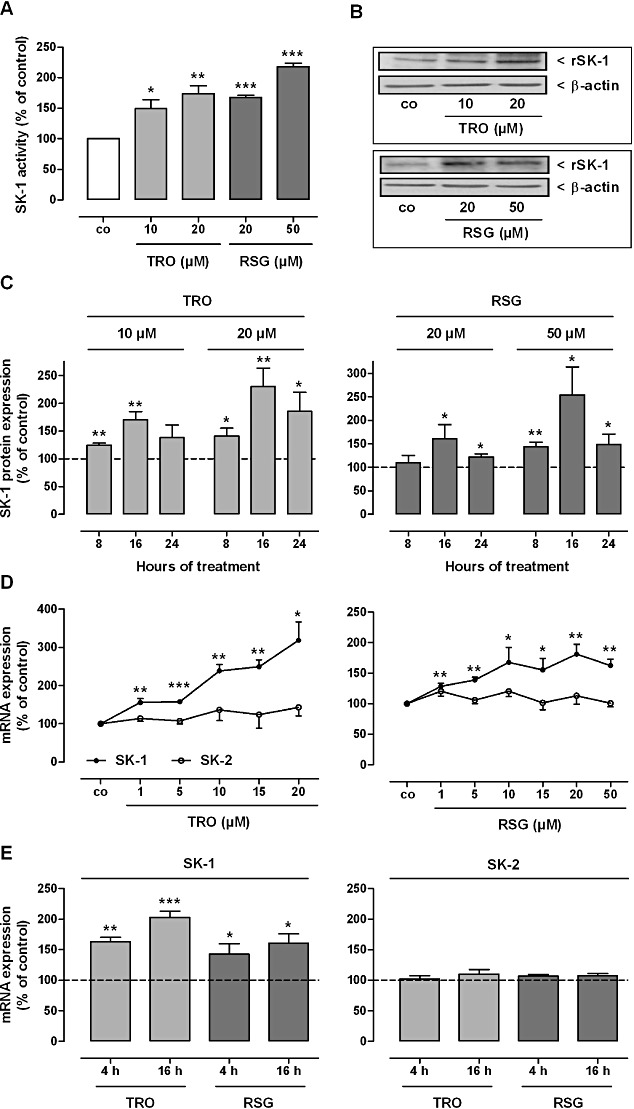
Effect of TRO and RSG on SK-1 activity (A) and protein (B, C) and mRNA (D, E) expression in rat MCs. (A) Quiescent cells were stimulated for 16 h with the indicated concentrations of TRO and RSG. Thereafter, cell lysates containing equal amounts of proteins were taken for in vitro SK-1 activity assays as described in the Methods section. Data are shown relative to control cells (vehicle alone; co). (B, C) Quiescent cells were stimulated for 16 h (B) or for the indicated time points (C) with either vehicle or the indicated concentrations of TRO and RSG. Thereafter, cell lysates were processed for Western blot analysis using specific antibodies against rat SK-1 at a dilution of 1:1000, or β-actin at a dilution of 1:3000. Bands corresponding to SK-1 and β-actin in treated cells were densitometrically evaluated and are shown relative to control cells (vehicle alone; dashed lines). Western blot data in (B) are representative of three independent experiments giving similar results. (D, E) Quiescent cells were stimulated for 8 h with the indicated concentrations of TRO and RSG (D); or with either vehicle or 10 µM of TRO and 20 µM of RSG for the indicated time periods (E). Thereafter, total RNA was extracted from cells and mRNA expression levels were determined by real-time detection RT-PCR (TaqMan®) analysis using GAPDH mRNA expression levels for normalization. mRNA expression levels of SK-1 and SK-2 in the treated cells are shown relative to control cells [vehicle alone; dashed lines (E)]. All values are means ± SEM (n= 4–6). *P < 0.05, **P < 0.01, ***P < 0.001, compared with the respective control cells.
To see whether the effect of TZDs on SK-1 expression in rat MC also occurs in other species, we used primary human and mouse glomerular MC. As shown in Figure 3A, we were able to reproduce the TZD-dependent induction of SK-1 mRNA expression in human MC. In both species, we also detected increased amounts of SK-1 protein after incubation with higher concentrations of TRO or RSG for 16 h (Figures 3B, C, 4D, E). Next, we analysed whether the TZD-mediated induction of SK-1 expression also occurs in vivo. TaqMan® and Western blot analysis of SK-1 in glomeruli isolated from C57BL/6 mice treated with 15 mg·kg−1 body weight TRO or RSG for 24 h clearly demonstrated that the expression was significantly up-regulated compared with the control mice (Figure 4A–C).
Figure 3.
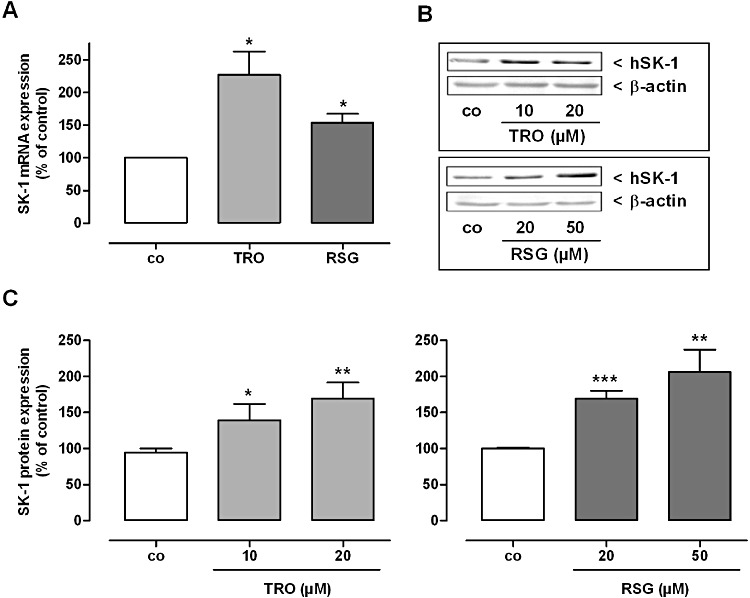
Effect of TRO and RSG on SK-1 mRNA (A) and protein expression (B, C) in human MCs. Quiescent cells were stimulated for 16 h with 20 µM TRO and RSG (A) or with the indicated concentrations (B, C) of TRO and RSG. (A) Thereafter, total RNA was extracted from cells and SK-1 mRNA expression levels were determined by real-time detection RT-PCR (TaqMan®) analysis using GAPDH mRNA expression levels for normalization. mRNA expression levels of SK-1 in the treated cells are shown relative to control cells (vehicle alone; co). Values are means ± SEM (n= 3). (B, C) Cell lysates were processed for Western blot analysis using specific antibodies against human SK-1 at a dilution of 1:1000, or β-actin at a dilution of 1:3000. Bands corresponding to SK-1 and β-actin in treated cells were densitometrically evaluated and are shown relative to control cells (co). Western blot data in (B) are representative of three independent experiments giving similar results. All values are means ± SEM (n= 4). *P < 0.05, **P < 0.01, ***P < 0.001, compared with the respective control cells.
Figure 4.
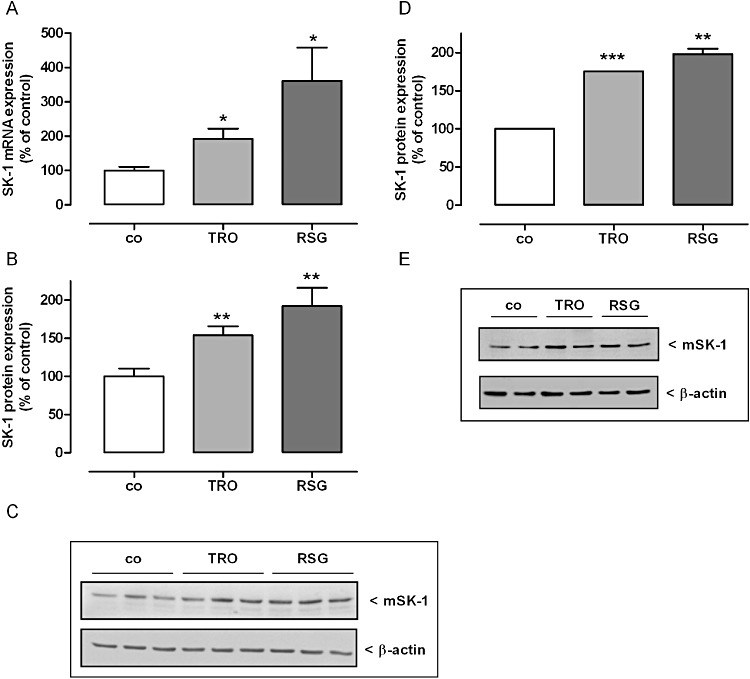
Effect of TRO and RSG on SK-1 mRNA (A) and SK-1 protein expression (B, C) in mouse glomeruli and mouse MCs (D, E). (A–C) C57BL/6NCrl mice were treated with either vehicle or with 15 mg·mg−1 body weight TRO and RSG once by gavage. After 24 h kidneys were harvested and taken for isolation of glomeruli by using a differential sieving method. (A) Total RNA was extracted and mRNA expression levels were determined by real time detection RT-PCR (TaqMan®) analysis using GAPDH mRNA expression levels for normalization. mRNA expression levels of SK-1 in the treated groups are shown relative to control group (co). (B, C) Protein lysates of mouse glomeruli were processed for Western blot analysis using specific antibodies against mouse SK-1 at a dilution of 1:1000 or β-actin at a dilution of 1:3000. Bands corresponding to CTGF and β-actin in the treated groups were densitometrically evaluated and are shown relative to control group (co, vehicle alone). (C) Western blots specific for SK-1 mice are shown for 3 mice per group. (C, D) Quiescent mouse MCs were stimulated for 16 h with either vehicle or 20 µM TRO and 50 µM RSG. Cell lysates were processed for Western blot analysis as described earlier. Western blot data in (D) are representative of three independent experiments giving similar results. Bands corresponding to SK-1 and β-actin in either treated groups cells were densitometrically evaluated and are shown relative to control group or cells (co, vehicle alone). All values are means ± SEM [n= 8 per group (A, B); n= 3 (D)]. *P < 0.05, **P < 0.01, ***P < 0.001, compared with the respective controls.
To further analyse the impact of PPARγ activation on the transcriptional regulation of SK-1 we investigated the effect of the irreversible PPARγ inhibitor GW-9662 on TZD-induced SK-1 expression. To this end, we pretreated rat MC with 20 µM GW-9662 for 4 h and analysed the SK-1 mRNA expression after additional treatment with 10 µM TRO or 20 µM RSG for 16 h. As illustrated in Figure 5A, GW-9662 completely abolished the TZD-induced increase in SK-1 mRNA, thus indicating a direct correlation between PPARγ activation and SK-1 expression. Consistent with the mRNA results, TZD-induced increase in SK-1 activity and intracellular S1P concentrations were also completely abolished by the pretreatment with GW-9662 (Figure 5B, C). GW-9662 led to a significantly lower basal SK-1 mRNA expression and also activity compared with the untreated control cells (Figure 5).
Figure 5.
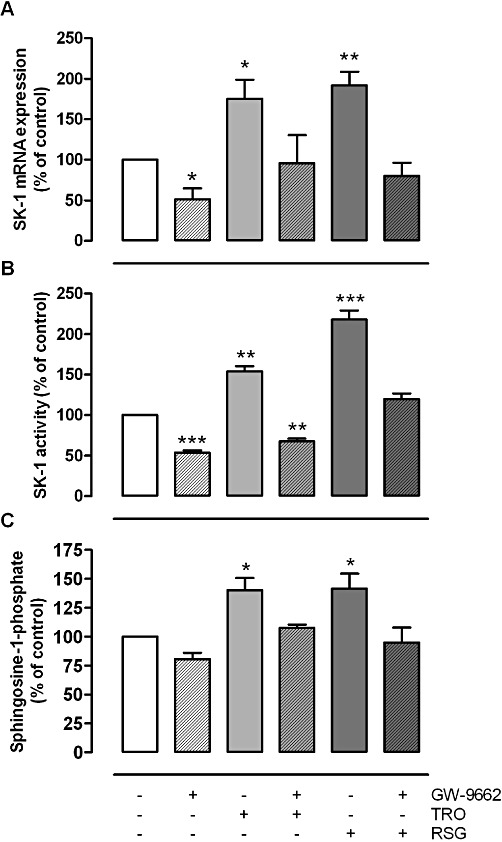
Inhibitory effect of the PPARγ antagonist GW-9662 on TRO and RSG induced increase in mRNA expression (A), SK-1 activity (B) and S1P levels (C) in rat MCs. Quiescent cells were pretreated for 4 h with GW-9662 (20 µM) and then stimulated for 16 h with TRO [10 (A, B) or 20 (C) µM) and RSG (20 (A, B) or 50 (C) µM]. (A) Thereafter, total RNA was extracted from cells and mRNA expression levels were determined by real-time detection RT-PCR (TaqMan®) analysis using GAPDH mRNA expression levels for normalization. (B) Cell lysates were taken for in vitro SK-1 activity assays as described in the Methods section. Data are shown relative to control cells (vehicle alone; co). (C) Thereafter, S1P concentrations were measured using LC/MS/MS as described in the Methods section. Sphingolipid levels in treated cells are shown relative to control cells (vehicle alone; co). All values are means ± SEM (n= 3). *P < 0.05, **P < 0.01, ***P < 0.001, compared with the respective control cells.
Next, we performed promoter studies to evaluate whether putative PPREs in the rat SK-1 promoter region are responsible for TZD-mediated transactivation of SK-1. Sequence analysis of the SK-1 promoter revealed seven putative PPREs as illustrated in Figure 6A. The sequences of the PPREs are shown in Table 1. First, we cloned a 4009 bp fragment (rSK-1_I; containing all PPREs) of the rat SK-1 promoter and two shorter fragments of 2415 (rSK-1_II; containing PPRE5-7) and 822 bp (rSK-1_III; containing only PPRE7) respectively. These fragments were fused to a luciferase reporter construct and transfected into NRK fibroblast cells, as rat MC are known to show very low transfection efficiency (Madry et al., 2001). NRK cells express equal amounts of PPARγ compared with rat MC, as demonstrated by Western blot analysis using a specific antibody against rat PPARγ (data not shown). As seen in Figure 6B, TRO and RSG stimulated the activity of all three promoter fragments. Most importantly, rSK-1_III, which contains only one putative PPRE (PPRE7), was also activated by TZDs. When the PPRE7 was mutated (ΔPPRE7) in rSK-1_III, the effects of the TZDs were completely abolished (Figure 6C). Whereas mutation of PPRE7 in rSK-1_I still led to TZD-induced SK-1 promoter activation, although to a reduced degree, indicating that there is at least one additional functionally important PPRE within the SK-1 promoter. To confirm the functional relevance of PPRE7 directly binding PPARγin vitro, we performed a gel shift assay (EMSA). As shown in Figure 7, we were able to detect a DNA-protein complex using nuclear extracts from either vehicle or TRO and RSG treated rat MC together with DIG-labelled oligonucleotide corresponding to PPRE7 (lanes 2, 4, 5). Formation of the DNA-protein complex was blocked in a competitive manner in the presence of an excess of unlabelled specific oligonucleotide (Figure 7, lane 3). The mutated PPRE7 (ΔPPRE7) did not cause specific complex formation (lane 7–9). These data strongly suggest that PPRE7 is important for the effect of TZDs on SK-1 expression. However, to confirm that PPARγ binds to PPRE7, supershift analysis of the complex composition will be required.
Figure 6.
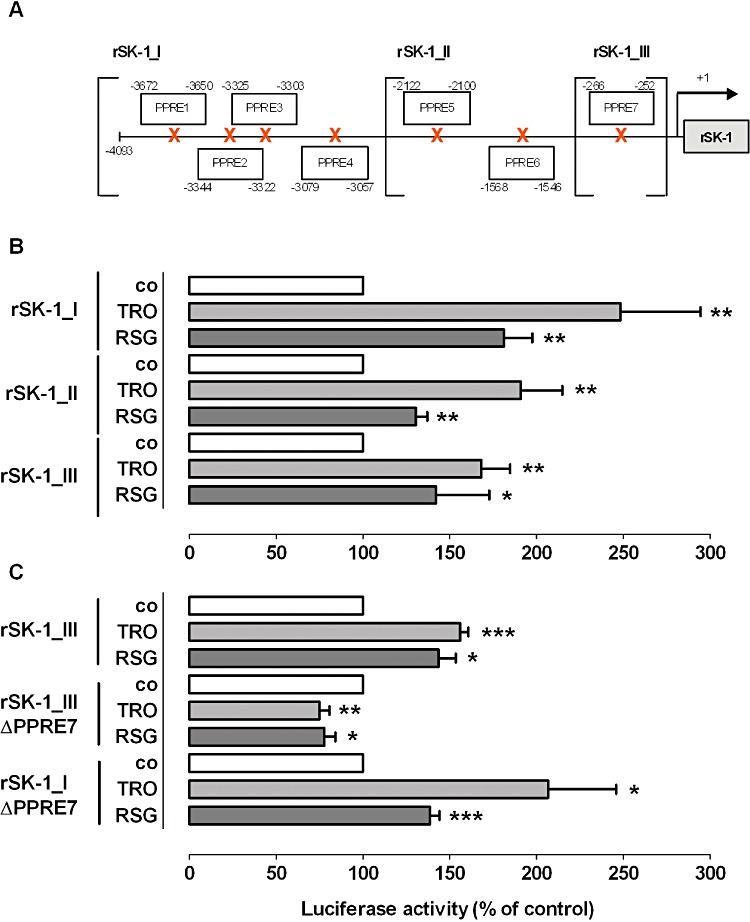
Effect of TRO and RSG on SK-1 promoter activity. (A) Schematic representation of the seven putative PPAR response elements (PPREs) in the rat SK-1 promoter. NRK cells were transfected with DNA containing the different rat SK-1 promoter fragments without (B) and with mutations of PPRE7 (C) as described in the Methods section. Quiescent cells were stimulated for 16 h with 20 µM TRO and 50 µM RSG. The ratio between firefly and Renilla luciferase activities was calculated. Results are expressed as percentage of control cells (vehicle alone; co). All values are means ± SEM (n= 4–5). *P < 0.05, **P < 0.01, compared with the respective control cells.
Table 1.
PPRE sequences predicted from in silico analysis of rat SK-1 promoter using MatInspector software (Genomatix Software GmbH, Munich, Germany)
| PPRE denomination | Sequence (5′– 3′) |
|---|---|
| PPRE 1 | GTGTGTCCTCTGTCCCTGTGCAC |
| PPRE 2 | TGGAGATAGGATAGAGTTCTTTA |
| PPRE 3 | TTTAGGAAGGGAAAGGGTCTAGA |
| PPRE 4 | CAGTCAACTTTGCCCCACGCTCG |
| PPRE 5 | CGATGCAAGGAGAGAGGTGGGTG |
| PPRE 6 | GGTTCAGCTTTCTCCTGAAAGGC |
| PPRE 7 | TGGTTGGGCACCCTGTCCACGTG |
Figure 7.
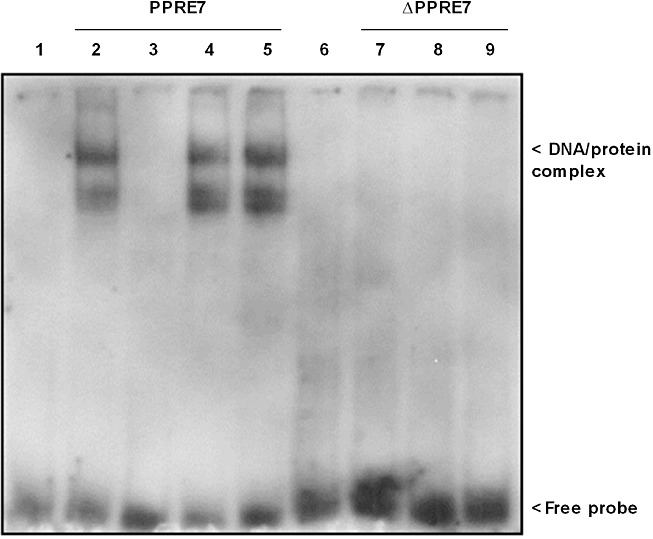
Binding of nuclear extracts from rat MC treated for 16 h with 20 µM TRO and 50 µM RSG to PPRE7 of rat SK-1 promoter using DIG-labelled oligonucleotides corresponding to either wild-type (PPRE7; lanes 2–5) or mutated PPRE7 (ΔPPRE7; lanes 7–9). After treatment of quiescent cells with TZDs and the subsequent preparation of nuclear extracts, an electrophoretic mobility shift assay was performed using 5 µg of the nuclear extracts and 0.4 ng DIG-labelled probes (lanes 1 and 6, free probes; lanes 2 and 7, vehicle alone; lanes 4 and 8, 20 µM TRO, lanes 5 and 9, 50 µM RSG). A competitive assay with the addition of 20-fold unlabelled PPRE7 oligonucleotide was used as control for non-specific binding (lane 3). Representative data of two independent experiments are shown.
TZD-dependent SK-1 activation reduces CTGF expression
Previously, we showed that SK-1 overexpression and enhanced intracellular S1P levels reduce CTGF induction in podocytes (Ren et al., 2009). Furthermore, we observed a comparable CTGF lowering effect in human MCs (S. Ren and A. Huwiler, unpublished observations), which points to a general protective role of SK-1 activity in the fibrotic process. We therefore decided to determine the expression of CTGF, which is considered as an important factor in the fibrotic response (Gupta et al., 2000). As shown in Figure 8, the protein expression and subsequent secretion of CTGF was reduced after treatment of rat, human and mouse MC with different concentrations of TRO and RSG for 16 h. Then, we analysed whether the observed CTGF reduction after treatment with the TZDs is mediated by the enhanced SK-1 activity; we used the SK-1 enzyme inhibitor SKI II, which strongly inhibits SK-1 directly by triggering its lysosomal degradation (French et al., 2003; Ren et al., 2010). In accord with the results of Ren et al. (2009), we detected higher amounts of secreted CTGF after treatment of rat MC with TGFβ or SKI II (Figure 9A), indicating a protective role of SK-1 even in our cell model. Further, TZD-treated rat MCs were stimulated in parallel with increasing concentrations of SKI II (Figure 9B, C). SKI II in a dose-dependent manner significantly reversed the TZD-induced reduction in secreted CTGF in both the TRO and RSG treated cells. However, compared with the control cells, SKI II, up to 10 µM, did not completely attenuate the CTGF reduction induced by the TZDs. Moreover, to confirm the effect of SKI II, we used MC isolated from SK-1−/− mice. The ability of the TZDs to decrease CTGF, observed in wild-type mouse MC, was completely abolished in SK-1−/− MC (Figure 10). Finally, we checked the in vivo effect of TZD treatment on CTGF expression using SK-1−/− mice and corresponding C57BL/6 wild-type mice. In parallel with the induction of SK-1 (Figure 4A–C), we measured lower amounts of CTGF in the glomeruli of wild-type mice, an effect that was completely abolished in SK-1−/− mice (Figure 11). These experiments using pharmacological or genetic approaches to inhibit SK-1 support the hypothesis that activation of SK-1 by TZDs is a critical event for their CTGF lowering and anti-fibrotic actions.
Figure 8.
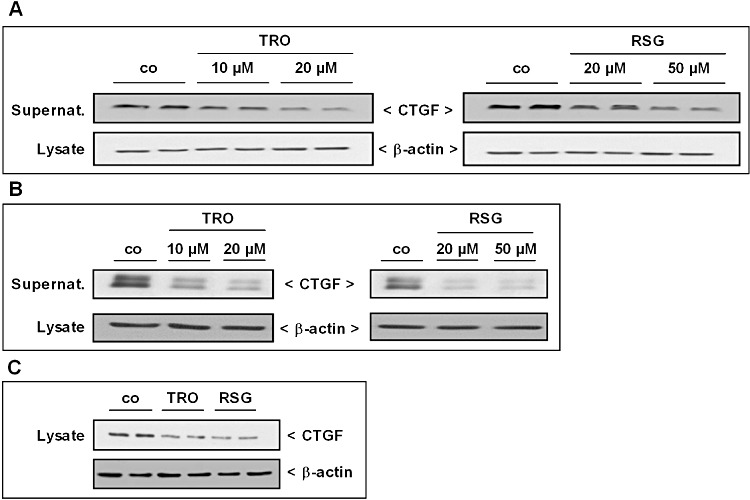
Effect of TRO and RSG on CTGF protein expression in rat, human and mouse MCs. (A, B) Quiescent rat (A) and human (B) cells were stimulated for 16 h with the indicated concentrations of TRO and RSG. Thereafter, supernatants were taken for protein precipitation using trichloroacetic acid and for the determination of secreted CTGF protein by Western blot analysis using an antibody against CTGF at a dilution of 1:1000. Corresponding cell lysates were taken for β-actin analysis. (C) Quiescent mouse MCs isolated from C57BL/6 mice were stimulated for 16 h with either vehicle, 20 µM TRO or 50 µM RSG. Lysates were processed for Western blot analysis using an antibody against CTGF and β-actin as described earlier. Representative CTGF Western blot data of three independent experiments are shown (the corresponding mouse SK-1 data are shown in Figure 4E).
Figure 9.
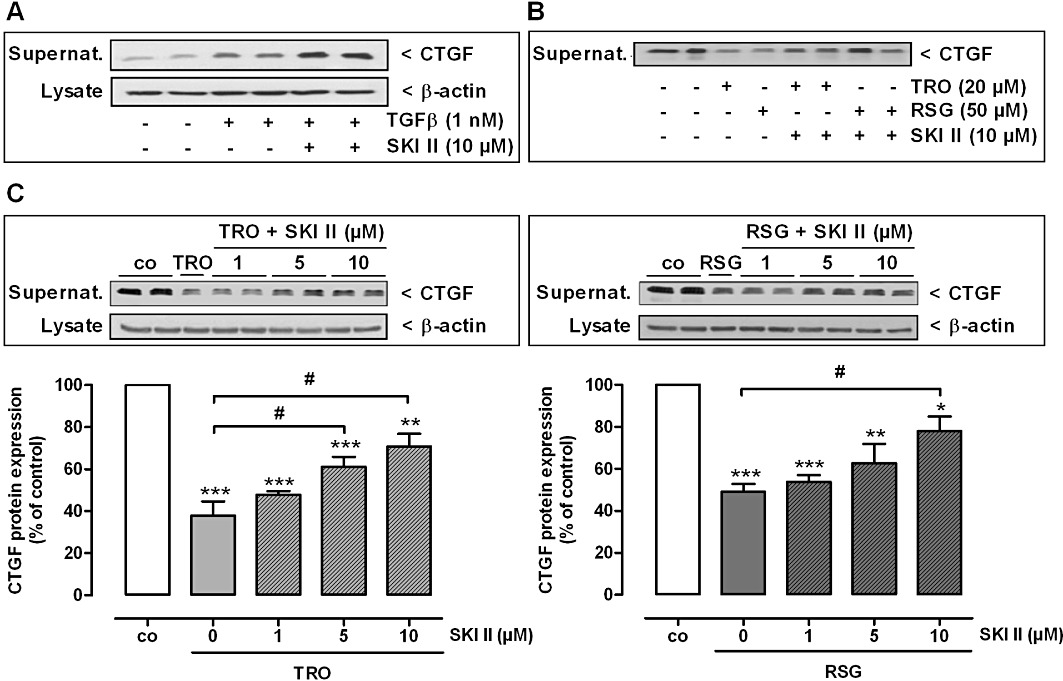
Effect of TGFβ, TRO and RSG on CTGF protein expression under SK-1 inhibitory conditions in rat MCs. (A) Quiescent cells were pre-incubated for 1 h with SK-1 inhibitor II (SKI II) and stimulated for 24 h with the indicated concentration of TGFβ. (B, C) Quiescent cells were stimulated in parallel for 16 h with either 20 µM TRO or 50 µM RSG and the indicated concentrations of SKI II. After all experiments, supernatants were taken for protein precipitation using trichloroacetic acid and for the determination of secreted CTGF protein by Western blot analysis using an antibody against CTGF at a dilution of 1:1000. (A, C) Corresponding cell lysates were taken for β-actin analysis. (C) Bands corresponding to CTGF and β-actin in treated cells were densitometrically evaluated and are shown relative to control cells (co, vehicle alone). All Western blot data are representative of three to four independent experiments giving similar results. All values are means ± SEM (n= 4). *P < 0.05, **P < 0.01, ***P < 0.001, compared with the respective control cells (co). #P < 0.05 compared with the TRO and RSG treated cells as indicated.
Figure 10.
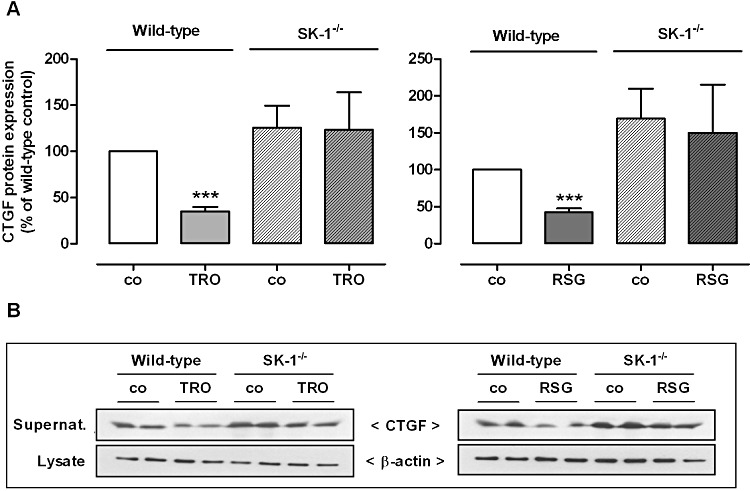
Effect of TRO and RSG on CTGF protein expression in wild-type and SK-1 deficient (SK-1−/−) mouse MCs. Cells isolated from either wild-type C57BL/6 mice or SK-1−/− mice were treated for 16 h with either vehicle, 20 µM TRO or 50 µM RSG. Thereafter, supernatants were taken for protein precipitation using trichloroacetic acid and for the determination of secreted CTGF protein by Western blot analysis using an antibody against CTGF at a dilution of 1:1000. The corresponding cell lysates were taken for β-actin (1:3000) analysis. (A) Bands corresponding to CTGF and β-actin in treated cells were densitometrically evaluated and are shown relative to control cells (co, vehicle alone). (B) All Western blot pictures are representative of three independent experiments giving similar results. All values are means ± SEM (n= 3–4). **P < 0.01, ***P < 0.001, compared with the wild-type control cells (A; co).
Figure 11.
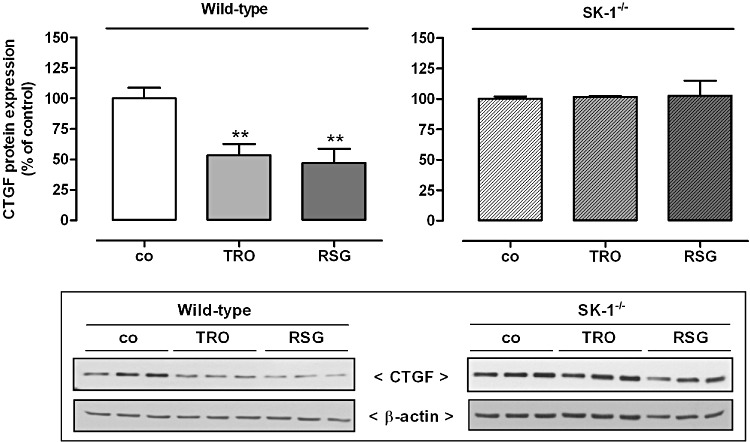
Effect of TRO and RSG on CTGF protein expression in mouse glomeruli. Wild-type C57BL/6NCrl and SK-1 deficient (SK-1−/−) mice were treated with either vehicle, or 15 mg·kg−1 body weight TRO or RSG once by gavage. After 24 h kidneys were harvested and taken for isolation of glomeruli by using a differential sieving method. Protein lysates of mouse glomeruli were processed for Western blot analysis using specific antibodies against mouse CTGF at a dilution of 1:1000 or β-actin at a dilution of 1:3000. Bands corresponding to CTGF and β-actin in the treated groups were densitometrically evaluated and are shown relative to control group (co, vehicle alone). Values are means ± SEM (n= 8 per group for wild-type; n= 3 per group for SK-1−/−). **P < 0.01, compared with the respective controls. Representative Western blot data specific for CTGF in wild-type mice are shown (The corresponding SK-1 data are shown in Figure 4C). SK-1−/− CTGF Western blot data are shown for three mice per group.
Discussion and conclusions
The development of TZDs for the treatment of type 2 diabetes mellitus several decades ago and the finding that these drugs act via PPARγ activation underline the therapeutic relevance of this nuclear receptor. Despite some recent drawbacks, current findings of Spiegelman and colleagues (Choi et al., 2010) raise the possibility for a revival of slightly modified PPARγ ligands to treat diabetes without undesirable cardiovascular side effects (Nissen and Wolski, 2007; Houtkooper and Auwerx, 2010). Further, recent studies have revealed novel aspects for the clinical use of TZDs. Most interestingly, it has become clear that TZDs are not only able to ameliorate glomerulosclerosis and kidney dysfunctions in diabetic nephropathy but also exert beneficial actions in nondiabetic chronic kidney diseases (Wu et al., 2009), in which fibrosis is one of the common endpoints of disease progression. Recently, our group added a new facet to this complex process. Ren et al. (2009) demonstrated that TGFβ not only stimulated the expression of pro-fibrotic CTGF but also increased the activity of SK-1 in human podocytes. Furthermore, overexpression of SK-1 and elevated intracellular S1P levels reduced the expression of CTGF, whereas pharmacological inhibition or depletion of SK-1 led to a higher CTGF expression. Altogether, Ren et al. (2009) clearly showed that SK-1 may act as a brake in a fibrotic event by impeding CTGF expression, promoting the idea that targeting SK-1 might prevent fibrosis in chronic kidney disease (Long and Price, 2009).
From the present study, we suggest that the anti-fibrotic potency of TZDs is due to SK-1 activation and subsequent CTGF reduction (Figure 12). In accord with findings of Ren et al. (2009), we showed that inhibition of SK-1 with SKI II lead to enhanced TGFβ-dependent levels of secreted CTGF in rat MC (Figure 9A), substantiating our hypothesis of the protective role of SK-1 also in this cell type. We and others previously identified several transcriptionally active elements in the SK-1 promoter, which confirm that SK-1 expression, in contrast to SK-2, is tightly regulated by numerous transcriptional mechanisms (Nakade et al., 2003; Schwalm et al., 2008; 2010). In this context, we demonstrated for the first time that PPARγ agonists enhance SK-1 expression in MC derived from different species (rat, human and mouse) as well as in mouse glomeruli (Figures 2–4), which may be due to the direct activation and DNA-protein interaction of at least one functional PPRE in the promoter region of SK-1 (Figures 6, 7). SK-1 activation was coupled to elevated intracellular S1P levels (Figure 1), an effect that was abolished by the PPARγ antagonist GW-9662 (Figure 5). Most interestingly, GW-9662 was able to down regulate SK-1 expression even in the absence of TZDs. To further address this point, we pre-incubated our cells for 16 h with DMEM containing no serum and fatty acid-free BSA (see Methods) to rule out the possibility that free fatty acids could have partially activated PPARγ in the absence of TZDs. Our findings indicate that further lipid mediators are also able to modulate PPAR activity and subsequent SK-1 expression. In this context, it is noteworthy that pretreatment of serum with charcoal attenuated the inhibitory action of GW-9662 under basal conditions (data not shown), thus further corroborating the possibility that either GW-9662 has effects independent of PPARγ and/or further lipid mediators removed by charcoal treatment have an impact on SK-1 expression. This will require further experimental analysis.
Figure 12.

Schematic overview of the suggested link between PPARγ agonists, SK-1 expression and activity, intracellular S1P generation and CTGF expression in MCs.
Functionally, our data show that the up-regulation of SK-1 and subsequent intracellular S1P by TZDs is coupled to lower amounts of the important pro-fibrotic factor CTGF (Figures 9–11). Previously, it was reported that TZDs act directly by interfering with the TGFβ/Smad pathway (Kawai et al., 2009), which in turn results in lower expression of CTGF (Fu et al., 2001; Wang et al., 2007). In our experimental setup, a neutralizing pan-specific TGFβ antibody did not block the TZD-induced reduction of secreted CTGF (data not shown). Together our data, obtained using the SK-1 inhibitor SKI II (Figure 9B, C) and SK-1−/− MC (Figure 10), suggest that the CTGF lowering effect of TZDs is due to the increase in SK-1 activity and intracellular S1P generation. To make this story even more complex, S1P can also act extracellularly by binding to five different S1P receptors (S1P1–5). We previously demonstrated that extracellular S1P mimics TGFβ-dependent CTGF induction via cross-activation of Smad signalling cascade (Xin et al., 2004; Ren et al., 2009). Using suramin, which was proposed as a S1P3 receptor antagonist, we demonstrated that this receptor subtype could be involved in the Smad cross-activation by S1P and responsible for the increase in CTGF induced in MC (Xin et al., 2004). These results raise the question whether TZDs increase the extracellular S1P levels and the expression of S1P receptors. However, due to technical limitations, mainly in the sensitivity of our LC/MS/MS analysis, we were not able to detect S1P in the supernatant of MC. In this context, it is worth mentioning that we measured enhanced mRNA expression levels only of the S1P1 receptor after the incubation of rat MC with either TRO or RSG (data not shown). So far, we did not fully understand the functional consequence of this induction. Remarkably, the mRNA expression of S1PR3, a possible candidate for mediating CTGF induction via extracellular S1P, remains unaffected (data not shown). In consequence, we would exclude extracellular effects of S1P on CTGF levels after TZD treatment in our experimental model.
Further, additional studies will be necessary to address the question whether TZDs alter SK-1 activation and S1P generation to reduce CTGF under diabetic conditions. It was shown that in high glucose situations SK-1 activity is enhanced (Wang et al., 2005). The authors proposed a role of SK-1 in diabetic vasculo- and nephropathies without addressing the question whether SK-1 positively promotes diabetic nephropathy or is induced as a rescue mechanism to counter-regulate disease progression. Recently, Ren et al. (2009) clearly showed that SK-1 induced under diabetic conditions exerts protective functions and its genetic depletion in mice resulted in a more severe kidney disease. Therefore, the role of SK-1 and S1P for the known renoprotective and anti-fibrotic effects of TZDs should be evaluated in models of streptozotocin-induced diabetic nephropathy and subsequent renal fibrosis.
At present, we do not understand how intracellular S1P regulates CTGF expression. There are only a few reports identifying intracellular targets for S1P. In this context, Spiegel and colleagues identified the E3 ubiquitin ligase TRAF2 as one intracellular target for S1P (Alvarez et al., 2010). Moreover, the same group demonstrated that nuclear S1P specifically binds to and inhibits the enzymatic activity of histone deacetylases (HDACs)1 and 2 (Hait et al., 2009). Targeting the regulation of HDAC activity in vivo has implications for the development of novel therapeutic approaches for several human diseases. In this context, HDACs have emerged as key targets to reverse aberrant epigenetic changes associated with cancer (Minucci and Pelicci, 2006). Therefore, intracellular S1P may influence the balance and dynamic turnover of histone acetylation and positively regulate the progression of cancer by inhibiting HDAC activity. In the present study, we demonstrated that PPARγ agonists enhanced intracellular S1P levels, by increasing the expression and activation of SK-1. It was proposed that several cancer cell lines have increased SK-1 expression and are dependent on SK-1 for survival and growth (Pyne and Pyne, 2010). In addition, inhibition of SK-1 has been suggested as a powerful approach to treat tumour growth, as shown in a mouse xenograft model (Gupta et al., 2000; French et al., 2006). Moreover, S1P can additionally stimulate cancer growth, survival and cell motility by activating S1P receptors (Pyne and Pyne, 2010). The role of PPARγ itself in tumour progression is a matter of debate; PPARγ has been implicated both as a tumour suppressor and tumour promoter (Lehrke and Lazar, 2005). PPARγ is expressed in many cancer cells, including those derived from colon, lung, breast and prostate. In general, antiproliferative and pro-apoptotic responses to PPARγ ligands have been reported, suggesting that PPARγ might be involved in cancer suppression (Tachibana et al., 2008). On the other hand, some studies reported that TZDs promote colon tumour growth in mice that are prone to colon polyps due to a mutation in the APC gene (Lefebvre et al., 1998; Saez et al., 1998). These data appear to be an exception, but nevertheless they suggest that under certain conditions PPARγ could also act as a tumour promoter. Additionally, it should be noted that the association of CTGF with tumour development and growth is still debatable. In this context, reduced CTGF expression was reported for various tumours, including lung cancer and Wilms tumour (nephroblastoma; Chien et al., 2006; Li et al., 2008), leading to the speculation that CTGF could be a tumour suppressor. However, CTGF was found to promote tumourigenesis of prostate cancer cells (Yang et al., 2005) and CTGF neutralization with FG-3019, a recently developed neutralizing CTGF antibody, inhibit pancreatic tumour growth and metastasis (Dornhofer et al., 2006). These controversial data reveal the need for further studies clarifying the complex role of PPARγ-induced S1P levels in different cellular compartments and the subsequent changes of CTGF expression in tumourigenesis.
In summary, we demonstrated that TZDs activate SK-1, possibly involving at least one functional PPRE in the SK-1 promoter region, which in turn results in increased generation of intracellular S1P functionally coupled with lower amounts of CTGF (Figure 12). Thus, our in vitro and in vivo data present novel aspects to explain the known anti-fibrotic potency of TZDs and add new facets to the complex field of effective treatments for renal fibrosis. However, important issues and exciting questions regarding the intracellular actions of S1P or the potential role of PPARγ-dependent SK-1 activation under diabetic conditions need to be clarified in future experiments.
Acknowledgments
We thank Dr Heinfried Radeke for kindly providing the human MC and Dr Stephanie Schwalm for the isolation of mouse glomeruli. This work was supported by the German Research Foundation (FOG784, KO3940/1-1, PF361/6-2, HU842/5-1, GRK 757 and 1172, SFB 815) and the LOEWE Lipid Signaling Forschungszentrum Frankfurt and the Swiss National Foundation (to A.H.).
Glossary
- CTGF
connective tissue growth factor
- DMEM
Dulbecco's modified Eagle's medium
- GW-9662
2-chloro-5-nitrobenzanilide
- MC
mesangial cell
- PPRE
PPAR response element
- RSG
rosiglitazone
- S1P
sphingosine-1-phosphate
- SK
sphingosine kinase
- TRO
troglitazone
- TZD
thiazolidinedione
Conflict of interest
None.
References
- Abdel Wahab N, Mason RM. Connective tissue growth factor and renal diseases: some answers, more questions. Curr Opin Nephrol Hypertens. 2004;13:53–58. doi: 10.1097/00041552-200401000-00008. [DOI] [PubMed] [Google Scholar]
- Alvarez SE, Harikumar KB, Hait NC, Allegood J, Strub GM, Kim EY, et al. Sphingosine-1-phosphate is a missing cofactor for the E3 ubiquitin ligase TRAF2. Nature. 2010;465:1084–1088. doi: 10.1038/nature09128. [DOI] [PMC free article] [PubMed] [Google Scholar]
- Boor P, Sebeková K, Ostendorf T, Floege J. Treatment targets in renal fibrosis. Nephrol Dial Transplant. 2007;22:3391–3407. doi: 10.1093/ndt/gfm393. [DOI] [PubMed] [Google Scholar]
- Bork P. The modular architecture of a new family of growth regulators related to connective tissue growth factor. FEBS Lett. 1993;327:125–130. doi: 10.1016/0014-5793(93)80155-n. [DOI] [PubMed] [Google Scholar]
- Chien W, Yin D, Gui D, Mori A, Frank JM, Said J, et al. Suppression of cell proliferation and signaling transduction by connective tissue growth factor in non-small cell lung cancer cells. Mol Cancer Res. 2006;4:591–598. doi: 10.1158/1541-7786.MCR-06-0029. [DOI] [PubMed] [Google Scholar]
- Choi JH, Banks AS, Estall JL, Kajimura S, Boström P, Laznik D, et al. Anti-diabetic drugs inhibit obesity-linked phosphorylation of PPARgamma by Cdk5. Nature. 2010;466:451–456. doi: 10.1038/nature09291. [DOI] [PMC free article] [PubMed] [Google Scholar]
- Crean JK, Furlong F, Finlay D, Mitchell D, Murphy M, Conway B, et al. Connective tissue growth factor [CTGF]/CCN2 stimulates mesangial cell migration through integrated dissolution of focal adhesion complexes and activation of cell polarization. FASEB J. 2004;18:1541–1543. doi: 10.1096/fj.04-1546fje. [DOI] [PubMed] [Google Scholar]
- Desvergne B, Wahli W. Peroxisome proliferator-activated receptors: nuclear control of metabolism. Endocr Rev. 1999;20:649–688. doi: 10.1210/edrv.20.5.0380. [DOI] [PubMed] [Google Scholar]
- Dornhofer N, Spong S, Bennewith K, Salim A, Klaus S, Kambham N, et al. Connective tissue growth factor-specific monoclonal antibody therapy inhibits pancreatic tumor growth and metastasis. Cancer Res. 2006;66:5816–5827. doi: 10.1158/0008-5472.CAN-06-0081. [DOI] [PubMed] [Google Scholar]
- Francki A, Uciechowski P, Floege J, von der Ohe J, Resch K, Radeke HH. Autocrine growth regulation of human glomerular mesangial cells is primarily mediated by basic fibroblast growth factor. Am J Pathol. 1995;147:1372–1382. [PMC free article] [PubMed] [Google Scholar]
- French KJ, Schrecengost RS, Lee BD, Zhuang Y, Smith SN, Eberly JL, et al. Discovery and evaluation of inhibitors of human sphingosine kinase. Cancer Res. 2003;63:5962–5969. [PubMed] [Google Scholar]
- French KJ, Upson JJ, Keller SN, Zhuang Y, Yun JK, Smith CD. Antitumor activity of sphingosine kinase inhibitors. J Pharmacol Exp Ther. 2006;318:596–603. doi: 10.1124/jpet.106.101345. [DOI] [PubMed] [Google Scholar]
- Fu M, Zhang J, Zhu X, Myles DE, Willson TM, Liu X, et al. Peroxisome proliferator-activated receptor gamma inhibits transforming growth factor beta-induced connective tissue growth factor expression in human aortic smooth muscle cells by interfering with Smad3. J Biol Chem. 2001;276:45888–45894. doi: 10.1074/jbc.M105490200. [DOI] [PubMed] [Google Scholar]
- Gupta S, Clarkson MR, Duggan J, Brady HR. Connective tissue growth factor: potential role in glomerulosclerosis and tubulointerstitial fibrosis. Kidney Int. 2000;58:1389–1399. doi: 10.1046/j.1523-1755.2000.00301.x. [DOI] [PubMed] [Google Scholar]
- Hait NC, Allegood J, Maceyka M, Strub GM, Harikumar KB, Singh SK, et al. Regulation of histone acetylation in the nucleus by sphingosine-1-phosphate. Science. 2009;325:1254–1257. doi: 10.1126/science.1176709. [DOI] [PMC free article] [PubMed] [Google Scholar]
- Hla T. Signaling and biological actions of sphingosine 1-phosphate. Pharmacol Res. 2003;47:401–407. doi: 10.1016/s1043-6618(03)00046-x. [DOI] [PubMed] [Google Scholar]
- Hofmann LP, Ren S, Schwalm S, Pfeilschifter J, Huwiler A. Sphingosine kinase 1 and 2 regulate the capacity of mesangial cells to resist apoptotic stimuli in an opposing manner. Biol Chem. 2008;389:1399–1407. doi: 10.1515/BC.2008.160. [DOI] [PubMed] [Google Scholar]
- Houtkooper RH, Auwerx J. Obesity: new life for antidiabetic drugs. Nature. 2010;466:443–444. doi: 10.1038/466443a. [DOI] [PMC free article] [PubMed] [Google Scholar]
- Huwiler A, Stabel S, Fabbro D, Pfeilschifter J. Platelet-derived growth factor and angiotensin II stimulate the mitogen-activated protein kinase cascade in renal mesangial cells: comparison of hypertrophic and hyperplastic agonists. Biochem J. 1995;305:777–784. doi: 10.1042/bj3050777. [DOI] [PMC free article] [PubMed] [Google Scholar]
- Huwiler A, Kolter T, Pfeilschifter J, Sandhoff K. Physiology and pathophysiology of sphingolipid metabolism and signaling. Biochim Biophys Acta. 2000;1485:63–99. doi: 10.1016/s1388-1981(00)00042-1. [DOI] [PubMed] [Google Scholar]
- Huwiler A, Döll F, Ren S, Klawitter S, Greening A, Römer I, et al. Histamine increases sphingosine kinase-1 expression and activity in the human arterial endothelial cell line EA.hy 926 by a PKC-alpha-dependent mechanism. Biochim Biophys Acta. 2006;1761:367–376. doi: 10.1016/j.bbalip.2006.02.007. [DOI] [PubMed] [Google Scholar]
- Isshiki K, Haneda M, Koya D, Maeda S, Sugimoto T, Kikkawa R. Thiazolidinedione compounds ameliorate glomerular dysfunction independent of their insulin-sensitizing action in diabetic rats. Diabetes. 2000;49:1022–1032. doi: 10.2337/diabetes.49.6.1022. [DOI] [PubMed] [Google Scholar]
- Kawai T, Masaki T, Doi S, Arakawa T, Yokoyama Y, Doi T, et al. PPAR-gamma agonist attenuates renal interstitial fibrosis and inflammation through reduction of TGF-beta. Lab Invest. 2009;89:47–58. doi: 10.1038/labinvest.2008.104. [DOI] [PubMed] [Google Scholar]
- Koch A, König B, Stangl GI, Eder K. PPAR alpha mediates transcriptional upregulation of novel organic cation transportes-2 and -3 and enzymes involved in hepatic carnitine synthesis. Exp Biol Med (Maywood) 2008;233:356–365. doi: 10.3181/0706-RM-168. [DOI] [PubMed] [Google Scholar]
- Leask A, Abraham DJ. TGF-beta signaling and the fibrotic response. FASEB J. 2004;18:816–827. doi: 10.1096/fj.03-1273rev. [DOI] [PubMed] [Google Scholar]
- Lefebvre AM, Chen I, Desreumaux P, Najib J, Furchart JC, Geboes K, et al. Activation of the peroxisome proliferator-activated receptor γ promotes the development of colon tumors in C57BL/6J-APCmin/+ mice. Nat Med. 1998;4:1053–1057. doi: 10.1038/2036. [DOI] [PubMed] [Google Scholar]
- Lehrke M, Lazar MA. The many faces of PPARgamma. Cell. 2005;123:993–999. doi: 10.1016/j.cell.2005.11.026. [DOI] [PubMed] [Google Scholar]
- Li MH, Sanchez T, Pappalardo A, Lynch KR, Hla T, Ferrer F. Induction of antiproliferative connective tissue growth factor expression in Wilms' tumor cells by sphingosine-1-phosphate receptor 2. Mol Cancer Res. 2008;6:1649–1656. doi: 10.1158/1541-7786.MCR-07-2048. [DOI] [PMC free article] [PubMed] [Google Scholar]
- Liu H, Sugiura M, Nava VE, Edsall LC, Kono K, Poulton S, et al. Molecular cloning and functional characterization of a novel mammalian sphingosine kinase type 2 isoform. J Biol Chem. 2000;275:19513–19520. doi: 10.1074/jbc.M002759200. [DOI] [PubMed] [Google Scholar]
- Long DA, Price KL. Sphingosine kinase-1: a potential mediator of renal fibrosis. Kidney Int. 2009;76:815–817. doi: 10.1038/ki.2009.310. [DOI] [PubMed] [Google Scholar]
- Ma LJ, Marcantoni C, Linton MF, Fazio S, Fogo AB. Peroxisome proliferator-activated receptor-gamma agonist troglitazone protects against nondiabetic glomerulosclerosis in rats. Kidney Int. 2001;59:1899–1910. doi: 10.1046/j.1523-1755.2001.0590051899.x. [DOI] [PubMed] [Google Scholar]
- Madry H, Reszka R, Bohlender J, Wagner J. Efficacy of cationic liposome-mediated gene transfer to mesangial cells in vitro and in vivo. J Mol Med. 2001;79:184–189. doi: 10.1007/s001090000186. [DOI] [PubMed] [Google Scholar]
- Melendez AJ, Carlos-Dias E, Gosink M, Allen JM, Takacs L. Human sphingosine kinase: molecular cloning, functional characterization and tissue distribution. Gene. 2000;251:19–26. doi: 10.1016/s0378-1119(00)00205-5. [DOI] [PubMed] [Google Scholar]
- Miglio G, Rosa AC, Rattazzi L, Grange C, Collino M, Camussi G, et al. The subtypes of peroxisome proliferator-activated receptors expressed by human podocytes and their role in decreasing podocyte injury. Br J Pharmacol. 2011;162:111–125. doi: 10.1111/j.1476-5381.2010.01032.x. [DOI] [PMC free article] [PubMed] [Google Scholar]
- Minucci S, Pelicci PG. Histone deacetylase inhibitors and the promise of epigenetic (and more) treatments for cancer. Nat Rev Cancer. 2006;6:38–51. doi: 10.1038/nrc1779. [DOI] [PubMed] [Google Scholar]
- Nakade Y, Banno Y, T-Koizumi K, Hagiwara K, Sobue S, Koda M, et al. Regulation of sphingosine kinase 1 gene expression by protein kinase C in a human leukemia cell line, MEG-O1. Biochim Biophys Acta. 2003;1635:104–116. doi: 10.1016/j.bbalip.2003.11.001. [DOI] [PubMed] [Google Scholar]
- Nissen SE, Wolski K. Effect of rosiglitazone on the risk of myocardial infarction and death from cardiovascular causes. N Engl J Med. 2007;356:2457–2471. doi: 10.1056/NEJMoa072761. [DOI] [PubMed] [Google Scholar]
- Pfeilschifter J, Vosbeck K. Transforming growth factor beta 2 inhibits interleukin 1 beta- and tumour necrosis factor alpha-induction of nitric oxide synthase in rat renal mesangial cells. Biochem Biophys Res Commun. 1991;175:372–379. doi: 10.1016/0006-291x(91)91574-v. [DOI] [PubMed] [Google Scholar]
- Pyne NJ, Pyne S. Sphingosine 1-phosphate and cancer. Nat Rev Cancer. 2010;10:489–503. doi: 10.1038/nrc2875. [DOI] [PubMed] [Google Scholar]
- Radeke HH, Meier B, Topley N, Floge J, Habermehl GG, Resch K. Interleukin 1-alpha and tumor necRSGs factor-alpha induce oxygen radical production in mesangial cells. Kidney Int. 1990;37:767–775. doi: 10.1038/ki.1990.44. [DOI] [PubMed] [Google Scholar]
- Ren S, Babelova A, Moreth K, Xin C, Eberhardt W, Doller A, et al. Transforming growth factor-beta2 upregulates sphingosine kinase-1 activity, which in turn attenuates the fibrotic response to TGF-beta2 by impeding CTGF expression. Kidney Int. 2009;76:857–867. doi: 10.1038/ki.2009.297. [DOI] [PubMed] [Google Scholar]
- Ren S, Xin C, Pfeilschifter J, Huwiler A. A novel mode of action of the putative sphingosine kinase inhibitor 2-(p-hydroxyanilino)-4-(p-chlorophenyl) thiazole (SKI II): induction of lysosomal sphingosine kinase 1 degradation. Cell Physiol Biochem. 2010;26:97–104. doi: 10.1159/000315110. [DOI] [PubMed] [Google Scholar]
- Riser BL, Cortes P, DeNichilo M, Deshmukh PV, Chahal PS, Mohammed AK, et al. Urinary CCN2 (CTGF) as a possible predictor of diabetic nephropathy: preliminary report. Kidney Int. 2003;64:451–458. doi: 10.1046/j.1523-1755.2003.00130.x. [DOI] [PubMed] [Google Scholar]
- Saez E, Tontonoz P, Nelson MC, Alvarez JG, Ming UT, Baird SM, et al. Activators of the nuclear receptor PPARgamma enhance colon polyp formation. Nat Med. 1998;4:1058–1061. doi: 10.1038/2042. [DOI] [PubMed] [Google Scholar]
- Schnaper HW, Hayashida T, Hubchak SC, Poncelet AC. TGF-beta signal transduction and mesangial cell fibrogenesis. Am J Physiol Renal Physiol. 2003;284:243–252. doi: 10.1152/ajprenal.00300.2002. [DOI] [PubMed] [Google Scholar]
- Scholz-Pedretti K, Gans A, Beck KF, Pfeilschifter J, Kaszkin M. Potentiation of TNF-alpha-stimulated group IIA phospholipase A(2) expression by peroxisome proliferator-activated receptor alpha activators in rat mesangial cells. J Am Soc Nephrol. 2002;13:611–620. doi: 10.1681/ASN.V133611. [DOI] [PubMed] [Google Scholar]
- Schwalm S, Döll F, Römer I, Bubnova S, Pfeilschifter J, Huwiler A. Sphingosine kinase-1 is a hypoxia regulated gene that stimulates migration of human endothelial cells. Biochem Biophys Res Commun. 2008;368:1020–1025. doi: 10.1016/j.bbrc.2008.01.132. [DOI] [PubMed] [Google Scholar]
- Schwalm S, Pfeilschifter J, Huwiler A. Sphingosine kinase 1 is critically involved in nitric oxide-mediated human endothelial cell migration and tube formation. Br J Pharmacol. 2010;160:1641–1651. doi: 10.1111/j.1476-5381.2010.00818.x. [DOI] [PMC free article] [PubMed] [Google Scholar]
- Tachibana K, Yamasaki D, Ishimoto K, Doi T. The role of PPARs in Cancer. PPAR Res. 2008;2008:102737. doi: 10.1155/2008/102737. [DOI] [PMC free article] [PubMed] [Google Scholar]
- Wang L, Xing XP, Holmes A, Wadham C, Gamble JR, Vadas MA, et al. Activation of the sphingosine kinase signaling pathway by high glucose mediates the proinflammatory phenotype of endothelial cells. Circ Res. 2005;97:891–899. doi: 10.1161/01.RES.0000187469.82595.15. [DOI] [PubMed] [Google Scholar]
- Wang W, Liu F, Chen N. Peroxisome proliferator-activated receptor-gamma (PPAR-gamma) agonists attenuate the profibrotic response induced by TGF-beta1 in renal interstitial fibroblasts. Mediators Inflamm. 2007;2007:62641. doi: 10.1155/2007/62641. [DOI] [PMC free article] [PubMed] [Google Scholar]
- Wu J, Chen L, Zhang D, Huo M, Zhang X, Pu D, et al. Peroxisome proliferator-activated receptors and renal diseases. Front Biosci. 2009;14:995–1009. doi: 10.2741/3291. [DOI] [PubMed] [Google Scholar]
- Xin C, Ren S, Kleuser B, Shabahang S, Eberhardt W, Radeke H, et al. Sphingosine 1-phosphate cross-activates the Smad signaling cascade and mimics transforming growth factor-β-induced cell responses. J Biol Chem. 2004;279:35255–35262. doi: 10.1074/jbc.M312091200. [DOI] [PubMed] [Google Scholar]
- Yang F, Tuxhorn JA, Ressler SJ, McAlhany SJ, Dang TD, Rowley DR. Stromal expression of connective tissue growth factor promotes angiogenesis and prostate cancer tumorigenesis. Cancer Res. 2005;65:8887–8895. doi: 10.1158/0008-5472.CAN-05-1702. [DOI] [PubMed] [Google Scholar]
- Yang T, Michele DE, Park J, Smart AM, Lin Z, Brosius FC, et al. Expression of peroxisomal proliferator-activated receptors and retinoid X receptors in the kidney. Am J Physiol. 1999;277:966–973. doi: 10.1152/ajprenal.1999.277.6.F966. [DOI] [PubMed] [Google Scholar]
- Zeisberg M, Hanai J, Sugimoto H, Mammoto T, Charytan D, Strutz F, et al. BMP-7 counteracts TGF-beta1-induced epithelial-to-mesenchymal transition and reverses chronic renal injury. Nat Med. 2003;9:964–968. doi: 10.1038/nm888. [DOI] [PubMed] [Google Scholar]