

Abstract
BACKGROUND AND PURPOSE
Caffeic acid phenethyl ester (CAPE) is a component of honey bee propolis that can induce expression of haem oxygenase-1 (HO-1). Because HO-1 induction has been suggested to protect dopaminergic neurons in the substantia nigra, we examined the effect of CAPE in experimental models of dopaminergic neurodegeneration.
EXPERIMENTAL APPROACH
Neuroprotective effect of CAPE was investigated in rat organotypic midbrain slice cultures and in vivo, using a mouse model of dopaminergic neurodegeneration induced by intranigral injection of LPS and intrastriatal injection of 6-hydroxydopamine.
KEY RESULTS
CAPE protected dopaminergic neurons in slice cultures from IFN-γ/LPS-induced injury. The effect of CAPE was inhibited by zinc protoporphyrin IX, an HO-1 inhibitor, and by neutralizing antibody against brain-derived neurotrophic factor (BDNF). A p38 MAPK inhibitor SB203580 prevented activation of NF-E2-related factor 2, attenuated increased expression of HO-1 and BDNF, and blocked the neuroprotective actions of CAPE. In the LPS-injected mouse model, daily intraperitoneal administration of CAPE protected dopaminergic neurons, up-regulated HO-1 and BDNF, and reduced the increase of activated microglia/macrophages. Neuroprotective effects of CAPE against LPS-induced injury was prevented by zinc protoporphyrin IX or anti-BDNF antibody. CAPE protected dopaminergic neurons and alleviated methamphetamine-induced rotational behaviour also in 6-hydroxydopamine hemiparkinsonian mice.
CONCLUSION AND IMPLICATIONS
CAPE is a novel type of neuroprotective agent whose actions are mediated by both HO-1 and BDNF. These findings may provide novel clues to develop neuroprotective agents for treatment of neurodegenerative disorders.
Keywords: brain-derived neurotrophic factor, caffeic acid phenethyl ester, dopaminergic neurons, heme oxygenase, neuroprotection, Nrf2, Parkinson disease
Introduction
Parkinson's disease is a progressive neurodegenerative disorder pathologically characterized by selective loss of dopaminergic neurons in the midbrain substantia nigra pars compacta (SNpc), which leads to severely debilitating motor symptoms such as bradykinesia, resting tremor and rigidity (Dauer and Przedborski, 2003; Fahn and Sulzer, 2004). Diverse sets of environmental and genetic factors as well as intrinsic characteristics of dopaminergic neurons may be involved in the pathogenesis of Parkinson's disease as primary causes of neurodegeneration (Dodson and Guo, 2007; Thomas and Beal, 2007). Although the aetiologies of Parkinson's disease still remain poorly understood, the disease pathology is generally associated with inflammatory processes and oxidative stress manifested by activated microglia in SNpc that accelerate and exacerbate neurodegeneration (McGeer et al., 1988; 2003; Hirsch et al., 1998).
In response to inflammation and oxidative stress, endogenous defensive factors are up-regulated in brain parenchymal cells including neurons, astrocytes and microglia. Several lines of evidence suggest that haem oxygenase-1 (HO-1), whose expression is increased under various pathological conditions in the CNS, plays an important role in preventing neurodegeneration (Huang et al., 2005; Scott et al., 2007). HO-1 is an inducible enzyme that catalyzes oxidative haem degradation resulting in production of bilirubin and carbon monoxide. These products may exert cytoprotective actions based on their anti-inflammatory and anti-oxidative properties (Ryter et al., 2006; Scott et al., 2007). We have previously reported that HO-1 acts as an endogenous neuroprotective factor to limit inflammatory degeneration of dopaminergic neurons in rat organotypic midbrain slice cultures (Kurauchi et al., 2009). Local overexpression of HO-1 has also been reported to protect dopaminergic neurons against 1-methyl-4-phenylpyridinium (MPP+) neurotoxicity in SNpc of rats (Hung et al., 2008). These observations suggest that up-regulation of HO-1 expression is a potential therapeutic strategy for Parkinson's disease.
Caffeic acid phenethyl ester (CAPE, 2-phenylethyl (E)-3-(3,4-dihydroxyphenyl)prop-2-enoate; Supporting Information Figure S1A) is an active component of propolis, a resinous mixture obtained from honeybee hives, that exhibits anti-inflammatory and anti-oxidative properties. CAPE is a potent inhibitor of NF-κB and is able to protect neurons from several kinds of insults such as ischaemia-induced injury, inflammatory stress and oxidative stress (Montpied et al., 2003; Wei et al., 2004; Noelker et al., 2005; Altuğet al., 2008; Celik and Erdogan, 2008). In addition, CAPE has been shown to induce HO-1 expression in several types of cells in vitro (Scapagnini et al., 2002; Wang et al., 2008b), although potential protective effect of CAPE on dopaminergic neurons has not been addressed to date, except for a very recent study on 1-methyl-4-phenyl-1,2,3,6-tetrahydropyridine-induced neurodegeneration in mice (Fontanilla et al., 2011). Considering the properties of CAPE as an HO-1 inducer, we set out to validate potential protective effect of CAPE on dopaminergic neurons and to examine the mechanisms of neuroprotection. We used rat organotypic midbrain slice cultures in vitro and LPS- or 6-hydroxydopamine (6-OHDA)-injected mouse models of Parkinson's disease in vivo.
Methods
Culture preparation and drug treatment
All animal care and experimental procedures were approved by our institutional animal experimentation committee and were conformed to the prevailing standards of animal welfare embodied in UK laws governing animal experimentation. Organotypic midbrain slice cultures were prepared according to the methods described previously (Katsuki et al., 2009; Kurauchi et al., 2009). Briefly, 2- to 3-day-old neonatal Wistar rats (Nihon SLC, Shizuoka, Japan) were anaesthetized by hypothermia and decapitated, and the brain was removed from the skull and separated into two hemispheres. In total, offspring of 25 mother rats were used in culture experiments. Coronal midbrain slices (350 µm thick) were prepared under sterile conditions with a tissue chopper and transferred onto microporous membranes (Millicell-CM, Millipore, Bedford, MA, USA) in six-well plates. Culture medium, consisting of 50% minimal essential medium/HEPES, 25% Hanks' balanced salt solution and 25% heat-inactivated horse serum (Invitrogen Japan, Tokyo, Japan) supplemented with 6.5 mg·mL−1 glucose, 2 mM l-glutamine and 10 U·mL−1 penicillin-G/10 µg·mL−1 streptomycin, was supplied at a volume of 0.7 mL per well. The culture medium was exchanged with fresh medium on the next day of culture preparation, and thereafter, every 2 days. Slices were maintained in a 34°C, 5% CO2 humidified atmosphere. At 17 days in vitro, drug treatment was performed by transfer of culture inserts to culture wells filled with 0.7 mL of drug-containing serum-free medium. Serum-free medium consisted of 75% minimal essential medium and 25% Hanks' balanced salt solution supplemented with 6.5 mg·mL−1 glucose, 2 mM l-glutamine and 10 U·mL−1 penicillin-G/10 µg·mL−1 streptomycin. The maximal duration of LPS treatment was 72 h. In that case, medium exchange was not performed during the treatment.
Immunohistochemistry
Slices were fixed with 4% paraformaldehyde in 0.1 M phosphate buffer containing 4% sucrose at 4°C for 2.5 h and processed for TH immunohistochemistry with avidin-biotinylated horseradish peroxidase method as described previously (Katsuki et al., 2009). Rabbit anti-TH polyclonal antibody (1:500, Millipore) and biotinylated anti-rabbit IgG from goat (1:200, Vector Laboratories, Burlingame, CA, USA) were used as a primary and a secondary antibody respectively. The maximal number of TH-positive dopaminergic neurons in an area of 450 × 670 µm2 in individual slices was counted.
Expression of HO-1, brain-derived neurotrophic factor (BDNF) and NF-E2-related factor 2 (Nrf2) was determined by double immunofluorescence with specific cell markers. Rabbit anti-HO-1 antibody (1:200, Assay Designs Inc., Ann Arbor, MI, USA), rabbit anti-BDNF (1:200, sc-546; Santa Cruz Biotechnology Inc., Santa Cruz, CA, USA), rabbit anti-Nrf2 (1:200, sc-722; Santa Cruz Biotechnology Inc.), mouse anti-TH (1:1000; Affinity BioReagents, Golden, CO, USA) and goat anti-glial fibrillary acidic protein (GFAP, 1:300, sc-6170; Santa Cruz Biotechnology Inc.) were used as primary antibodies. Alexa Fluor 488-conjugated goat anti-rabbit IgG(H + L) (1:500, Molecular Probes, Eugene, OR, USA), Alexa Fluor 594-conjugated goat anti-mouse IgG(H + L) (1:500, Molecular Probes), Alexa Fluor 488-conjugated donky anti-rabbit IgG(H + L) (1:500, Molecular Probes) and Alexa Fluor 594-conjugated donky anti-goat IgG(H + L) (1:500, Molecular Probes) were used as secondary antibodies. For detection of microglia, we used biotinylated Griffonia (Bandeiraea) simplicifolia lectin I-B4 isolectin (1:100, Vector Laboratories) followed by application of Alexa Fluor 488-conjugated streptavidin (1:2000, Molecular Probes). Percentage of double-immunopositive area (HO-1 or BDNF with cell type-specific markers) within the total area positive for each cell type-specific marker was determined by examination of random fields of 180 × 180 µm2 in the nigral region for each slice. Three or four fields in individual slices from two independent experiments were imaged. Doubly immunopositive areas were measured by ImageJ software (National Institute of Health, Bethesda, MD, USA).
Nitrite quantification
Amounts of NO released from cultured tissues were measured as the concentration of nitrite in culture medium by the Griess method. Fifty µL of culture supernatants was mixed with an equal volume of Griess reagent (Sigma) for 10 min at room temperature, and absorbance of the diazonium compound was measured at a wavelength of 560 nm. The absolute level of nitrite was determined with reference to a standard curve obtained with sodium nitrite.
Western blotting
At 17 days in vitro, slices were incubated for 24 h in serum-free medium. Then, slices were exposed to the indicated concentrations of drugs. After drug treatment for indicated periods, slices were collected in RIPA buffer [150 mM NaCl, 50 mM Tris-HCl (pH 7.5), 5 mM EDTA-4Na (pH 8.0), 1% Nonidet P-40, 0.1% SDS, 0.5% sodium deoxycholate and protease inhibitor cocktail (Sigma)] and incubated at 4°C for 30 min. Lysates were centrifuged at 12 000×g at 4°C for 20 min and the protein concentration in each sample was determined by Bicinchoninate method. With added sample buffer containing 0.5 M Tris-HCl (pH 6.8), 10% SDS, 2-mercaptoethanol, glycerol and 1% bromophenol blue, each sample was heated at 99°C for 10 min. SDS-polyacrylamide gel electrophoresis was performed on a 5.4% stacking gel with 15% separating gel for HO-1 and BDNF. After gel electrophoresis, proteins were transferred onto polyvinylidene difluoride membranes. The blots were washed with Tris-buffered saline containing 0.1% Tween 20 and blocked with 8% skimmed milk for HO-1 or Blocking One (Nacalai, Kyoto, Japan) for BDNF and β-actin, respectively, at room temperature for 2 h. The membrane was incubated with rabbit anti-HO-1 antibody (1:20 000, Assay Designs Inc.), rabbit anti-BDNF antibody (1:1000, Santa Cruz Biotechnology Inc.) and mouse anti-β-actin antibody (1:1000, Sigma) overnight at 4°C. After incubation with horseradish peroxidase-conjugated secondary antibodies at room temperature for 1 h, bands were detected with ECL Advance™ Western blotting detection kit (Amersham Biosciences, Piscataway, NJ, USA) on a lumino-imaging analyzer (LAS-3000mini, Fuji Film, Tokyo, Japan).
To detect phosphorylated levels of ERK and p38 MAPK, slices were collected in lysis buffer [150 mM NaCl, 50 mM Tris-HCl (pH 7.4), 5 mM EDTA-4Na (pH 8.0), 1% Nonidet P-40, 0.1% SDS, 0.5% sodium deoxycholate, 0.1% sodium orthovanadate, 1 mM phenylmethylsulfonyl fluoride, 50 mM NaF and protease inhibitor cocktail], followed by procedures described above and the membrane was blocked with Blocking One and incubated with rabbit anti-phospho-ERK1/2 antibody [phospho-p44/42 MAP kinase (Thr202/Tyr204), 1:1000; Cell Signaling Tech.], rabbit anti-ERK1/2 antibody (p44/42 MAP kinase, 1:1000; Cell Signaling Tech.), rabbit anti-phospho-p38 MAPK antibody [phospho-p38 MAP kinase (Thr180/Tyr182), 1:1000; Cell Signaling Tech.], rabbit anti-p38 MAPK antibody (1:1000; Cell Signaling Tech.) and anti-β-actin antibody (1:1000, Sigma) overnight at 4°C.
Preparation of nuclear fraction and Western blotting for Nrf2
Nuclear fractions were prepared from midbrain slice cultures after drug treatment. Slices were collected and homogenized in buffer A consisting of 10 mM HEPES-KOH (pH 7.9), 10 mM KCl, 0.1 mM EDTA-4Na (pH 8.0), 0.1 mM EGTA, 1 mM dithiothreitol, 0.5 mM phenylmethylsulfonyl fluoride and protease inhibitor cocktail. After incubation on ice for 30 min, the homogenate was mixed with buffer A containing 10% NP-40, centrifuged at 12 000×g for 3 min, and the supernatant was collected as the post-nuclear fraction. The nuclear pellet was washed twice in buffer A. After centrifugation at 12 000×g, the nuclear fraction was resuspended in five pellet volumes of buffer B consisting of 20 mM HEPES-KOH (pH 7.9), 1 mM EDTA-4Na, 1 mM EGTA, 40 mM NaCl, 1 mM dithiothreitol, 1 mM phenylmethylsulfonyl fluoride and protease inhibitor cocktail. After rigorous mixing at 4°C for 30 min, the suspension was centrifuged at 12 000×g for 10 min and supernatant was collected as the nuclear fraction. The protein concentration in each sample was determined by the Bradford method. Sample buffer consisting of 0.5 M Tris-HCl (pH 6.8), 10% SDS, 2-mercaptoethanol, glycerol and 1% bromophenol blue was added to post-nuclear and nuclear fractions, and each sample was boiled for 10 min. Samples were subjected to electrophoresis in 15% SDS-polyacrylamide gel, and proteins were transferred onto polyvinylidene difluoride membrane in blotting buffer containing 10% methanol. Membranes were washed with Tris-buffered saline containing 0.1% Tween 20 and blocked with 5% skimmed milk at room temperature for 2 h. We applied rabbit anti-HO-1 antibody (1:20 000, Assay Designs Inc.) and mouse anti-β-actin antibody (1:1000, Sigma) overnight at 4°C to membrane with the post-nuclear fraction. Rabbit anti-Nrf2 antibody (1:400, Santa Cruz Biotechnology Inc.) and goat anti-histone H1 antibody (1:500, Santa Cruz Biotechnology Inc.) were applied to membranes for the nuclear fraction. After incubation with horseradish peroxidase-conjugated secondary antibodies at room temperature for 1 h, bands were detected with ECL advanced™ Western blotting detection kit (Amersham Bioscience) on a lumino-imaging analyzer.
In vivo experiments with LPS injection
According to the procedures described previously (Katsuki et al., 2009), unilateral microinjection of LPS was carried out in the midbrain substantia nigra of male C57BL/6 mice, 8 to 10 weeks old. The total number of animals used in this set of experiments was 83. Mice were maintained under a 12 h light/dark cycle (light on 8:00–20:00 h), with food and water available ad libitum. Mice were anaesthetized by intraperitoneal injection of 50 mg·kg−1 pentobarbital, and LPS dissolved at 3 µg·µL−1 in PBS was injected in one hemisphere at stereotaxic coordinates of 2.8 mm posterior to bregma, 1.3 mm lateral from the midline and 4.5 mm ventral to the surface of the dura mater. The same volume of PBS was injected in the other hemisphere. In some animals, zinc protoporphyrin IX (ZnPPIX; 34 ng) or anti-BDNF antibody (250 ng) was concomitantly injected with LPS and PBS in each hemisphere. Phthalocyanine blue (1%; Sigma) was included in the solutions to be injected for verification of the site of injection. Injection of 1 µL solution through a 30-gauge needle was performed over a period of 1 min, and the needle was kept in place for 3 min before withdrawal. CAPE (2 or 6 mg·mL−1) was suspended in corn oil (Nacalai) containing 1% dimethyl sulfoxide (DMSO) and intraperitoneally administered to mice at 10 or 30 mg·kg−1, respectively, for four consecutive days (once per day at 10:00–12:00 h). Control animals received intraperitoneal administration of the same volume of corn oil containing 1% DMSO without CAPE. Animals received LPS injection after 30 min at the day (10:00–12:00 h) of the first intraperitoneal administration of CAPE.
At 3 days after LPS injection, mice were again anaesthetized with pentobarbital and transcardially perfused with PBS followed by 4% paraformaldehyde in 0.1 M phosphate buffer containing 4% sucrose. Then, the brain was isolated, postfixed with 4% paraformaldehyde in 0.1 M phosphate buffer containing 4% sucrose for overnight at 4°C and immersed in 15% sucrose solution for overnight at 4°C. After freezing, coronal midbrain sections of 30 µm thickness were prepared. Six sections were collected every 90 µm, from the rostro-caudal level including the injection site in the centre, and after immunohistochemistry, five sections (excluding one section that contained the tract of injection needle) were used for cell counting. Immunohistochemistry for TH was performed on these brain sections mounted onto slides, with the same set of antibodies as that used for slice cultures, at dilutions of 1:500 and 1:200 for the primary and the secondary antibodies, respectively. Immunoreactivity was visualized with the use of Vectastain Elite ABC Kit (Vector Laboratories, Burlingame, CA, USA). The number of TH-positive neurons located in the lateral portion of SNpc was counted for each section within a frame of 450 × 670 µm2, and the average value from five sections was obtained for each hemisphere. Expression of HO-1 and BDNF was determined by double immunofluorescence with specific cell markers as described above for in vitro experiments. Isolectin B4 binding was also examined as described above to identify microglia/macrophages, and positive area within a dimension of 420 × 420 µm2 in individual slices was measured by ImageJ software. Microglia in the activated state and macrophages infiltrated into the brain featured a round or oval shape of cell body with few processes, whereas microglia in the resting state exhibited a ramified form with thin processes.
For quantitative analysis of IL-1β mRNA expression, we performed real-time PCR with SYBR® Premix Ex Taq™ (TaKaRa, Shiga, Japan) on a Chromo4™ real-time PCR analysis system (Bio-Rad, Tokyo, Japan). At 6 h after LPS injection, mice were again anaesthetized with pentobarbital and transcardially perfused with PBS. Then, the brain was isolated; midbrain region from each hemisphere was collected as one sample. Samples were run in duplicate. The thermal cycling program consisted of 95°C for 3 min for polymerase activation and then 40 cycles of denaturation (95°C for 15 s) and annealing and extension (60°C for 1 min). The reactions were quantified by selection of the amplification cycle when the PCR product of interest was first detected [the threshold cycle (Ct)]. Data were analyzed by the comparative Ct method. The primer sequences were IL-1β forward 5′-TGAAGGGCTGCTTCCAAACC-3′, IL-1β reverse 5′-TGTCCATTGAGGTGGAGAGC-3′, glyceraldehyde-3-phosphate dehydrogenase (GAPDH) forward 5′-ACCATCTTCCAGGAGCGAGA-3′, GAPDH reverse 5′-CAGTCTTCTGGGTGGCAGTG-3′.
To detect HO-1 and BDNF protein expression, we performed Western blotting. At 3 days after LPS injection, mice were anaesthetized with pentobarbital and transcardially perfused with PBS. Then, the brain was isolated; midbrain region from each hemisphere was collected in lysis buffer. After homogenization for 5 min followed by incubation for 30 min on ice, the suspension was centrifuged at 12 000×g for 30 min and the supernatant was collected. Rabbit anti-HO-1 antibody (1:20 000, Assay Designs Inc.) and rabbit anti-BDNF antibody (1:1000, Santa Cruz Biotechnology Inc.) were used as primary antibodies.
In vivo experiments with 6-OHDA injection
According to the procedures described previously (Alvarez-Fischer et al., 2008), unilateral microinjection of 6-OHDA was carried out in the striatum of male C57BL/6 mice, 8- to 10-week old. The total number of animals used in this set of experiments was 54. Mice were anaesthetized by intraperitoneal injection of 50 mg·kg−1 pentobarbital, and 6-OHDA (2 µg·µL−1 in saline containing 0.2% ascorbic acid) was injected in one hemisphere at stereotaxic coordinates of 0.6 mm anterior to bregma, 1.8 mm lateral from the midline and 3.5 mm ventral to the surface of the dura mater. The same volume of saline containing 0.2% ascorbic acid was injected in the other hemisphere. Injection of 2 µL solution through a 30-gauge needle was performed over a period of 4 min, and the needle was kept in place for 3 min before withdrawal. CAPE (10 or 30 mg·kg−1) was intraperitoneally administered to mice for 14 consecutive days (once per day at 10:00–12:00 h). Control animals received the same volume of corn oil containing 1% DMSO without CAPE. Animals received 6-OHDA injection after 30 min at the day (10:00–12:00 h) of the first intraperitoneal administration of CAPE. At 15 days after 6-OHDA injection, immunohistochemical staining for TH was performed on six coronal midbrain sections of 50 µm thickness collected every 100 µm, by essentially the same procedures as those for LPS-injected mice described above. TH-positive cell counts were examined by stereological methods, with the usage of the optical fractionator Stereo Investigator software (Micro Bright Field, Williston, VT, USA). TH-positive cells were counted in grids randomly positioned by the software in the outlined counting area through all optical planes. Guard zones were set at 5 µm on both surface of the section and the resulting optical dissector was approximately 20 µm. The counting frame width and height was 100 µm. Cells were counted only if they touched the inclusion border or did not touch the exclusion border of the sampling grid. For semi-quantitative analysis of TH-immunoreactive area, bright-field images of coronal sections of the striatum were obtained with the use of a microscope (BZ-9000; KEYENCE, Osaka, Japan), and immunoreactive areas were quantified by ImageJ software.
For evaluation of rotational behaviour, mice received intraperitoneal administration of methamphetamine HCl (3 mg·kg−1) at 15 days after 6-OHDA injection. Total number of 360° rotations in the ipsilateral direction was counted for 75 min.
Data analysis
Results are expressed as means ± SEM. Data sets in Figures 1–4 and 7F were analyzed by one-way analysis of variance followed by post hoc comparisons by Student-Newman–Keuls test. Data sets in Figures 5–7 (except for Figures 5D and 7F) were analyzed by two-way anova with repeated measures, followed by post hoc comparisons with Bonferroni method. Data set in Figure 5D was analyzed by three-way anova with repeated measures, followed by post hoc comparisons with Bonferroni method. Two-tailed probability values less than 5% were considered significant.
Figure 1.
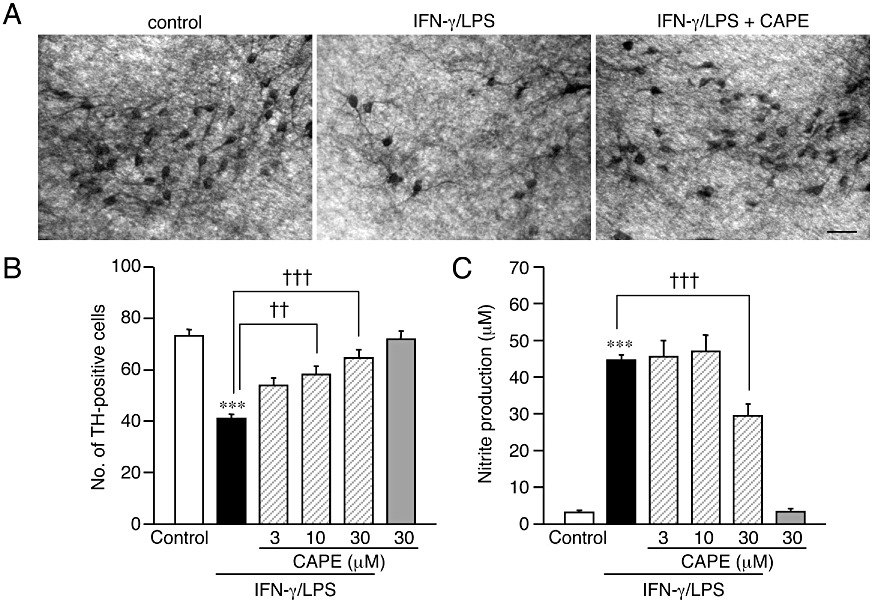
CAPE protects dopaminergic neurons from IFN-γ/LPS-induced injury in rat midbrain slice culture. (A) Representative photomicrographs showing the results of immunohistochemistry for TH on midbrain slice cultures. Slices were cultured under control conditions (left panel) or treated with 50 ng·mL−1 IFN-γ for 24 h followed by 10 µg·mL−1 LPS for 72 h in the absence (middle panel) or the presence (right panel) of 30 µM CAPE. Scale bar, 50 µm. (B, C) Effect of CAPE on IFN-γ/LPS-induced changes in the number of surviving dopaminergic neurons (B) and nitrite concentration in the medium (C). CAPE at indicated concentrations was concomitantly applied with 10 µg·mL−1 LPS for 72 h following 24 h treatment with 50 ng·mL−1 IFN-γ. Number of slices examined for each condition is 28–30. Values of nitrite concentrations are of 6 wells from five independent experiments. ***P < 0.001 versus control; ††P < 0.01, †††P < 0.001 (anova results: for panel B, F(5,168) = 16.77. P < 0.0001; for panel C, F(5,30) = 66.16, P < 0.0001).
Figure 4.
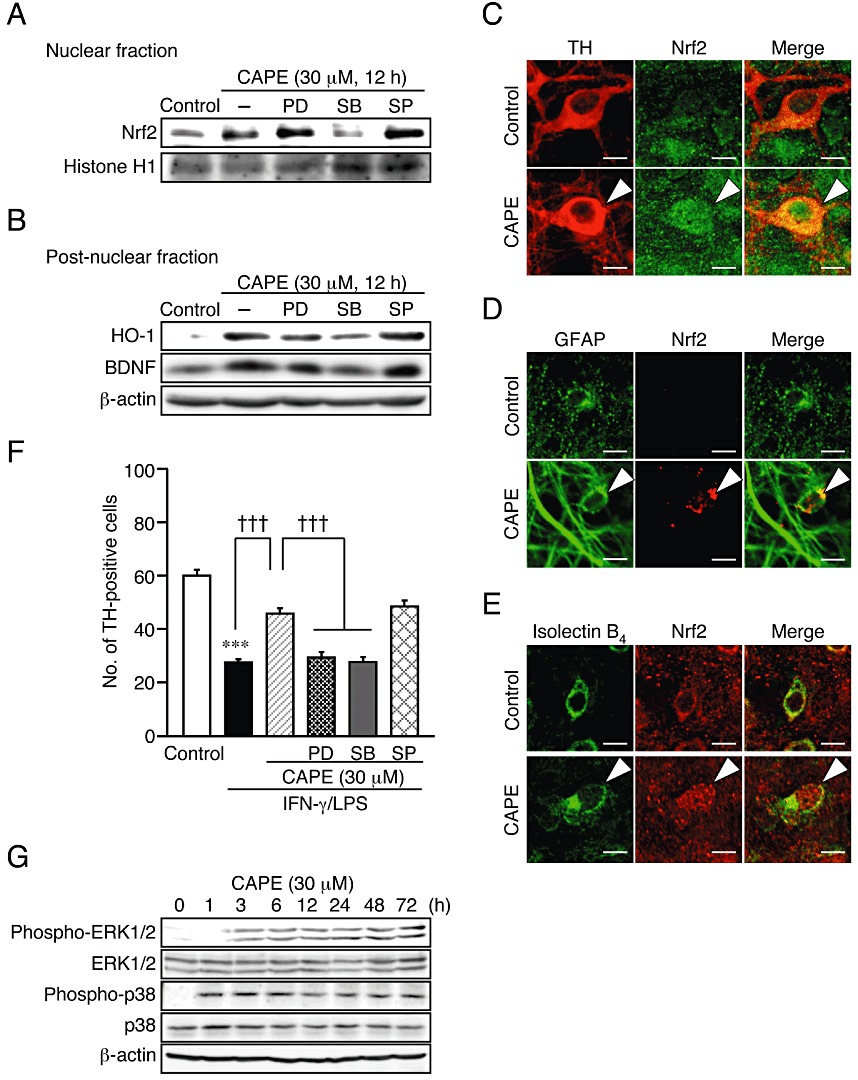
p38 MAPK signalling pathway is involved in Nrf2 activation and increase in expression of HO-1 and BDNF by CAPE. (A, B) Effect of MAPK inhibitors on CAPE-induced nuclear translocation of Nrf2 (A) and expression of HO-1 and BDNF (B). PD98059 (PD; 20 µM), SB203580 (SB; 50 µM) and SP600125 (SP; 10 µM) were applied concomitantly with 30 µM CAPE for 12 h. Nuclear fraction (A) and post-nuclear fraction (B) from six slices were pooled as one sample for Western blot analysis. (C–E) Confocal images of double immunofluorescence histochemistry of cell type markers as indicated (left panels) with Nrf2 (middle panels), and their merged images (right panels) in control cultures (upper panels) and cultures treated with 30 µM CAPE for 12 h. Arrowheads indicates nuclear localization of Nrf2. Scale bars, 10 µm. Cell type markers are TH (dopaminergic neurons), GFAP (astrocytes) and isolectin B4 (microglia). (F) Effect of MAPK inhibitors on the protective effect of CAPE on dopaminergic neurons. PD98059 (PD; 20 µM), SB203580 (SB; 50 µM), SP600125 (SP; 10 µM) and 30 µM CAPE were applied with 10 µg·mL−1 LPS for 72 h following 24 h treatment with 50 ng·mL−1 IFN-γ. Number of slices examined for each condition is 24–35. ***P < 0.001 versus control; †††P < 0.001 (anova results: F(5,189) = 50.12, P < 0.0001). (G) Western blot analysis of the effect of CAPE on the phosphorylation levels of ERK1/2 and p38 MAPK. Midbrain slice cultures were treated with 30 µM CAPE for indicated periods. Six slices for each condition were pooled as sample for each lane. Quantified results of experiments in panels A, B and G are shown in Supporting Information Figure S4.
Figure 7.
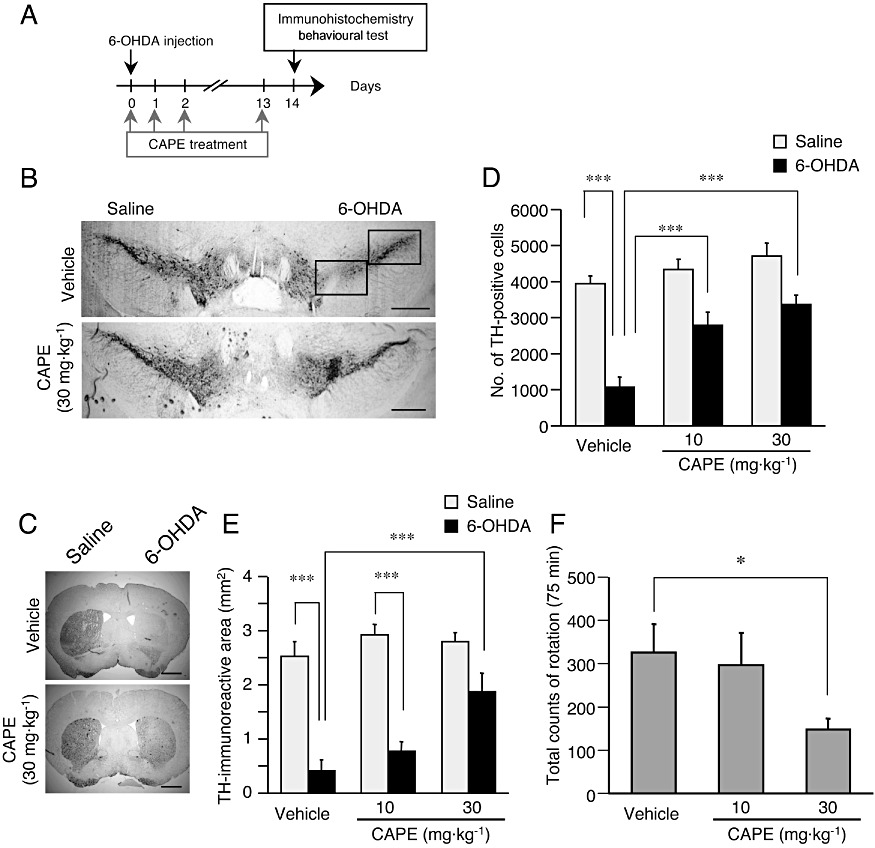
Neuroprotective effect of CAPE in 6-OHDA-injected mouse model. (A) Experimental schedule of 6-OHDA injection and CAPE administration. The first CAPE injection was made 30 min before LPS. (B, C) Representative photographs showing mouse midbrain sections containing SNpc (B) and the striatum (C) at 14 days after intrastriatal injection of 4 µg 6-OHDA in 2 µL saline containing 0.2% ascorbic acid. An equal volume of saline containing 0.2% ascorbic acid was injected into the contralateral side. Mice received daily injections of CAPE (10 or 30 mg·kg−1, i.p.) or vehicle (corn oil containing 1% DMSO) for 14 consecutive days from the day of 6-OHDA injection (the first CAPE injection was made 30 min before LPS). Positions of the frame for counting the number of TH-positive cells in SNpc are included in the photograph of a section from vehicle-treated animal. Scale bars, 500 µm (B) and 1 mm (C) respectively. (D) Summary of the effect of CAPE on 6-OHDA-induced decrease in the number of nigral dopaminergic neurons. n= 5 for each treatment. ***P < 0.001 (main effect of 6-OHDA: F(1,24) = 62.79, P < 0.0001; main effect of CAPE: F(2,24) = 14.03, P < 0.0001; interaction between effects of 6-OHDA and CAPE: F(2,24) = 3.948, P= 0.0329). (E) Summary of the effect of CAPE on 6-OHDA-induced decrease in TH-immunoreactive area (mm2). n= 5 for each treatment. ***P < 0.001 (main effect of 6-OHDA: F(1,24) = 80.55, P < 0.0001; main effect of CAPE: F(2,24) = 6.84, P= 0.0045; interaction between effects of 6-OHDA and CAPE: F(2,24) = 4.35, P= 0.025). (F) Effect of CAPE on methamphetamine-induced rotational behaviour. Rotational behaviour was assessed at 14 days after 6-OHDA injection. CAPE (10 or 30 mg·kg−1, i.p.) was given daily for fourteen consecutive days from the day of 6-OHDA injection (the first CAPE injection was made 30 min before LPS). The number of full 360° rotations in the ipsilateral direction was counted for 75 min after administration of methamphetamine (3 mg·kg−1, i.p.). n= 5 for each treatment. *P < 0.05 [anova results: F(2,14) = 7.24, P= 0.0087].
Figure 5.
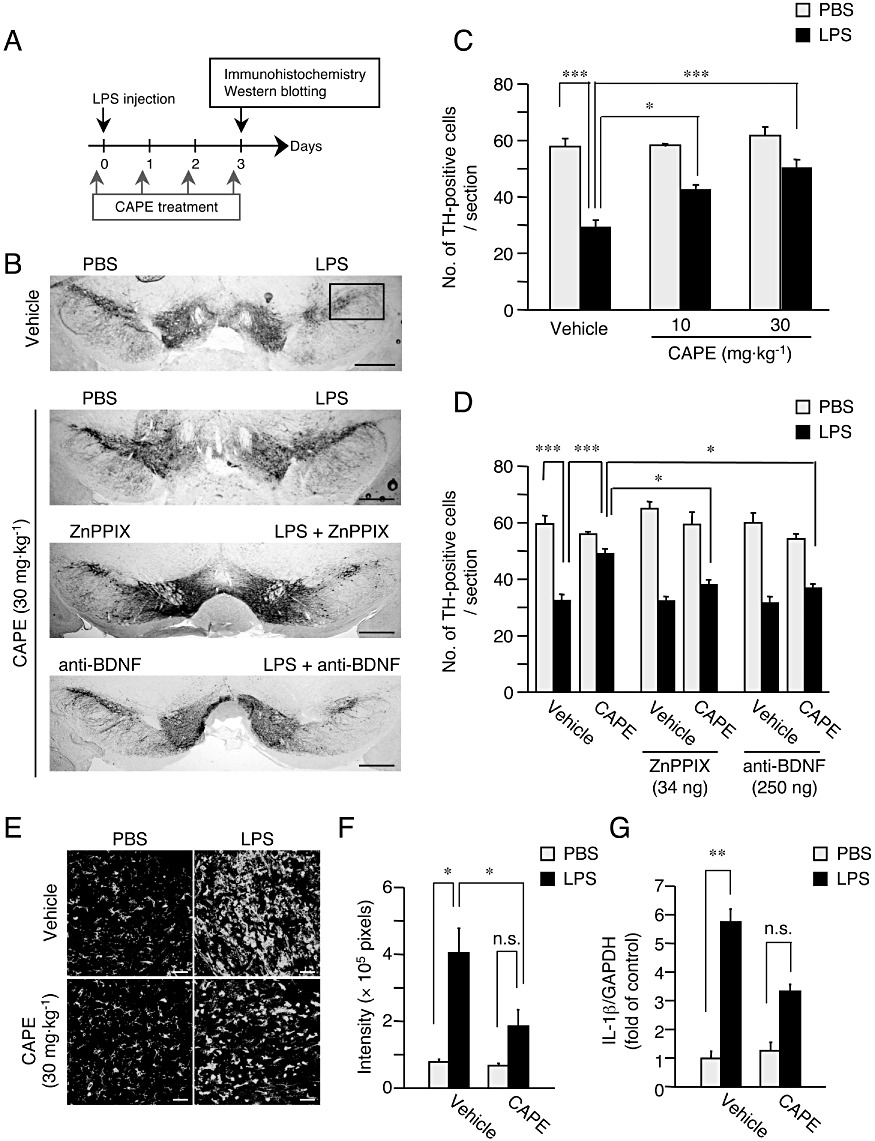
HO-1 and BDNF contribute to the neuroprotective effect of CAPE in vivo. (A) Experimental schedule of LPS injection and CAPE administration. The first CAPE administration was made 30 min before LPS injection. (B) Representative photographs showing mouse midbrain sections containing SNpc at 3 days after intranigral injection of 3 µg LPS in 1 µL PBS, in the presence or absence of ZnPPIX (34 ng) and anti-BDNF (250 ng). An equal volume of PBS in the presence or absence of ZnPPIX and anti-BDNF was injected into the contralateral side. Mice received daily administration of CAPE (10 or 30 mg·kg−1, i.p.) or vehicle (corn oil containing 1% DMSO) for four consecutive days from the day of LPS injection (the first CAPE administration was made 30 min before LPS injection). Positions of the frame for counting the number of TH-positive cells are included in the photograph of a section from vehicle-treated animal. Scale bar, 500 µm. (C) Summary of the effect of CAPE on changes in the number of nigral dopaminergic neurons. n= 5 for each treatment. *P < 0.05, ***P < 0.001 (main effect of LPS: F(1,24) = 62.3, P < 0.0001; main effect of CAPE: F(2,24) = 8.578, P= 0.0015; interaction between effects of LPS and CAPE: F(2,24) = 3.585, P= 0.0434). (D) Summary of the effect of ZnPPIX and anti-BDNF on CAPE-induced protection of nigral dopaminergic neurons. n= 5 for each treatment. *P < 0.05, ***P < 0.001 (main effect of LPS: F(1,48) = 7.663, P < 0.0001; main effect of CAPE: F(1,48) = 7.663, P < 0.01; main effect of (ZnPPIX and anti-BDNF): F(2,48) = 4.206, P < 0.05; interaction between effects of CAPE and (ZnPPIX and anti-BDNF): F(2,48) = 7.757, P < 0.01). (E) Effect of CAPE on the increase of isolectin B4-positive cells in SNpc induced by LPS injection. Mice received daily intraperitoneal administration of CAPE (30 mg·kg−1) for four consecutive days starting from the day of LPS injection (the first CAPE administration was made 30 min before LPS injection). Scale bar, 50 µm. (F) Semi-quantitative analysis of isolectin B4-positive cell area (pixels). n= 5 for each treatment. *P < 0.05 (main effect of LPS: F(1,36) = 40.90, P < 0.0001; main effect of CAPE: F(1,16) = 11.35, P= 0.0040; interaction between effects of LPS and CAPE: F(1,16) = 9.15, P= 0.0080). (G) Real-time quantitative RT-PCR analysis of the expression level of mRNA for IL-1β at 6 h after LPS injection. CAPE at 30 mg·kg−1 was administered 30 min before LPS injection. n= 5 for each treatment. **P < 0.01; n.s., not significant (main effect of LPS: F(1,16) = 181.08, P < 0.0001; main effect of CAPE: F(1,16) = 34.20, P < 0.0001; interaction between effects of LPS and CAPE: F(1,16) = 34.20, P < 0.0001).
Materials
Rat IFN-γ (PeproTech, Rocky Hill, NJ, USA) at 50 ng·mL−1 and LPS (from Escherichia coli, serotype 0111; B4; Sigma, St Louis, MO, USA) at 10 µg·mL−1 were used to activate microglia in slice cultures. LPS (3 µg) was also used to induce inflammation in SNpc in mice in vivo. An HO-1 inhibitor, zinc protoporphyrin IX (ZnPPIX; Biomol International, Plymouth Meeting, PA, USA), was used at 0.3–3 µM in culture experiments and at 34 µg for intranigral injection in in vivo experiments. Anti-human brain-derived neurotrophic factor (BDNF) polyclonal antibody (Promega Corp., Madison, MI, USA) was used at 5 µg·mL−1 in culture experiments and at 250 ng for intranigral injection. PD98059 (20 µM; Cayman Chemical, Ann Arbor, MI, USA) as an inhibitor of ERK pathway, SB203580 (50 µM; Cayman Chemical) as an inhibitor of p38 MAPK and SP600125 (10 µM; Alexis Biochemicals, San Diego, USA) as an inhibitor of JNK were used in culture experiments. 6-OHDA (MP Biomedicals, Tokyo, Japan) at 4 µg was used to produce the hemiparkinsonian model in mice. CAPE, supplied by API Co. Ltd (Gifu, Japan), was used at 1–100 µM in culture experiments and at 10 or 30 mg·kg−1 i.p. in in vivo experiments.
Results
CAPE protects dopaminergic neurons from IFN-γ/LPS-induced injury in rat midbrain slice cultures
Consistent with our previous observations (Kurauchi et al., 2009), treatment of midbrain slice cultures with IFN-γ (50 ng·mL−1) for 24 h followed by LPS (10 µg·mL−1) for 72 h significantly decreased the number of TH-positive dopaminergic neurons, which was accompanied by an increase in nitrite in culture medium. Concomitant application of CAPE (3–30 µM) with LPS markedly attenuated IFN-γ/LPS-induced dopaminergic cell death in a concentration-dependent manner (Figure 1A and B). We have previously shown that dopaminergic neuron loss observed under the present experimental conditions is dependent on NO production by the inducible isoform of NO synthase (iNOS) expressed in activated microglia (Shibata et al., 2003; Kurauchi et al., 2009). Treatment with 30 µM CAPE partially but significantly decreased NO production induced by IFN-γ/LPS (Figure 1C), suggesting that suppression of NO production from microglia contributed to the protective effect of CAPE on dopaminergic neurons. Indeed, CAPE is known as an inhibitor of NF-κB, and it suppressed the increase in iNOS protein expression induced by IFN-γ/LPS as assessed at 12 h after application of LPS (Figure S1B). However, the inhibitory effect of CAPE on iNOS expression was only partial. Moreover, MG132, another inhibitor of NF-κB activation (Ahmed et al., 2010; Zanotto-Filho et al., 2010a,b), did not protect dopaminergic neurons from IFN-γ/LPS-induced injury (data not shown). These observations implied that mechanisms other than suppression of NF-κB activation played an important role in the neuroprotective action of CAPE.
HO-1 and BDNF contribute to protection of dopaminergic neurons by CAPE
Next, we examined the involvement of HO-1 in CAPE-induced dopaminergic neuroprotection, as CAPE and other polyphenolic compounds have been shown to induce expression of HO-1 (Scapagnini et al., 2002; Wang et al., 2008b). Concomitant application of ZnPPIX (0.3–3 µM), an inhibitor of HO-1, attenuated the protective effect of CAPE on dopaminergic neurons in a concentration-dependent manner (Figure 2A). With regard to NO production, ZnPPIX (0.3–3 µM) reversed the effect of CAPE on IFN-γ/LPS-induced increase in nitrite concentration in culture medium, and the nitrite concentration in the presence of ZnPPIX actually exceeded that induced by IFN-γ/LPS alone (Figure 2B).
Figure 2.
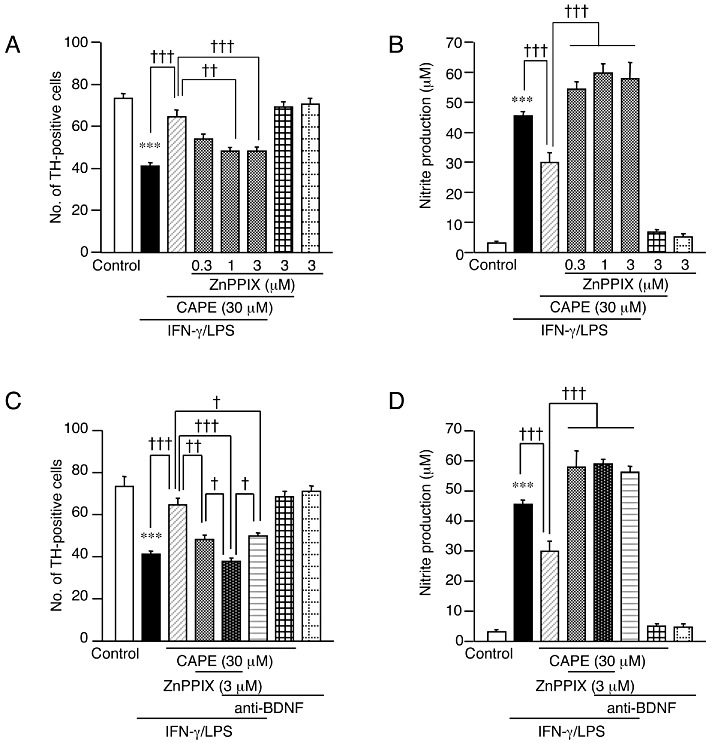
HO-1 and BDNF mediate the neuroprotective effect of CAPE. (A, B) Effect of an HO-1 inhibitor ZnPPIX on the protective effect of CAPE on dopaminergic neurons (A) and nitrite concentration in the medium (B). ZnPPIX and CAPE at indicated concentrations were concomitantly applied with 10 µg·mL−1 LPS for 72 h following 24 h treatment with 50 ng·mL−1 IFN-γ. Number of slices examined for each condition is 28–30. Values of nitrite concentrations are of 6 wells from five independent experiments. (C, D) Effect of anti-BDNF neutralizing antibody on the protective effect of CAPE on dopaminergic neurons (C) and nitrite concentration in the medium (D). Anti-BDNF (5 µg·mL−1), and ZnPPIX and CAPE at the indicated concentrations were applied with 10 µg·mL−1 LPS for 72 h following 24 h treatment with 50 ng·mL−1 IFN-γ. Number of slices examined for each condition is 27–30. Values of nitrite concentrations are of 6 wells from five independent experiments. ***P < 0.001 versus control; †P < 0.05, ††P < 0.01, †††P < 0.001 (anova results: for panel A, F(7,225) = 23.45, P < 0.0001; for panel B, F(7,40) = 107.39, P < 0.0001; for panel C, F(7,228) = 34.12, P < 0.0001; for panel D, F(7,40) = 126.92, P < 0.0001).
Polyphenolic compounds have also been reported to induce expression of neurotrophic factors such as BDNF in certain types of cells (Wang et al., 2008a; 2010a). Because BDNF can protect dopaminergic neurons (Katsuki et al., 2009; Kurauchi et al., 2011), we examined whether BDNF participated in dopaminergic neuroprotection by CAPE. Notably, anti-BDNF antibody (5 µg·mL−1) diminished the neuroprotective action of CAPE, and when applied together with ZnPPIX (3 µM), showed an additive effect in reversing the action of CAPE (Figure 2C). Reversal of the suppressive effect of CAPE on IFN-γ/LPS-induced NO production was observed with 5 µg·mL−1 anti-BDNF antibody alone as well as with 3 µM ZnPPIX (Figure 2D).
Because these results suggested that both HO-1 and BDNF were involved in the neuroprotective action of CAPE, we examined whether CAPE could increase the expression of HO-1 and BDNF. Western blot analysis demonstrated that application of CAPE (30 µM) to midbrain slice cultures increased expression of both proteins in a time-dependent manner (Figure 3A). HO-1 protein expression started to increase at 6 h, whereas the increase in BDNF protein expression started at 12 h after the onset of CAPE treatment. The increased expression of these proteins was sustained for 72 h. Moreover, 12-h treatment with CAPE (1–100 µM) increased the expression of HO-1 and BDNF in a concentration-dependent manner (Figure 3B). Increased expression of HO-1 and BDNF by 12-h treatment with 30 µM CAPE was also observed at mRNA levels assessed by quantitative real-time PCR analysis (Supporting Information Figure S2).
Figure 3.
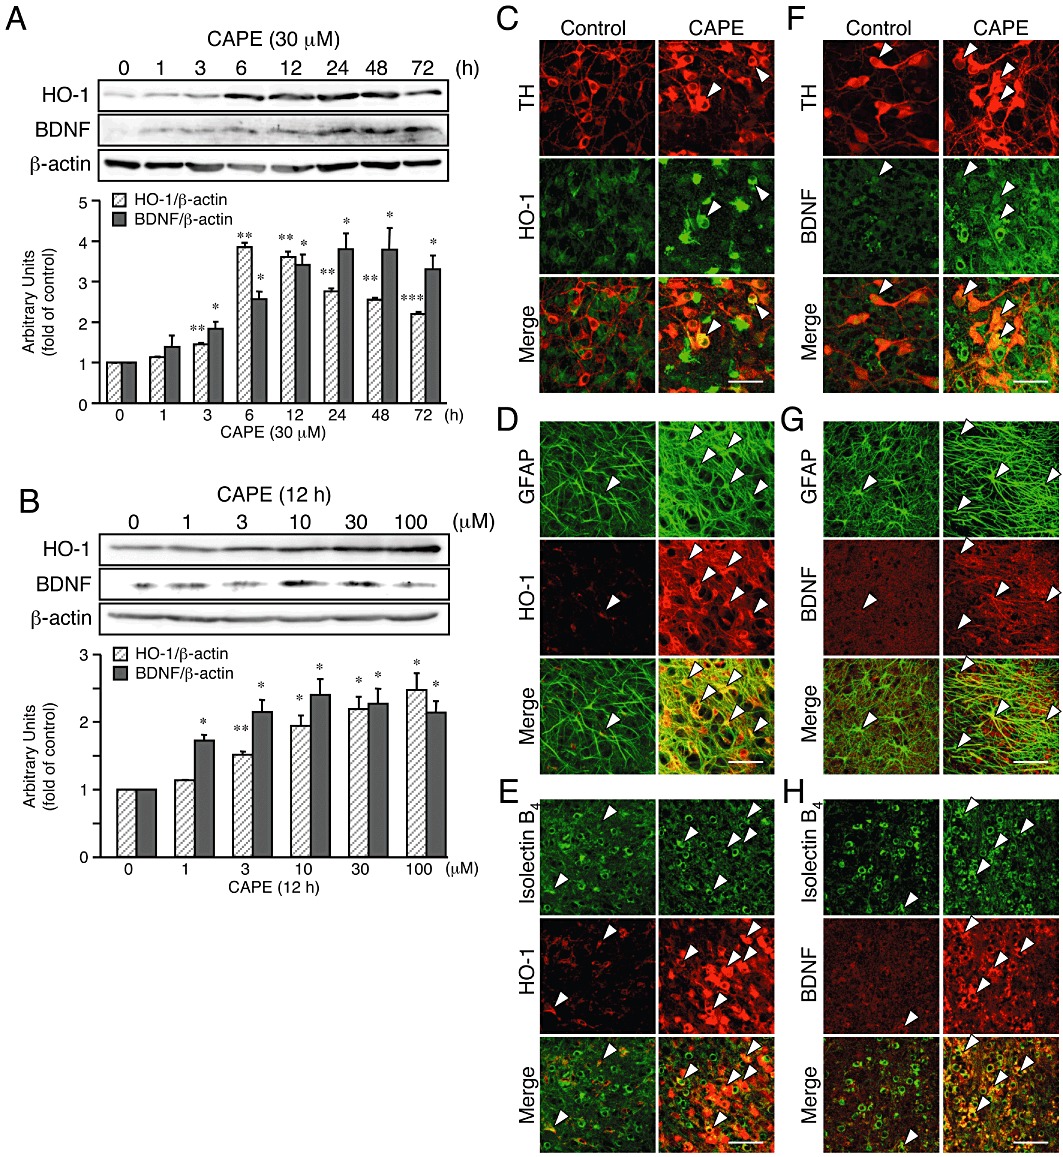
CAPE increases expression of HO-1 and BDNF in midbrain slice cultures. (A, B) Western blot analysis of the effect of CAPE on expression levels of proteins for HO-1 and BDNF. Six slices for each condition were pooled as sample for each lane. Midbrain slice cultures were treated with 30 µM CAPE for indicated periods (A) or with CAPE (1–100 µM) for 12 h (B). n= 3. *P < 0.05, **P < 0.01, ***P < 0.001 versus corresponding control (anova results: for HO-1 in panel A, F(7,16) = 223.64, P < 0.0001; for BDNF in panel A, F(7,16) = 12.92, P < 0.0001; for HO-1 in panel B, F(5,12) = 17.36, P < 0.0001; for BDNF in panel B, F(5,12) = 9.23, P= 0.0008). (C–H) Confocal images of double immunofluorescence histochemistry of cell type markers as indicated (upper panels) with HO-1 (C–E) and BDNF (F–H), respectively (middle panels), and their merged images (lower panels) in control cultures (left panels) and cultures treated with 30 µM CAPE for 12 h (right panels). Representative double-positive cells are indicated by arrowheads. Scale bars, 50 µm. Cell type markers are TH (dopaminergic neurons), GFAP (astrocytes) and isolectin B4 (microglia).
To identify the cell population that expressed HO-1 and BDNF proteins after CAPE treatment, we carried out double immunofluorescence staining against HO-1 or BDNF with cell type-specific markers (Figure 3C–H and see also Supporting Information Figure S3). Intense HO-1 immunoreactivity was observed in the majority of GFAP-positive astrocytes (69.8 ± 10.9%, as determined by doubly immunopositive area; n= 12) and isolectin B4-positive microglia (86.9 ± 2.7%, n= 12) after treatment with 30 µM CAPE for 12 h. At the same time, some TH-positive dopaminergic neurons (34.7 ± 3.1%, n= 12) exhibited HO-1 expression. On the other hand, intense BDNF immunoreactivity was observed in TH-positive dopaminergic neurons (24.5 ± 2.2%, n= 12) as well as in GFAP-positive astrocytes (28.0 ± 2.5%, n= 12) and isolectin B4-positive microglia (43.7 ± 5.2%, n= 12). Although a smaller population of these cells exhibited immunoreactivities for both HO-1 and BDNF even under control conditions (Supporting Information Figure S3), the expression levels were markedly increased after CAPE treatment. Additionally, there were no significant morphological alterations of isolectin B4-positive cells after application of CAPE alone, suggesting that inflammatory reactions did not contribute to the induction of HO-1 and BDNF proteins by CAPE.
CAPE increases Nrf2 nuclear localization leading to HO-1 up-regulation via p38 MAPK
A transcription factor Nrf2 regulates expression of phase II detoxifying enzymes including HO-1 (Alam et al., 1999; Balogun et al., 2003). To examine whether Nrf2 activation contributed to the action of CAPE, we confirmed Nrf2 nuclear localization by Western blot analysis and immunohistochemical analysis. In Western blot analysis, we observed that Nrf2 protein increased in the nuclear fraction of midbrain slice cultures after treatment with 30 µM CAPE for 12 h (Figure 4A and Supporting Information Figure S4A). Moreover, an intense Nrf2 immunoreactivity in the nucleus was detected in TH-positive dopaminergic neurons, GFAP-positive astrocytes and isolectin B4-positive microglia after treatment of midbrain slice cultures with 30 µM CAPE for 12 h (Figure 4C–E). Because MAPK signalling has been reported to regulate Nrf2 activation in various cell types (Cheng et al., 2010; Jeong et al., 2010), we next examined the effect of specific inhibitors of MAPK signalling pathways on Nrf2 nuclear localization and HO-1 protein expression induced by CAPE. Concomitant application of SB203580 (50 µM), an inhibitor of p38 MAPK, significantly prevented CAPE-induced Nrf2 nuclear localization, whereas PD98059 (20 µM), an inhibitor of ERK pathway, or SP600125 (10 µM), an inhibitor of JNK, had no effect (Figure 4A). In addition, only SB203580 significantly suppressed the increase in HO-1 expression (Figure 4B and Figure S4B), suggesting that p38 MAPK-dependent Nrf2 activation was involved in HO-1 protein expression induced by CAPE.
Glutamate cysteine ligase (GCL), comprises a modulatory subunit GCLM and a catalytic subunit GCLC and is a rate-limiting enzyme in glutathione synthesis. Expression of these GCL subunits are also transcriptionally regulated by Nrf2 (Lu, 2009), and we confirmed by quantitative real-time PCR analysis that CAPE increased levels of mRNAs encoding GCLM and GCLC as well as HO-1 (Supporting Information Figure S2).
Notably, SB203580 also prevented the increase in BDNF protein expression by CAPE (Figure 4B and Supporting Information Figure S4C). Therefore, we further examined the effect of MAPK inhibitors against dopaminergic neuroprotection by CAPE. As shown in Figure 4F, we found that PD98059 as well as SB203580 significantly attenuated the protective action of CAPE on dopaminergic neurons. These inhibitors alone had no significant effect on IFN-γ/LPS cytotoxicity (data not shown). SP600125 alone showed a significant but weak protective effect against IFN-γ/LPS cytotoxicity (data not shown), and the protective effect of CAPE was maintained in the presence of SP600125 (Figure 4F). Because ERK is implicated in downstream signalling of TrkB, a receptor of BDNF (Hu and Russek, 2008), activation of ERK resulting from increased BDNF expression may contribute to the protective effect of CAPE on dopaminergic neurons. Indeed, treatment of midbrain slice cultures with 30 µM CAPE increased the levels of phosphorylated form of ERK1/2 and p38 MAPK in a time-dependent manner, which lasted for 72 h after CAPE treatment (Figure 4G and Supporting Information Figure S4D and E).
CAPE protects dopaminergic neurons from LPS-induced toxicity in mice
Next, to examine whether CAPE could protect dopaminergic neurons in vivo, we evaluated the effect of CAPE in the LPS-injected mouse model (Figure 5A). At 3 days after intranigral injection of 3 µg LPS into one hemisphere, the number of TH-positive dopaminergic neurons of the injected side was significantly decreased, compared to that of the contralateral side. When mice received daily intraperitoneal administration of CAPE (10 or 30 mg·kg−1) for four consecutive days starting from the day of LPS injection (the first CAPE administration was given 30 min before LPS injection), the decrease in the number of dopaminergic neurons was prevented in a dose-dependent manner (Figure 5B and C). Because HO-1 and BDNF contributed to the effect of CAPE on dopaminergic neuroprotection in vitro, we examined the role of HO-1 and BDNF in the effect of CAPE in vivo. For this purpose, we locally applied ZnPPIX (34 ng) or anti-BDNF antibody (250 ng), concomitantly with LPS in the substantia nigra. As shown in Figure 5D, ZnPPIX or anti-BDNF antibody significantly blocked the protective effect of 30 mg·kg−1 CAPE on dopaminergic neurons. ZnPPIX and anti-BDNF antibody had no effect on the number of dopaminergic neurons in vehicle-treated mice.
We further examined whether anti-inflammatory effects contributed to the protective action of CAPE on dopaminergic neurons. At 3 days after intranigral injection of 3 µg LPS in one hemisphere, the area occupied by isolectin B4-positive cells exhibiting a rounded form increased in the ipsilateral side when compared to that in the contralateral side (Figure 5E and F). This observation suggests that accumulation of activated microglia/macrophages occurred in response to LPS injection in SNpc. On the other hand, CAPE at 30 mg·kg−1, given 30 min before LPS injection and thereafter once daily for 3 days, significantly prevented LPS-induced increase in area occupied by isolectin B4-positive cells and partially prevented morphological alteration of the cells from the ramified form to the activated form (Figure 5E and F). We also examined expression levels of IL-1β, because IL-1β has been suggested to mediate neurotoxic effects of LPS on dopaminergic neurons in vivo (Arai et al., 2004). A single intraperitoneal administration of 30 mg·kg−1 CAPE 30 min before LPS injection attenuated the increase in IL-1β mRNA expression at 6 h after injection of LPS, further suggesting that the protective effect of CAPE on dopaminergic neurons was associated with anti-inflammatory actions (Figure 5G).
CAPE up-regulates HO-1 and BDNF in LPS-injected mouse model
Next, we assessed whether CAPE induced expression of HO-1 and BDNF in the LPS-injected mouse model. At 3 days after intranigral injection of LPS in one hemisphere, we observed by Western blot analysis that both HO-1 and BDNF in the midbrain region ipsilateral to the site of LPS injection increased as compared with that of the contralateral side (Figure 6A–C). Moreover, treatment with CAPE for four consecutive days (the first administration was made 30 min before LPS injection) increased expression of HO-1 and BDNF proteins. Because CAPE was administered systemically, increased expression of HO-1 and BDNF was observed in the midbrain region contralateral as well as ipsilateral to the site of LPS injection, as compared to the control side (contralateral to the site of LPS injection) of vehicle-treated animals (Figure 6A–C). To identify the cell population that expressed HO-1 and BDNF proteins after CAPE treatment, we carried out double immunofluorescence staining against HO-1 or BDNF with cell type-specific markers. In the absence of CAPE treatment, although a small number of both TH-positive cells and GFAP-positive cells ipsilateral to the site of LPS injection expressed HO-1, a large number of isolectin B4-positive cells with the rounded form accumulating in SNpc, which were considered to be activated microglia/macrophages, expressed HO-1 (Figure 6D–F). We also found that isolectin B4-positive cells exhibiting the ramified form in the contralateral side, which represented microglia in resting state, also expressed HO-1 (Figure 6F). BDNF up-regulation by LPS treatment was mainly found in isolectin B4-positive cells smaller than 10 µm in diameter that corresponded to infiltrated lymphocytes such as neutrophils in injured area (Figure 6I). Notably, intraperitoneal administration of 30 mg·kg−1 CAPE induced expression of HO-1 and BDNF mainly in TH-positive cells in both hemispheres (Figure 6D and G). On the other hand, we did not observe BDNF expression in GFAP-positive cells after four consecutive days of treatment with CAPE (Figure 6H).
Figure 6.
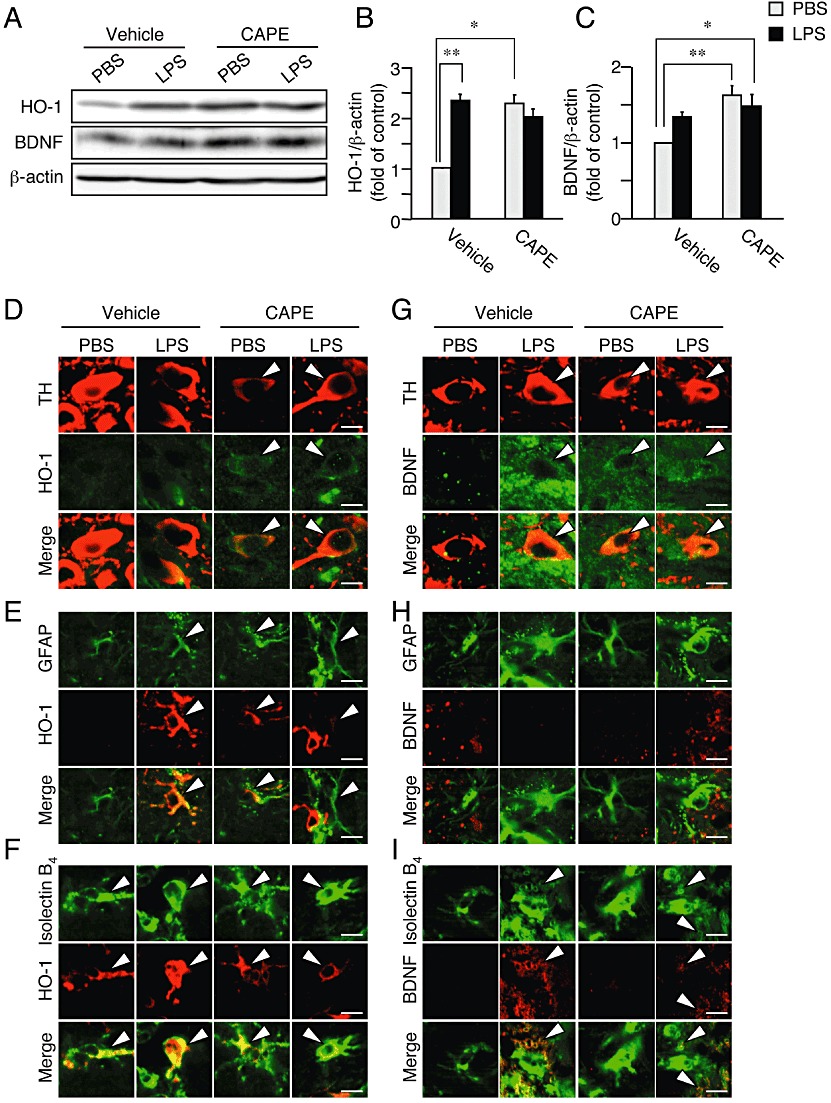
CAPE increases expression of HO-1 and BDNF in vivo. Midbrain regions from mice at 3 days after intranigral injection of LPS or PBS in one hemisphere were analyzed by Western blot (A–C) and immunofluorescence histochemistry (D–I). Mice received daily injections of CAPE (30 mg·kg−1, i.p.) or vehicle (corn oil containing 1% DMSO) for four consecutive days from the day at LPS injection (the first CAPE injection was made 30 min before LPS injection). (A) Representative blots showing the effect of LPS and CAPE on protein levels of HO-1 and BDNF. (B) Summary of the effect of CAPE on expression level of HO-1protein. n= 5. *P < 0.05, **P < 0.01 (main effect of LPS: F(1,16) = 13.83, P= 0.0019; main effect of CAPE: F(1,16) = 17.80, P= 0.00065; interaction between effects of LPS and CAPE: F(1,16) = 38.47, P < 0.0001). (C) Summary of the effect of CAPE on expression level of BDNF protein. n= 5. *P < 0.05, **P < 0.01 (main effect of LPS: F(1,16) = 0.89, P= 0.36; main effect of CAPE: F(1,16) = 13.65, P= 0.0020; interaction between effects of LPS and CAPE: F(1,16) = 5.30, P= 0.035). (D–I) Confocal images of double immunofluorescence histochemistry of cell type markers as indicated (upper panels) with HO-1 (D–F) and BDNF (G–I), respectively (middle panels), and their merged images (lower panels). Doubly positive cells are indicated by arrowheads. Scale bars, 10 µm. Cell type markers are TH (dopaminergic neurons), GFAP (astrocytes) and isolectin B4 (microglia/macrophages).
CAPE alleviates dopaminergic neurotoxicity and behavioural abnormality in 6-OHDA-lesioned hemiparkinsonian mice
Dopaminergic neuron loss induced by intranigral injection of LPS did not accompany appreciable changes in TH immunoreactivity in the striatum, at least at 3 days after LPS injection (data not shown), which hampered evaluation of drug effects on dopaminergic projections and terminals. Accordingly, we further examined the effect of CAPE using hemiparkinsonian mice made by intrastriatal injection of 6-OHDA. 6-OHDA is considered a selective dopaminergic neurotoxin when injected into the striatum (Alvarez-Fischer et al., 2008). At 14 days after intrastriatal injection of 6-OHDA in one hemisphere of C57BL/6 mice, the number of TH-positive neurons in the ipsilateral SNpc decreased significantly. Daily intraperitoneal administration of CAPE (10 or 30 mg·kg−1) for 14 consecutive days starting from the day of 6-OHDA injection (the first CAPE administration was given 30 min before 6-OHDA injection) preserved TH-positive neurons (Figure 7A, B and D). In the striatum, TH immunoreactivity was detected in fibres and terminals of dopaminergic neurons. Although the area immunoreactive for TH in the striatum ipsilateral to the site of 6-OHDA injection after 14 days was almost completely absent in vehicle control, TH immunoreactivity in the striatum was preserved in mice that received daily intraperitoneal administration of 30 mg·kg−1 CAPE (Figure 7C and E).
We also examined the effect of CAPE on a behavioural parameter that reflected the imbalance in dopaminergic activity. Consistent with hemi-lesion of dopaminergic projection to the striatum, intraperitoneal administration of 3 mg·kg−1 methamphetamine in mice at 14 days after 6-OHDA injection induced rotational behaviour, in the direction ipsilateral to the lesioned side (Figure 7F). On the other hand, the number of rotation was significantly reduced in mice that received daily administration of 30 mg·kg−1 CAPE starting from 30 min before 6-OHDA injection (Figure 7F). Repeated administration of CAPE did not cause obvious adverse effects, as shown in changes in body weight after 6-OHDA injection (Supporting Information Figure S5).
Discussion and conclusions
Several studies on ischaemic injury, inflammatory stress and oxidative stress have demonstrated neuroprotective effects of CAPE (Montpied et al., 2003; Noelker et al., 2005; Altuğet al., 2008; Celik and Erdogan, 2008). For example, daily treatment of neonatal rats with CAPE (40 mg·kg−1, i.p.) prevented brain tissue loss induced by hypoxia-ischaemia (Wei et al., 2004). In adult rats, administration of CAPE (1–10 mg·kg−1, i.v.) at reperfusion following transient focal ischaemia reduced infarct volume (Khan et al., 2007). CAPE is assumed to penetrate cellular membranes and cross the blood-brain barrier (Son and Lewis, 2002; Khan et al., 2007). Although the protective effects were associated with reduction of oxidative stress markers and reduced expression of pro-inflammatory cytokines (Khan et al., 2007), detailed mechanisms of actions of CAPE have been elusive. Here, we have demonstrated that CAPE protected midbrain dopaminergic neurons in vitro and also in vivo at doses (10 and 30 mg·kg−1, i.p.) comparable to those in studies mentioned above. Notably, in addition to its known ability to induce HO-1 expression, CAPE exhibited novel properties as an inducer of BDNF expression, and both HO-1 and BDNF may contribute to the neuroprotective effect of CAPE.
In midbrain slice cultures, CAPE protected dopaminergic neurons from IFN-γ/LPS-induced injury. Involvement of HO-1 and BDNF in the protective effect of CAPE was suggested by reversal of the effect in the presence of ZnPPIX and anti-BDNF. A higher concentration (30 µM) of CAPE suppressed NO production, which may contribute to protection of dopaminergic neurons. Indeed, CAPE is an inhibitor of NF-κB activation and inhibits iNOS gene expression (Natarajan et al., 1996; Abdel-Latif et al., 2005; Lee et al., 2010). However, under the present experimental conditions, the suppressive effect of CAPE on iNOS expression and NO production was partial. Moreover, a lower concentration (10 µM) of CAPE showed a neuroprotective effect without altering NO production. Interestingly, both ZnPPIX and anti-BDNF reversed suppression of NO production by CAPE. ZnPPIX actually increased NO production over the level achieved by IFN-γ/LPS alone, which may be related to the fact that HO-1 expressed under control conditions acts to limit NO production (Min et al., 2006). Similarly, BDNF suppresses NO production from microglia (Nakajima et al., 1998), which may be responsible for the overshooting effect of anti-BDNF antibody on nitrite concentration in IFN-γ/LPS-treated cultures. These results suggest that HO-1 and BDNF are primary mediators of the neuroprotective effect of CAPE, regardless of whether suppression of NO production contributes to neuroprotection.
HO-1 gene delivery into SNpc of rats protects dopaminergic neurons from MPP+ toxicity (Hung et al., 2008; 2010). Moreover, HO-1 may act as an endogenous protective system of dopaminergic neurons (Kurauchi et al., 2009). Therefore, the initial aim of the present study was to clarify whether pharmacological induction of HO-1 can protect dopaminergic neurons. As expected from previous reports demonstrating HO-1 induction by CAPE (Scapagnini et al., 2002; Wang et al., 2010b), CAPE induced robust expression of HO-1 in midbrain slice cultures. Scapagnini et al. (2002) showed that CAPE increased HO-1 expression in cultured astrocytes, whereas cell types exhibiting HO-1 expression in the present study included dopaminergic neurons and microglia as well as astrocytes. HO-1 expressed in all these cell types may exert neuroprotective effects because HO-1 produces diffusible molecules such as carbon monoxide and bilirubin, both of which can be cytoprotective (Ryter et al., 2006; Scott et al., 2007). In addition, HO-1 up-regulation in glial cells prevents excessive brain inflammation (Min et al., 2006).
HO-1 expression is transcriptionally regulated by Nrf2 (Alam et al., 1999; Balogun et al., 2003), which is bound to Keap1 in the cytoplasm. Upon modification of thiol groups of Keap1, Nrf2 dissociates, translocates into the nucleus and binds to the promoter region of target genes (Itoh et al., 1999; Balogun et al., 2003). Additionally, MAPK signalling pathways mediate nuclear localization of Nrf2 in several cell types (Cheng et al., 2010; Jeong et al., 2010). We found that CAPE induced activation of p38 MAPK and nuclear localization of Nrf2. Moreover, nuclear translocation of Nrf2 and induction of HO-1 were diminished by a p38 MAPK inhibitor SB203580. In line with these results, curcumin and cadmium promote HO-1 expression in NRK-52E cells and in MCF-7 cells, respectively, via sequential stimulation of p38 MAPK and Nrf2 (Alam et al., 2000; Balogun et al., 2003). In the present study, SB203580 reversed the protective effect of CAPE on dopaminergic neurons, substantiating a pivotal role of p38 MAPK-mediated recruitment of Nrf2 and HO-1.
Anti-BDNF antibody abolished the effect of CAPE and CAPE induced up-regulation of BDNF expression in midbrain slice cultures, suggesting involvement of BDNF in the neuroprotective effect of CAPE. Notably, up-regulation of BDNF was attenuated by SB203580. In this context, p38 MAPK-mediated increase in BDNF expression has been reported in rat hippocampal granule neurons in vivo and in rat microglia in culture (Katoh-Semba et al., 2009; Trang et al., 2009). Another possible mechanism is that induction of HO-1 (which is p38 MAPK-dependent) mediates up-regulation of BDNF, as reported in studies of HO-1 overexpression (Hung et al., 2008; 2010). Indeed, we observed that CAPE-induced BDNF up-regulation was in part attenuated by ZnPPIX (data not shown), suggesting partial involvement of HO-1 in BDNF expression. In contrast, PD98059 did not affect CAPE-induced expression of BDNF, although ERK1/2 regulates BDNF gene expression in several types of cells (Greer and Greenberg, 2008; Kurauchi et al., 2011). Notably, PD98059 could cancel the neuroprotective effect of CAPE on dopaminergic neurons and ERK1/2 is also known as a downstream signalling component of TrkB (Hu and Russek, 2008; Katsuki et al., 2009). Therefore, ERK1/2 may be involved in the neuroprotective effect, but not in up-regulation, of BDNF induced by CAPE.
Systemic administration of CAPE protected dopaminergic neurons against LPS-induced injury and the effects of ZnPPIX or anti-BDNF strongly suggest that HO-1 and BDNF contribute to the neuroprotective action of CAPE also in vivo. CAPE induced expression of HO-1 and BDNF in cells in SNpc in both hemispheres. Notably, LPS by itself increased expression of HO-1 and BDNF in the injected side, which is considered as endogenous protective mechanism that limits neuronal degeneration. A major difference between the effect of CAPE and that of LPS was that CAPE was more potent than LPS in inducing HO-1 expression in dopaminergic neurons. Importantly, HO-1 expression in dopaminergic neurons may be more relevant to neuroprotection than that in other cell populations (Kurauchi et al., 2009). The effect of CAPE on BDNF expression was again prominent in dopaminergic neurons than in other cell types, whereas LPS-induced BDNF expression was observed mainly in isolectin B4-positive cells. Mechanisms of LPS-induced up-regulation of HO-1 and BDNF in non-neuronal cells may well be different from those of CAPE-induced up-regulation in dopaminergic neurons (Mellstrom et al., 2004; Alam and Cook, 2007). Overall, the present results suggest that cell-autonomous effects of HO-1 and BDNF in dopaminergic neurons are, at least in part, responsible for the neuroprotective effect of CAPE. We also observed that CAPE attenuated LPS-induced increase in activated microglia/macrophages and expression of IL-1β mRNA, both of which may contribute to the neuroprotective effect of CAPE. Whether there is a causal relationship between these anti-inflammatory effects and up-regulation of HO-1 and BDNF should be addressed in further investigations.
The LPS model did not display obvious changes in TH immunoreactivity in the striatum at this early time point of 3 days (data not shown), although degeneration of dopaminergic terminals may occur after several weeks and months (Herrera et al., 2000). Therefore, we examined the effect of CAPE using 6-OHDA-injected hemiparkinsonian mice. 6-OHDA is taken up by dopaminergic neurons through dopamine transporters and is oxidized to form hydrogen peroxide and p-quinone derivatives, which cause disruption of dopaminergic projection. In addition to these oxidative stress-related processes, 6-OHDA cytotoxicity involves inflammatory components, because the microglial inhibitor minocycline protected dopaminergic neurons from 6-OHDA injury (Orr et al., 2002; Miller et al., 2009). The 6-OHDA model exhibits a quantifiable motor deficit (Dunnett and Björklund, 1999; Inden et al., 2005). We found that CAPE alleviated 6-OHDA-induced decrease in the number of dopaminergic neurons in SNpc and TH immunoreactivity in the striatum. Methamphetamine-induced rotational behaviour was also diminished by CAPE, indicating that preserved dopaminergic projections were functional. HO-1 and BDNF may well be involved in the neuroprotective effect of CAPE in this model, because both molecules have been shown to protect dopaminergic neurons from 6-OHDA cytotoxicity (Spina et al., 1992; Yamamoto et al., 2010).
In conclusion, CAPE protected midbrain dopaminergic neurons. A notable property of CAPE is its ability to recruit two distinct types of neuroprotective molecule, HO-1 and BDNF, and both play critical roles in dopaminergic neuroprotection. Although the relative contribution of these molecules and the respective cell types (neurons, astrocytes and microglia) to dopaminergic neuroprotection may be further explored by additional experimental strategies such as cell type-specific manipulation of gene expression of HO-1 and BDNF, the current findings may provide novel clues to develop neuroprotective pharmaceuticals that are eagerly demanded for treatment of neurodegenerative disorders including Parkinson's disease.
Acknowledgments
We thank API Co. Ltd. for providing CAPE. This work was supported by Takeda Science Foundation, Yamazaki Spice Promotion Foundation and The Ministry of Education, Culture, Sports, Science and Technology, Japan (Grant-in-Aid for Scientific Research 20390026, 23117714).
Glossary
- 6-OHDA
6-hydroxydopamine
- BDNF
brain-derived neurotrophic factor
- CAPE
caffeic acid phenethyl ester
- GCL
glutamate cysteine ligase
- GCLC
catalytic subunit of GCL
- GCLM
modifier subunit of GCL
- GFAP
glial fibrillary acidic protein
- HO
haem oxygenase
- iNOS
inducible isoform of nitric oxide synthase
- MPP+
1-methyl-4-phenylpyridinium
- Nrf2
NF-E2-related factor 2
- SNpc
substantia nigra pars compacta
- ZnPPIX
zinc protoporphyrin IX
Conflicts of interest
None.
Supporting information
Additional Supporting Information may be found in the online version of this article:
Figure S1 CAPE attenuates iNOS protein expression induced by IFN-γ/LPS. (A) Chemical structure of CAPE. (B) Effect of CAPE on IFN-γ/LPS-induced increase in iNOS protein expression. CAPE at indicated concentrations were concomitantly applied with 10 µg·mL−1 LPS for 12 h following 24 h treatment with 50 ng·mL−1 IFN-γ. Six slices were pooled as one sample for Western blot analysis. Mouse anti-iNOS antibody (1:5000, BD Transduction Laboratories, San Diego, CA, USA) and mouse anti-β-actin antibody (1:1000, Sigma) were used as primary antibodies.
Figure S2 Results of real-time quantitative reverse transcription PCR analysis of the effect of CAPE on expression levels of mRNA for HO-1, BDNF, GCLM, and GCLC. Midbrain slice cultures were treated with 30 µM CAPE for 12 h. Six slices were pooled as one sample. n = 3. Real-time PCR was performed with SYBR® Premix Ex Taq™ (TaKaRa) on a Chromo4™ realtime PCR analysis system (Bio-Rad, Tokyo, Japan). Samples were run in duplicate. The thermal cycling program consisted of 95°C for 3 min for polymerase activation, and then 40 cycles of denaturation (95°C for 15 s) and annealing and extension (60°C for 1 min). Data were analyzed by the comparative Ct method. The primer sequences were: HO-1 forward 5′-ACTTTCAGAAGGGTCAGGTGTCC-3′, HO-1 reverse 5′-TTGAGCAGGAAGGCGGTCTTAG-3′, BDNF forward 5′-CCCAACGAAGAAAACCATAAG-3′, BDNF reverse 5′-CCCACTCGCTAATACTGTCAC-3′, GCLM forward 5′-AATCAGCCCTGATTTGGTCAGG-3′, GCLM reverse 5′-CCAGCTGTGCAACTCCAAGGAC-3′, GCLC forward 5′-TTACCGAGGCTACGTGTCAGAC-3′, GCLC reverse 5′-TGTCGATGGTCAGGTCGATGTC-3′, GAPDH forward 5′-ACCATCTTCCAGGAGCGAGA-3′, GAPDH reverse 5′-CAGTCTTCTGGGTGGCAGTG-3′.
Figure S3 CAPE increases HO-1 and BDNF expression in distinct cell populations. Fields of the substantia nigra in midbrain slices (as identified by TH staining) were chosen at random and images were collected in the combinations of specific cell markers with HO-1 or with BDNF. Three or four fields in individual slices were imaged, and doubly positive cell area (%) was quantified by ImageJ software. n = 12 for each treatment. *P < 0.05, **P < 0.01 versus control by non-parametric Kruskal–Wallis test followed by Dunn’s multiple range test.
Figure S4 Results of quantification of band intensities in experiments shown in Figure 4A, B and G in the main text. (A–C) Effect of MAPK inhibitors on CAPE-induced nuclear translocation of Nrf2 (A) and expression of HO-1 (B) and BDNF (C). PD98059 (PD; 20 µM), SB203580 (SB; 50 µM) and SP600125 (SP; 10 µM) were applied concomitantly with 30 µM CAPE for 12 h. n = 5. ***P < 0.001 versus control, †P < 0.05 by non-parametric Kruskal–Wallis test followed by Dunn’s multiple range test. (D and E) Effect of CAPE on the phosphorylation levels of ERK1/2 and p38 MAPK. Midbrain slice cultures were treated with 30 µM CAPE for indicated periods. n = 5. **P < 0.01 versus 0 h by non-parametric Kruskal–Wallis test followed by Dunn’s multiple range test.
Figure S5 Changes in body weight of mice after intrastriatal injection of 6-OHDA with or without daily intraperitoneal administration of CAPE at indicated doses. n = 5 for each group.
Please note: Wiley-Blackwell are not responsible for the content or functionality of any supporting materials supplied by the authors. Any queries (other than missing material) should be directed to the corresponding author for the article.
References
- Abdel-Latif MM, Windle HJ, Homasany BS, Sabra K, Kelleher D. Caffeic acid phenethyl ester modulates Helicobacter pylori-induced nuclear factor-kappa B and activator protein-1 expression in gastric epithelial cells. Br J Pharmacol. 2005;146:1139–1147. doi: 10.1038/sj.bjp.0706421. [DOI] [PMC free article] [PubMed] [Google Scholar]
- Ahmed AS, Li J, Ahmed M, Hua L, Yakovleva T, Ossipov MH, et al. Attenuation of pain and inflammation in adjuvant-induced arthritis by the proteasome inhibitor MG132. Arthritis Rheum. 2010;62:2160–2169. doi: 10.1002/art.27492. [DOI] [PubMed] [Google Scholar]
- Alam J, Cook JL. How many transcription factors does it take to turn on the heme oxygenase-1 gene? Am J Respir Cell Mol Biol. 2007;36:166–174. doi: 10.1165/rcmb.2006-0340TR. [DOI] [PubMed] [Google Scholar]
- Alam J, Stewart D, Touchard C, Boinapally S, Choi AM, Cook JL. Nrf2, a Cap'n'Collar transcription factor, regulates induction of the heme oxygenase-1 gene. J Biol Chem. 1999;274:26071–26078. doi: 10.1074/jbc.274.37.26071. [DOI] [PubMed] [Google Scholar]
- Alam J, Wicks C, Stewart D, Gong P, Touchard C, Otterbein S, et al. Mechanism of heme oxygenase-1 gene activation by cadmium in MCF-7 mammary epithelial cells. Role of p38 kinase and Nrf2 transcription factor. J Biol Chem. 2000;275:27694–27702. doi: 10.1074/jbc.M004729200. [DOI] [PubMed] [Google Scholar]
- Altuğ ME, Serarslan Y, Bal R, Kontaş T, Ekici F, Melek IM, et al. Caffeic acid phenethyl ester protects rabbit brains against permanent focal ischemia by antioxidant action: a biochemical and planimetric study. Brain Res. 2008;1201:135–142. doi: 10.1016/j.brainres.2008.01.053. [DOI] [PubMed] [Google Scholar]
- Alvarez-Fischer D, Henze C, Strenzke C, Westrich J, Ferger B, Höglinger GU, et al. Characterization of the striatal 6-OHDA model of Parkinson's disease in wild type and α-synuclein-deleted mice. Exp Neurol. 2008;210:182–193. doi: 10.1016/j.expneurol.2007.10.012. [DOI] [PubMed] [Google Scholar]
- Arai H, Furuya T, Yasuda T, Miura M, Mizuno Y, Mochizuki H. Neurotoxic effects of lipopolysaccharide on nigral dopaminergic neurons are mediated by microglial activation, interleukin-1β, and expression of caspase-11 in mice. J Biol Chem. 2004;279:51647–51653. doi: 10.1074/jbc.M407328200. [DOI] [PubMed] [Google Scholar]
- Balogun E, Hoque M, Gong P, Killeen E, Green CJ, Foresti R, et al. Curcumin activates the haem oxygenase-1 gene via regulation of Nrf2 and the antioxidant-responsive element. Biochem J. 2003;371:887–895. doi: 10.1042/BJ20021619. [DOI] [PMC free article] [PubMed] [Google Scholar]
- Celik S, Erdogan S. Caffeic acid phenethyl ester (CAPE) protects brain against oxidative stress and inflammation induced by diabetes in rats. Mol Cell Biochem. 2008;312:39–46. doi: 10.1007/s11010-008-9719-3. [DOI] [PubMed] [Google Scholar]
- Cheng SE, Lee IT, Lin CC, Kou YR, Yang CM. Cigarette smoke particle-phase extract induces HO-1 expression in human tracheal smooth muscle cells: role of the c-Src/NADPH oxidase/MAPK/Nrf2 signaling pathway. Free Radic Biol Med. 2010;48:1410–1422. doi: 10.1016/j.freeradbiomed.2010.02.026. [DOI] [PubMed] [Google Scholar]
- Dauer W, Przedborski S. Parkinson's disease: mechanisms and models. Neuron. 2003;39:889–909. doi: 10.1016/s0896-6273(03)00568-3. [DOI] [PubMed] [Google Scholar]
- Dodson MW, Guo M. Pink1, Parkin, DJ-1 and mitochondrial dysfunction in Parkinson's disease. Curr Opin Neurobiol. 2007;17:331–337. doi: 10.1016/j.conb.2007.04.010. [DOI] [PubMed] [Google Scholar]
- Dunnett SB, Björklund A. Prospects for new restorative and neuroprotective treatments in Parkinson's disease. Nature. 1999;399:A32–A39. doi: 10.1038/399a032. [DOI] [PubMed] [Google Scholar]
- Fahn S, Sulzer D. Neurodegeneration and neuroprotection in Parkinson disease. NeuroRx. 2004;1:139–154. doi: 10.1602/neurorx.1.1.139. [DOI] [PMC free article] [PubMed] [Google Scholar]
- Fontanilla CV, Ma Z, Wei X, Klotsche J, Zhao L, Wisniowski P, et al. Caffeic acid phenethyl ester prevents 1-methyl-4-phenyl-1,2,3,6-tetrahydropyridine-induced neurodegeneration. Neuroscience. 2011;188:135–141. doi: 10.1016/j.neuroscience.2011.04.009. [DOI] [PubMed] [Google Scholar]
- Greer PL, Greenberg ME. From synapse to nucleus: calcium-dependent gene transcription in the control of synapse development and function. Neuron. 2008;59:846–860. doi: 10.1016/j.neuron.2008.09.002. [DOI] [PubMed] [Google Scholar]
- Herrera AJ, Castaño A, Venero JL, Cano J, Machado A. The single intranigral injection of LPS as a new model for studying the selective effects of inflammatory reactions on dopaminergic system. Neurobiol Dis. 2000;7:429–447. doi: 10.1006/nbdi.2000.0289. [DOI] [PubMed] [Google Scholar]
- Hirsch EC, Hunot S, Damier P, Faucheux B. Glial cells and inflammation in Parkinson's disease: a role in neurodegeneration? Ann Neurol. 1998;44:S115–S120. doi: 10.1002/ana.410440717. [DOI] [PubMed] [Google Scholar]
- Hu Y, Russek SJ. BDNF and the diseased nervous system: a delicate balance between adaptive and pathological processes of gene regulation. J Neurochem. 2008;105:1–17. doi: 10.1111/j.1471-4159.2008.05237.x. [DOI] [PubMed] [Google Scholar]
- Huang E, Ong WY, Go ML, Garey LJ. Heme oxygenase-1 activity after excitotoxic injury: immunohistochemical localization of bilirubin in neurons and astrocytes and deleterious effects of heme oxygenase inhibition on neuronal survival after kainate treatment. J Neurosci Res. 2005;80:268–278. doi: 10.1002/jnr.20444. [DOI] [PubMed] [Google Scholar]
- Hung SY, Liou HC, Kang KH, Wu RM, Wen CC, Fu WM. Overexpression of heme oxygenase-1 protects dopaminergic neurons against 1-methyl-4-phenylpyridinium-induced neurotoxicity. Mol Pharmacol. 2008;74:1564–1575. doi: 10.1124/mol.108.048611. [DOI] [PubMed] [Google Scholar]
- Hung SY, Liou HC, Fu WM. The mechanism of heme oxygenase-1 action involved in the enhancement of neurotrophic factor expression. Neuropharmacology. 2010;58:321–329. doi: 10.1016/j.neuropharm.2009.11.003. [DOI] [PubMed] [Google Scholar]
- Inden M, Kitamura Y, Kondo J, Hayashi K, Yanagida T, Takata K, et al. Serofendic acid prevents 6-hydroxydopamine-induced nigral neurodegeneration and drug-induced rotational asymmetry in hemi-parkinsonian rats. J Neurochem. 2005;95:950–961. doi: 10.1111/j.1471-4159.2005.03413.x. [DOI] [PubMed] [Google Scholar]
- Itoh K, Wakabayashi N, Katoh Y, Ishii T, Igarashi K, Engel JD, et al. Keap1 represses nuclear activation of antioxidant responsive elements by Nrf2 through binding to the amino-terminal Neh2 domain. Genes Dev. 1999;13:76–86. doi: 10.1101/gad.13.1.76. [DOI] [PMC free article] [PubMed] [Google Scholar]
- Jeong GS, Lee DS, Li B, Byun E, Kwon DY, Park H, et al. Protective effect of sauchinone by upregulating heme oxygenase-1 via the P38 MAPK and Nrf2/ARE pathways in HepG2 cells. Planta Med. 2010;76:41–47. doi: 10.1055/s-0029-1185906. [DOI] [PubMed] [Google Scholar]
- Katoh-Semba R, Kaneko R, Kitajima S, Tsuzuki M, Ichisaka S, Hata Y, et al. Activation of p38 mitogen-activated protein kinase is required for in vivo brain-derived neurotrophic factor production in the rat hippocampus. Neuroscience. 2009;163:352–361. doi: 10.1016/j.neuroscience.2009.06.011. [DOI] [PubMed] [Google Scholar]
- Katsuki H, Kurimoto E, Takemori S, Kurauchi Y, Hisatsune A, Isohama Y, et al. Retinoic acid receptor stimulation protects midbrain dopaminergic neurons from inflammatory degeneration via BDNF-mediated signaling. J Neurochem. 2009;110:707–718. doi: 10.1111/j.1471-4159.2009.06171.x. [DOI] [PubMed] [Google Scholar]
- Khan M, Elango C, Ansari MA, Singh I, Singh AK. Caffeic acid phenethyl ester reduces neurovascular inflammation and protects rat brain following transient focal cerebral ischemia. J Neurochem. 2007;102:365–377. doi: 10.1111/j.1471-4159.2007.04526.x. [DOI] [PubMed] [Google Scholar]
- Kurauchi Y, Hisatsune A, Isohama Y, Katsuki H. Nitric oxide-cyclic GMP signaling pathway limits inflammatory degeneration of midbrain dopaminergic neurons: cell type-specific regulation of heme oxygenase-1 expression. Neuroscience. 2009;158:856–866. doi: 10.1016/j.neuroscience.2008.10.019. [DOI] [PubMed] [Google Scholar]
- Kurauchi Y, Hisatsune A, Isohama Y, Sawa T, Akaike T, Shudo K, et al. Midbrain dopaminergic neurons utilize nitric oxide/cyclic GMP signaling to recruit ERK that links retinoic acid receptor stimulation to up-regulation of BDNF. J Neurochem. 2011;116:323–333. doi: 10.1111/j.1471-4159.2010.06916.x. [DOI] [PubMed] [Google Scholar]
- Lee Y, Shin DH, Kim JH, Hong S, Choi D, Kim YJ, et al. Caffeic acid phenethyl ester-mediated Nrf2 activation and IκB kinase inhibition are involved in NFκB inhibitory effect: structural analysis for NFκB inhibition. Eur J Pharmacol. 2010;643:21–28. doi: 10.1016/j.ejphar.2010.06.016. [DOI] [PubMed] [Google Scholar]
- Lu SC. Regulation of glutathione synthesis. Mol Aspects Med. 2009;30:42–59. doi: 10.1016/j.mam.2008.05.005. [DOI] [PMC free article] [PubMed] [Google Scholar]
- McGeer PL, Itagaki S, Boyes BE, McGeer EG. Reactive microglia are positive for HLA-DR in the substantia nigra of Parkinson's and Alzheimer's disease brains. Neurology. 1988;38:1285–1291. doi: 10.1212/wnl.38.8.1285. [DOI] [PubMed] [Google Scholar]
- McGeer PL, Schwab C, Parent A, Doudet D. Presence of reactive microglia in monkey substantia nigra years after 1-methyl-4-phenyl-1,2,3,6-tetrahydropyridine administration. Ann Neurol. 2003;54:599–604. doi: 10.1002/ana.10728. [DOI] [PubMed] [Google Scholar]
- Mellstrom B, Torres B, Link WA, Naranjo JR. The BDNF gene: exemplifying complexity in Ca2+ -dependent gene expression. Crit Rev Neurobiol. 2004;16:43–49. doi: 10.1615/critrevneurobiol.v16.i12.40. [DOI] [PubMed] [Google Scholar]
- Miller RL, James-Kracke M, Sun GY, Sun AY. Oxidative and inflammatory pathways in Parkinson's disease. Neurochem Res. 2009;34:55–65. doi: 10.1007/s11064-008-9656-2. [DOI] [PubMed] [Google Scholar]
- Min KJ, Yang MS, Kim SU, Jou I, Joe EH. Astrocytes induce hemeoxygenase-1 expression in microglia: a feasible mechanism for preventing excessive brain inflammation. J Neurosci. 2006;26:1880–1887. doi: 10.1523/JNEUROSCI.3696-05.2006. [DOI] [PMC free article] [PubMed] [Google Scholar]
- Montpied P, de Bock F, Rondouin G, Niel G, Briant L, Courseau AS, et al. Caffeic acid phenethyl ester (CAPE) prevents inflammatory stress in organotypic hippocampal slice cultures. Mol Brain Res. 2003;115:111–120. doi: 10.1016/s0169-328x(03)00178-5. [DOI] [PubMed] [Google Scholar]
- Nakajima K, Kikuchi Y, Ikoma E, Honda S, Ishikawa M, Liu Y, et al. Neurotrophins regulate the function of cultured microglia. Glia. 1998;24:272–289. doi: 10.1002/(sici)1098-1136(199811)24:3<272::aid-glia2>3.0.co;2-4. [DOI] [PubMed] [Google Scholar]
- Natarajan K, Singh S, Burke TR, Grunberger D, Aggarwal BB. Caffeic acid phenethyl ester is a potent and specific inhibitor of activation of nuclear transcription factor NF-κB. Proc Natl Acad Sci USA. 1996;93:9090–9095. doi: 10.1073/pnas.93.17.9090. [DOI] [PMC free article] [PubMed] [Google Scholar]
- Noelker C, Bacher M, Gocke P, Wei X, Klockgether T, Du Y, et al. The flavanoide caffeic acid phenethyl ester blocks 6-hydroxydopamine-induced neurotoxicity. Neurosci Lett. 2005;383:39–43. doi: 10.1016/j.neulet.2005.04.023. [DOI] [PubMed] [Google Scholar]
- Orr CF, Rowe DB, Halliday GM. An inflammatory review of Parkinson's disease. Prog Neurobiol. 2002;68:325–340. doi: 10.1016/s0301-0082(02)00127-2. [DOI] [PubMed] [Google Scholar]
- Ryter SW, Alam J, Choi AM. Heme oxygenase-1/carbon monoxide: from basic science to therapeutic applications. Physiol Rev. 2006;86:583–650. doi: 10.1152/physrev.00011.2005. [DOI] [PubMed] [Google Scholar]
- Scapagnini G, Foresti R, Calabrese V, Giuffrida Stella AM, Green CJ, Motterlini R. Caffeic acid phenethyl ester and curcumin: a novel class of heme oxygenase-1 inducers. Mol Pharmacol. 2002;61:554–561. doi: 10.1124/mol.61.3.554. [DOI] [PubMed] [Google Scholar]
- Scott JR, Chin BY, Bilban MH, Otterbein LE. Restoring HOmeostasis: is heme oxygenase-1 ready for the clinic? Trends Pharmacol Sci. 2007;28:200–205. doi: 10.1016/j.tips.2007.03.006. [DOI] [PubMed] [Google Scholar]
- Shibata H, Katsuki H, Nishiwaki M, Kume T, Kaneko S, Akaike A. Lipopolysaccharide-induced dopaminergic cell death in rat midbrain slice cultures: role of inducible nitric oxide synthase and protection by indomethacin. J Neurochem. 2003;86:1201–1212. doi: 10.1046/j.1471-4159.2003.01929.x. [DOI] [PubMed] [Google Scholar]
- Son S, Lewis BA. Free radical scavenging and antioxidative activity of caffeic acid amide and ester analogues: structure-activity relationship. J Agric Food Chem. 2002;50:468–472. doi: 10.1021/jf010830b. [DOI] [PubMed] [Google Scholar]
- Spina MB, Squinto SP, Miller J, Lindsay RM, Hyman C. Brain-derived neurotrophic factor protects dopamine neurons against 6-hydroxydopamine and N-methyl-4-phenylpyridinium ion toxicity: involvement of the glutathione system. J Neurochem. 1992;59:99–106. doi: 10.1111/j.1471-4159.1992.tb08880.x. [DOI] [PubMed] [Google Scholar]
- Thomas B, Beal MF. Parkinson's disease. Hum Mol Genet. 2007;16:R183–R194. doi: 10.1093/hmg/ddm159. [DOI] [PubMed] [Google Scholar]
- Trang T, Beggs S, Wan X, Salter MW. P2X4-receptor-mediated synthesis and release of brain-derived neurotrophic factor in microglia is dependent on calcium and p38-mitogen-activated protein kinase activation. J Neurosci. 2009;29:3518–3528. doi: 10.1523/JNEUROSCI.5714-08.2009. [DOI] [PMC free article] [PubMed] [Google Scholar]
- Wang R, Li YB, Li YH, Xu Y, Wu HL, Li XJ. Curcumin protects against glutamate excitotoxicity in rat cerebral cortical neurons by increasing brain-derived neurotrophic factor level and activating TrkB. Brain Res. 2008a;1210:84–91. doi: 10.1016/j.brainres.2008.01.104. [DOI] [PubMed] [Google Scholar]
- Wang X, Stavchansky S, Zhao B, Bynum JA, Kerwin SM, Bowman PD. Cytoprotection of human endothelial cells from menadione cytotoxicity by caffeic acid phenethyl ester: the role of heme oxygenase-1. Eur J Pharmacol. 2008b;591:28–35. doi: 10.1016/j.ejphar.2008.06.017. [DOI] [PubMed] [Google Scholar]
- Wang R, Li YH, Xu Y, Li YB, Wu HL, Guo H, et al. Curcumin produces neuroprotective effects via activating brain-derived neurotrophic factor/TrkB-dependent MAPK and PI-3K cascades in rodent cortical neurons. Prog Neuropsychopharmacol Biol Psychiatry. 2010a;34:147–153. doi: 10.1016/j.pnpbp.2009.10.016. [DOI] [PubMed] [Google Scholar]
- Wang X, Stavchansky S, Kerwin SM, Bowman PD. Structure-activity relationships in the cytoprotective effect of caffeic acid phenethyl ester (CAPE) and fluorinated derivatives: effects on heme oxygenase-1 induction and antioxidant activities. Eur J Pharmacol. 2010b;635:16–22. doi: 10.1016/j.ejphar.2010.02.034. [DOI] [PubMed] [Google Scholar]
- Wei X, Zhao L, Ma Z, Holtzman DM, Yan C, Dodel RC, et al. Caffeic acid phenethyl ester prevents neonatal hypoxic-ischaemic brain injury. Brain. 2004;127:2629–2635. doi: 10.1093/brain/awh316. [DOI] [PubMed] [Google Scholar]
- Yamamoto N, Izumi Y, Matsuo T, Wakita S, Kume T, Takada-Takatori Y, et al. Elevation of heme oxygenase-1 by proteasome inhibition affords dopaminergic neuroprotection. J Neurosci Res. 2010;88:1934–1942. doi: 10.1002/jnr.22363. [DOI] [PubMed] [Google Scholar]
- Zanotto-Filho A, Braganhol E, Schröder R, de Souza LH, Dalmolin RJ, Pasquali MA, et al. NFκB inhibitors induce cell death in glioblastomas. Biochem Pharmacol. 2010a;81:412–424. doi: 10.1016/j.bcp.2010.10.014. [DOI] [PubMed] [Google Scholar]
- Zanotto-Filho A, Delgado-Cañedo A, Schröder R, Becker M, Klamt F, Moreira JC. The pharmacological NFκB inhibitors BAY117082 and MG132 induce cell arrest and apoptosis in leukemia cells through ROS-mitochondria pathway activation. Cancer Lett. 2010b;288:192–203. doi: 10.1016/j.canlet.2009.06.038. [DOI] [PubMed] [Google Scholar]
Associated Data
This section collects any data citations, data availability statements, or supplementary materials included in this article.