

Abstract
BACKGROUNDS AND PURPOSE
Lactic acidosis is a fatal adverse effect of metformin, but the risk factor remains unclear. Multidrug and toxin extrusion 1 (MATE1) is expressed in the luminal membrane of the kidney and liver. MATE1 was revealed to be responsible for the tubular and biliary secretion of metformin. Therefore, some MATE polymorphisms, that cause it to function abnormally, are hypothesized to induce lactic acidosis. The purpose of this study is to clarify the association between MATE dysfunction and metformin-induced lactic acidosis.
EXPERIMENTAL APPROACH
Blood lactate, pH and bicarbonate ion (HCO3-) levels were evaluated during continuous administration of 3 mg·mL−1 metformin in drinking water using Mate1 knockout (−/−), heterozygous (+/−) and wild-type (+/+) mice. To determine the tissue accumulation of metformin, mice were given 400 mg·kg−1 metformin orally. Furthermore, blood lactate data were obtained from diabetic patients given metformin.
KEY RESULTS
Seven days after metformin administration in drinking water, significantly higher blood lactate, lower pH and HCO3- levels were observed in Mate1−/− mice, but not in Mate1+/− mice. The blood lactate levels were not affected in patients with the heterozygous MATE variant (MATE1-L125F, MATE1-G64D, MATE2-K-G211V). Sixty minutes after metformin administration (400 mg·kg−1, p.o.) the hepatic concentration of metformin was markedly higher in Mate1−/− mice than in Mate1+/+ mice.
CONCLUSION AND IMPLICATIONS
MATE1 dysfunction caused a marked elevation in the metformin concentration in the liver and led to lactic acidosis, suggesting that the homozygous MATE1 variant could be one of the risk factors for metformin-induced lactic acidosis.
Keywords: H+/organic cation antiporter, genetic variant, toxicodynamics, kidney, liver
Introduction
Metformin (N,N-dimethylbiguanide) is widely used in the treatment of type II diabetes mellitus. It exhibits pharmacological effects in the liver and is almost entirely excreted in urine in an unchanged form (Scheen, 1996). Lactic acidosis is a fatal adverse effect of biguanide agents including metformin (Bailey and Turner, 1996). It was reported that metformin-induced lactic acidosis was associated with an elevation in plasma concentrations of metformin in patients with renal failure (Pearlman et al., 1996; Safadi et al., 1996). However, it is noteworthy that metformin-induced lactic acidosis also occurs in patients without any risk factors (Tymms and Leatherdale, 1988; al-Jebawi et al., 1998; Misbin et al., 1998). These reports suggest that some risk factors in addition to renal impairment are associated with metformin-induced lactic acidosis.
Multidrug and toxin extrusion 1 (MATE1/SLC47A1) is expressed in the luminal membranes of renal proximal tubules and bile canalicular membranes of hepatocytes and is responsible for the efflux of cationic compounds, including metformin, from the cells (Otsuka et al., 2005; Yonezawa and Inui, 2011). In the basolateral membranes of liver and kidney, organic cation transporters, OCT1 (SLC22A1) and OCT2 (SLC22A2), mediate metformin uptake from blood into cells respectively (Wang et al., 2003; Kimura et al., 2005). The renal clearance of metformin is five times higher than the glomerular filtration rate (Scheen, 1996), suggesting that the vectorial secretion via basolateral OCT2 and luminal MATE is important for the urinary excretion of metformin. Previously, we have demonstrated that the pharmacokinetics of metformin was significantly changed in Mate1 knockout (Mate1−/−) mice (Tsuda et al., 2009). It was shown that the total body clearance and renal clearance was decreased to 25% and 18% in comparison with the wild-type (Mate1+/+) mice, respectively. Therefore, it is thought that MATE1 determines the pharmacokinetics of metformin.
Transporter function is associated with inter-individual variations in drug responses. A MATE1 rs2289669G>A variant located in the intron region was reported to be related to a glucose-lowering effect after metformin treatment in patients with diabetes, although little is known about the influence of the molecular mechanism of this variant on the MATE1 transporter (Becker et al., 2009). In addition, it was reported that metformin elevates the blood lactate level in the presence of the MATE1 inhibitor pyrimethamine in mice, but under the conditions where the plasma concentration of metformin is much higher than those found in clinical situations (Ito et al., 2010). These reports suggested that MATE1 function influenced the pharmacodynamics of metformin under these limited conditions. Previously, we and other groups have identified non-synonymous MATE variants with reduced or negligible transport activity (Chen et al., 2009; Kajiwara et al., 2009; Meyer zu Schwabedissen et al., 2010). Taken together, these data indicate that functional impairment of MATE1 such as occurs with the genetic polymorphisms is involved in the lactic acidosis caused by metformin.
Here, we examined whether dysfunctional MATE1 caused metformin-induced lactic acidosis by using Mate1 knockout mice as models of MATE variant carriers. In addition, we also investigated the effect of heterozygous MATE variants on blood lactate levels after metformin treatment both in mice and in humans. Our results indicated that MATE dysfunction is one of the risk factors for metformin-induced lactic acidosis.
Methods
Animals
Animals used in the present study were male C57BL/6 Mate1+/+, Mate1+/− and Mate1−/− mice between 10 and 17 weeks of age. The methods used to generate the Mate1 knockout mice were described previously (Tsuda et al., 2009). In the present study, 6–12 mice were used in each experiment. Mice were kept in a temperature-controlled environment with a 14 h light and 10 h dark cycle, and received a standard diet and water ad libitum. All animal care and experimental procedures were conducted in accordance with The Guidelines for Animal Experiments of Kyoto University. All protocols were approved by the Animal Research Committee, Graduate School of Medicine, Kyoto University.
Long-term oral administration of metformin in mice
Mice (Mate1+/+, n= 9; Mate1+/−, n= 9; Mate1−/−, n= 11) were given 3 mg·mL−1 metformin in drinking water for 21 days. One to four mice were kept in the same cage. The total volume of drinking water in each cage was measured at days 7, 14 and 21 to calculate the mean daily dosage of metformin. For blood collection, the mice were deprived of food (fasted) for 4 h before being anaesthetized with sodium pentobarbital (50 mg·kg−1 i.p.). Blood samples were collected from the tail vein, under 40 min of anaesthesia, before and at 7, 14 and 21 days after the administration of metformin. Blood lactate, pH and bicarbonate ion (HCO3-) levels were measured by an i-STAT analyser with a CG4+ cartridge (Fuso Pharmaceutical Industries, Osaka, Japan). Body weight was also measured at the same time. At the end of this experiment, blood samples were collected from the abdominal aorta, and aspartate aminotransferase (AST), alanine aminotranferease (ALT), blood urea nitrogen (BUN) and plasma creatinine levels were determined.
Single oral administration of metformin in mice
Mice were given 5 mL·kg−1 water (Mate1+/+, n= 6; Mate1−/−, n= 7) or 400 mg·kg−1 metformin (Mate1+/+, n= 7; Mate1−/−, n= 12) via oral gavage under 40 min of anaesthesia. To determine the baseline lactate level, blood samples were obtained by tail bleeding before the oral administration of metformin. At 24 h after oral administration, blood lactate levels and plasma concentrations of metformin were determined using blood samples obtained from the tail vein. Blood lactate levels were measured by Lactate Pro LT-1710 (Arkray Inc., Kyoto, Japan). At the end of this experiment, blood samples were collected from the abdominal aorta, and biochemical parameters were evaluated by i-STAT analyser with CG4+ and CHEM8+ cartridges (Fuso). Thereafter, mice were killed, and samples of the kidney, liver and skeletal muscle were obtained.
Metformin and lactate concentration–time profile in Mate1 knockout mice
Mate1−/− mice (n= 8) were deprived of food for 12 h before the administration of 150 mg·kg−1 metformin via oral gavage. Blood samples were obtained from the tail vein as before and at 0.5, 1, 2, 4 and 8 h after the oral administration metformin to measure blood lactate levels and plasma concentrations of metformin. Blood lactate levels were measured by Lactate Pro (Arkray).
Clinical study
Blood lactate and MATE genotype data were collected from patients, as described previously by Toyama et al. (2010). Of the 48 patients, lactate data were obtained from 29 patients receiving 250 mg of metformin in the morning. All were inpatients at the Department of Diabetes and Clinical Nutrition, Kyoto University Hospital. Patients were given metformin hydrochloride tablets (Melbin®, Dainippon Sumitomo Pharma Co. Ltd., Osaka, Japan) continuously for the treatment of diabetes mellitus. Blood lactate levels were measured at 0, 4 and 9 h after the administration of metformin using Lactate Pro (Arkray). This study was conducted in accordance with the Declaration of Helsinki and its amendments and was approved by Kyoto University Graduate School and the Faculty of Medicine, Ethics Committee.
Uptake experiments
The detail of the methods used for the metformin uptake experiments were as described previously (Tanihara et al., 2007). Briefly, HEK293 cells (American Type Culture Collection CRL-1573, Manassas, VA, USA) were transfected with mouse Mate1, mouse Oct1, and mouse Oct2 cDNAs using Lipofectamine 2000 Reagent (Invitrogen, Carlsbad, CA, USA). The cells were incubated at 37°C for 1 or 2 min with incubation medium (pH = 7.4) containing [14C]-metformin in the presence or absence of 5 mM 1-methyl-4-phenylpyridinium (MPP). Unlabelled metformin was added to [14C]-metformin to obtain the final concentrations. The concentration-dependence of metformin transport by mouse Mate1, mouse Oct1 and mouse Oct2 was analysed by use of the Michaelis–Menten equation: V=Vmax[S] / (Km+[S]) +Kd·[S], where V is the transport rate, Vmax is the maximal transport rate, [S] is the concentration of metformin, Km is the Michaelis–Menten constant and Kd is a diffusion constant.
Analytical methods
Metformin concentrations in plasma, liver, kidney and skeletal muscle were determined by HPLC, as described previously (Kimura et al., 2005). The methods used for sample pretreatment were as described in detail previously (Tsuda et al., 2009). AST and ALT were measured by Transaminase C II-Test Wako (Wako Pure Chemical Industries Ltd., Osaka, Japan) according to the manufacturer's directions. Creatinine and BUN were measured by the LabAssay creatinine and UN B-test Wako (Wako Pure Chemical Industries Ltd.), respectively.
Materials
Metformin hydrochloride was obtained from Wako Pure Chemical Industries Ltd. [14C]-metformin hydrochloride (54 mCi·mmol−1) was purchased from Moravek Biochemicals, Inc. (Brea, CA, USA). MPP iodide was purchased from Sigma Aldrich (St. Louis, MO, USA). All other compounds used were of the highest purity available.
Statistical analysis
Data are expressed as the mean ± SEM. Data were analysed statistically using Student's unpaired t-test or one-way ANOVA with Dunnett's multiple comparison test. The data were analysed using GraphPad Prism 4.0 (GraphPad Software Inc., San Diego, CA, USA).
Results
Continuous oral administration of metformin in mice
Metformin-induced lactic acidosis was evaluated using Mate1+/+, Mate1+/− and Mate1−/− mice. It was confirmed that the volume of drinking water without metformin was not different amongst the three genotypes. In the presence of metformin, the volume of drinking water was decreased in Mate1−/− mice, resulting in a reduction in the mean daily dose of metformin in Mate1−/− mice (7.0 mg·day−1) compared with Mate1+/+ (12.0 mg·day−1) and Mate1+/− mice (11.4 mg·day−1) (Figure 1A). Plasma concentrations of metformin were within the range for clinical use (Mate1+/+, 1.4 ± 0.2; Mate1+/−, 2.1 ± 0.3; Mate1−/−, 4.2 ± 0.3 µg·mL−1). There was no significant difference in body weight change amongst the three genotypes (Figure 1B). At 7, 14 and 21 days after metformin treatment, a higher blood lactate level was observed in Mate1−/− mice compared with those in Mate1+/+ mice (Figure 1C). pH and HCO3- levels were significantly lower in Mate1−/− mice (Figure 1D and E). At day 21, there were no significant differences in AST, ALT and BUN between Mate1+/+ and Mate1−/− mice (Table 1). In Mate1+/− mice, all parameters were comparable to those in Mate1+/+ mice (Figure 1C–E).
Figure 1.
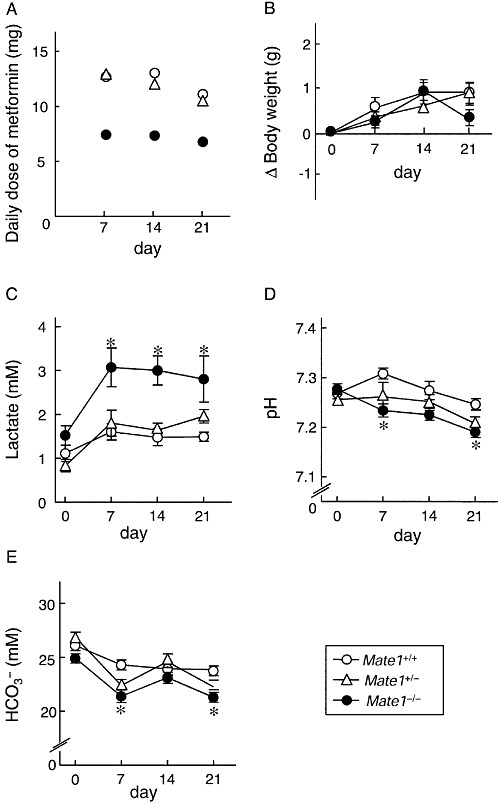
Long-term toxicity of metformin in Mate1+/+, Mate1+/− and Mate1−/− mice. Mate1+/+ (n= 9), Mate1+/− (n= 9) and Mate1−/− (n= 11) mice were given 3 mg·mL−1 metformin in drinking water for 21 days. The mean daily dose of each 7 days (A), body weight change from baseline (B), blood lactate level (C), pH (D) and HCO3- levels (E) were determined at 0, 7, 14 and 21 days after metformin treatment. Blood samples were collected under anaesthesia in 4 h-fasted mice. Blood lactate, pH and HCO3- levels were measured by i-STAT. Each point represents the mean ± SEM. *P < 0.05, significantly different from Mate1+/+ mice at each day.
Table 1.
Biochemical parameters in Mate1+/+, Mate1+/− and Mate1−/− mice 21 days after metformin treatment
| Mate1+/+ | Mate1+/− | Mate1−/− | |
|---|---|---|---|
| Hepatic function | |||
| AST (IU·L−1) | 24 ± 3 | 21 ± 2 | 21 ± 2 |
| ALT (IU·L−1) | 33 ± 4 | 23 ± 1 | 20 ± 1 |
| Renal function | |||
| Creatinine (mg·mL−1) | 0.0035 ± 0.0001 | 0.0038 ± 0.0001 | 0.0044 ± 0.0001* |
| BUN (mg·mL−1) | 0.22 ± 0.02 | 0.23 ± 0.02 | 0.22 ± 0.01 |
| Acid-base balance | |||
| Lactate (mM) | 1.5 ± 0.1 | 2.0 ± 0.2 | 2.8 ± 0.6* |
| pH | 7.24 ± 0.01 | 7.21 ± 0.02 | 7.19 ± 0.01* |
| HCO3- (mM) | 24 ± 1 | 22 ± 1 | 21 ± 0* |
Mate1+/+ (n= 9), Mate1+/− (n= 9) and Mate1−/− mice (n= 11) were used.
P < 0.05, significantly different from Mate1+/+ mice.
Blood lactate levels in diabetic patients
Because of the limited number of patients examined (n= 48), no homozygous MATE variant carrier was found in this clinical study. Heterozygous MATE variants have little influence on the metformin plasma concentration and oral clearance as described previously (Toyama et al., 2010). In the present study, the effect of metformin on blood lactate levels was examined in 29 patients receiving 250 mg of metformin. Four heterozygous MATE-variant carriers were found; one patient carried MATE1-L125F variant, two carried MATE1-G64D variant and one carried MATE2-K-G211V variant. As expected, there was no significant difference in blood lactate levels between the two groups (Figure 2).
Figure 2.
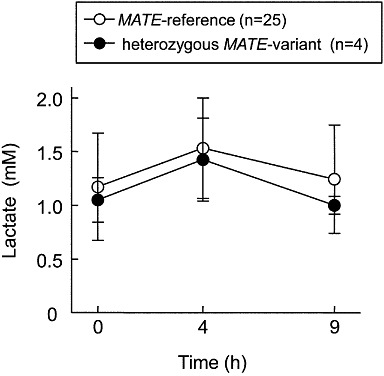
Lactate concentration–time profile in diabetic patients. Metformin was administered to patients in the MATE-reference group (n= 25) and heterozygous MATE-variant group (n= 4). Blood lactate levels were measured by Lactate Pro at 0, 4 and 9 h after the oral administration of metformin. One MATE1-L125F variant carrier, two MATE1-G64D variant carriers and one MATE2-K-G211V variant carriers were found in this study. Each point represents the mean ± SD.
Single oral administration of metformin in mice
Based on the present data, no functional difference in the MATE1 heterozygous genotype in comparison with the wild-type was observed in vivo, and therefore, we focused on the difference between the Mate1+/+ and Mate1−/− mice. In the long-term administration experiment, the pharmacokinetics of metformin in Mate1+/+ and Mate1−/− mice could not be rigorously evaluated because of the different dosages between the two groups. Therefore, the blood lactate levels and the pharmacokinetics of metformin were investigated in Mate1+/+ and Mate1−/− mice after a single oral dose. In the vehicle-treated mice, there was no significant difference between these parameters in Mate1+/+ and Mate1−/− mice. In metformin-treated mice, two Mate1−/− mice died and blood lactate levels were significantly high in Mate1−/− mice compared with Mate1+/+ mice (Figure 3). Several other biochemical parameters were also evaluated (Table 2). The pH and HCO3- levels were lower in metformin-treated Mate1−/− mice than in metformin-treated Mate1+/+ mice. In addition, the base excess of extracellular fluid as an indicator of metabolic acidosis was also significantly decreased in metformin-treated Mate1−/− mice compared with metformin-treated Mate1+/+ mice.
Figure 3.
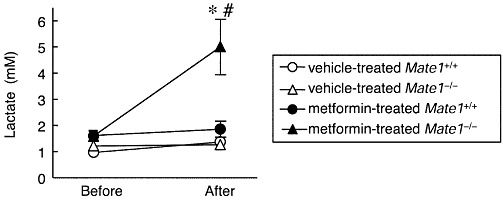
Blood lactate level in vehicle- or metformin-treated Mate1+/+ and Mate1−/− mice after a single dose of metformin. All mice were given 400 mg·kg−1 metformin via oral gavage. Blood lactate levels were determined before and 24 h after the oral administration of metformin in vehicle-treated Mate1+/+ mice (n= 6), vehicle-treated Mate1−/− mice (n= 7), metformin-treated Mate1+/+ mice (n= 7) and metformin-treated Mate1−/− mice (n= 10). Each point represents the mean ± SEM. *P < 0.05, significantly different from vehicle-treated mice with the same genotype. #P < 0.05, significantly different from metformin-treated Mate1+/+ mice.
Table 2.
Biochemical parameters and body weight in vehicle- or metformin-treated Mate1+/+ and Mate1−/− mice.
| Vehicle | Metformin | |||
|---|---|---|---|---|
| Mate1+/+ | Mate1−/− | Mate1+/+ | Mate1−/− | |
| BW (g) | 30 ± 1 | 27 ± 1 | 29 ± 1 | 27 ± 0 |
| pH | 7.32 ± 0.02 | 7.28 ± 0.03 | 7.29 ± 0.02 | 7.03 ± 0.10**## |
| pCO2 (mmHg) | 50 ± 3 | 51 ± 4 | 48 ± 3 | 39 ± 3* |
| pO2 (mmHg) | 109 ± 17 | 114 ± 14 | 121 ± 4.1 | 127 ± 12 |
| BEecf (mM) | −1 ± 1 | −3 ± 1 | −4 ± 1 | −16 ± 2***### |
| HCO3- (mM) | 25 ± 1 | 24 ± 1 | 23 ± 1 | 12 ± 2***### |
| TCO2 (mM) | 27 ± 1 | 25 ± 1 | 24 ± 1 | 15 ± 2***### |
| sO2 (%) | 96 ± 2 | 97 ± 1 | 98 ± 0 | 95 ± 1 |
| Na (mM) | 148 ± 1 | 151 ± 1 | 148 ± 1 | 153 ± 1## |
| K (mM) | 5.5 ± 0.5 | 4.7 ± 0.2 | 4.9 ± 0.2 | 5.2 ± 0.2 |
| Cl (mM) | 116 ± 1 | 120 ± 1 | 117 ± 1 | 131 ± 0***### |
| iCa (mM) | 1.3 ± 0.0 | 1.3 ± 0.0 | 1.3 ± 0.0 | 1.3 ± 0.1 |
| Glu (mg·mL−1) | 2.03 ± 0.16 | 1.78 ± 0.13 | 1.76 ± 0.09 | 1.44 ± 0.10*# |
| Hct (%PCV) | 43 ± 2 | 42 ± 1 | 39 ± 1 | 42 ± 1 |
| Hb (g·mL−1) | 0.15 ± 0.01 | 0.14 ± 0.00 | 0.13 ± 0.00 | 0.14 ± 0.00 |
| AnGap (mM) | 15 ± 1 | 15 ± 0 | 15 ± 1 | 16 ± 1 |
| BUN (mg·mL−1) | 0.24 ± 0.04 | 0.24 ± 0.01 | 0.19 ± 0.05 | 0.45 ± 0.11 |
| Creatinine (mg·mL−1) | 0.0034 ± 0.0010 | 0.0036 ± 0.0002 | 0.0030 ± 0.0001 | 0.0054 ± 0.0008 |
Vehicle-treated mice (Mate1+/+, n= 6; Mate1−/−, n= 7), metformin-treated mice (Mate1+/+, n= 7; Mate1−/−, n= 10).
P < 0.05, **P < 0.01, ***P < 0.001, significantly different from vehicle-treated mice with the same genotype; #P < 0.05, ##P < 0.01, ###P < 0.001, significantly different from Mate1+/+ mice.
BW, body weight; pCO2, partial pressure of carbon dioxide; pO2, partial pressure of oxygen; BEecf, base excess of extracellular fluid; TCO2, total carbon dioxide; sO2, saturation oxygen; iCa, ionized calcium; Glu, glucose; Hct, haematocrit; Hb, haemoglobin; AnGap, anion gap.
Plasma concentrations of metformin were 15-fold higher in Mate1−/− mice than in Mate1+/+ mice (Figure 4A). Metformin concentrations in the kidney, liver and skeletal muscle were also 21-, 69- and 44-fold higher in Mate1−/− than those in Mate1+/+ mice, respectively (Figure 4B, D and F). In Mate1−/− mice, the apparent tissue-to-plasma concentration ratio (Kp) was higher in the liver and skeletal muscle, but not in the kidney (Figure 4C, E and G).
Figure 4.
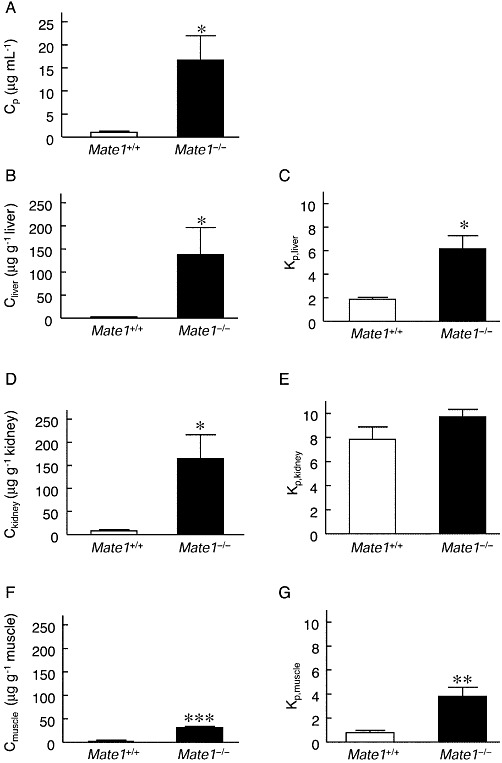
Pharmacokinetics of metformin in Mate1+/+ and Mate1−/− mice after a single dose of metformin. In the same mice as shown in Figure 3, metformin concentrations in plasma (A), liver (B), kidney (D) and skeletal muscle (F) were determined by HPLC. Kp values in the liver (C), kidney (E) and skeletal muscle (G) were calculated by dividing the tissue concentration by the plasma concentration of metformin. Data represent mean ± SEM. *P < 0.05, **P < 0.01, ***P < 0.001, significantly different from Mate1+/+ mice.
Metformin and lactate concentration–time profile in mice
To clarify the association between the PK/PD profile, we examined the metformin and lactate concentration–time profile in Mate1−/− mice. The blood lactate level increased later than the plasma concentration of metformin; the plasma concentration of metformin and blood lactate level peaked at 2 and 4 h, respectively, after the oral administration metformin in these mice (Figure 5).
Figure 5.
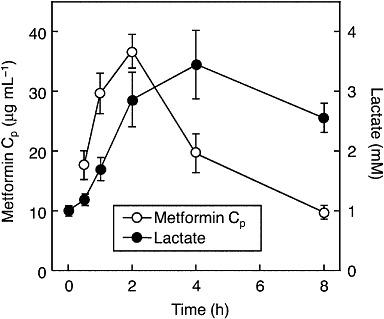
Lactate and metformin concentration–time profiles in Mate1−/− mice. Overnight-fasted mice were given 150 mg·kg−1 metformin (n= 8). Plasma concentration of metformin and blood lactate levels ere measured by HPLC and Lactate Pro respectively. Data represent mean ± SEM.
Concentration-dependence of [14C]-metformin uptake by mouse Mate1, mouse Oct1 and mouse Oct2
We examined the characteristics of metformin transport by mouse Mate1, mouse Oct1 and mouse Oct2. The uptake of [14C]-metformin by mouse Mate1, mouse Oct1 and mouse Oct2 was found to be concentration-dependent (Figure 6). The apparent Km values of metformin transport by mouse Mate1-, mouse Oct1- and mouse Oct2-expressing cells were 0.3 ± 0.0, 1.8 ± 0.1 and 2.9 ± 0.4 mM, respectively. The Vmax values were 5.3 ± 0.7 nmol·mg−1 protein·min−1, 11.5 ± 2.3 nmol·mg−1 protein·2 min−1 and 18.5 ± 2.0 nmol·mg−1 protein·2 min−1 respectively.
Figure 6.
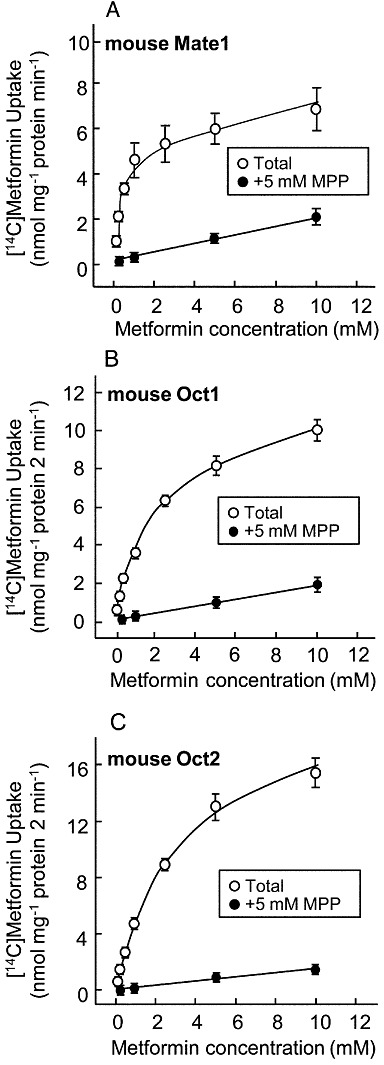
Concentration dependence of [14C]-metformin uptake by mouse Mate1-, mouse Oct1- or mouse Oct2-expressing cells. The cells were incubated with [14C]-metformin in the presence or absence of 5 mM MPP at 37°C for 1 min in mouse Mate1-expressing cells (A) and for 2 min in mouse Oct1- (B) or mouse Oct2-expressing cells (C). Data represent mean ± SEM.
Discussion
Genetic variants of drug transporters affect the pharmacokinetics of substrates and are involved in serious clinical outcomes. The organic anion transporting polypeptide 1B1 (OATP1B1/SLCO1B1) variant has been shown to increase plasma concentrations of simvastatin acid and is associated with statin-induced myopathy (Pasanen et al., 2006; Link et al., 2008). Our recent report suggested that the breast cancer resistant protein (BCRP/ABCG2) 421C>A variant causes the plasma concentration of sunitinib to increase and is associated with severe adverse effects to this drug such as skin reactions in the hands and feet (Mizuno et al., 2010). In the case of metformin, a recent report demonstrated that MATE is involved in the excretion of metformin in humans by using the MATE inhibitor pyrimethamine (Kusuhara et al., 2011). In addition, it was previously reported that the administration of metformin in the presence of pyrimethamine resulted in plasma concentrations of metformin 50 times higher than the therapeutic concentrations and also led to an increased blood lactate level (Ito et al., 2010). In the present study, we focused on the clinical risk of metformin-induced lactic acidosis and carried out two experiments to examine the influence of MATE dysfunction on metformin-induced lactic acidosis in mice. On the continuous administration of metformin in drinking water, the mean plasma concentration of metformin in Mate1+/+ mice was 1.4 µg·mL−1, which is consistent with the clinical plasma concentration (Scheen, 1996; Toyama et al., 2010). In Mate1−/− mice, the blood lactate level was significantly increased despite a lower dosage of metformin than in the Mate1+/+ mice (Figure 1). After the same dose of metformin, administered as a bolus p.o., in Mate1+/+ and Mate1−/− mice, severe lactic acidosis was observed in Mate1−/− mice, as shown by the levels of lactate, pH, HCO3- and several electrolytes, but not in the Mate1+/+ mice (Figure 3 and Table 2). In addition, two of the Mate1−/− mice died after this acute metformin treatment, and the plasma creatinine concentration was also elevated in these metformin-treated Mate1−/− mice (Tables 1 and 2). These phenomena were reported in the patients with metformin-induced lactic acidosis (Misbin et al., 1998; Tymms and Leatherdale, 1988; al-Jebawi et al., 1998; Stades et al., 2004). It was shown that the peak of blood lactate level followed the elevation of metformin concentration, and the high blood lactate level was maintained even though the metformin concentration was reduced immediately (Figure 5). These results suggest that metformin-induced lactic acidosis is caused by a completely dysfunctional MATE even when plasma concentration of metformin was within therapeutic range in MATE-reference carriers. Taken together, the data indicate that a dysfunctional MATE mutation could be a high risk factor for metformin-induced lactic acidosis.
In accord with our previous report on the pharmacokinetics of metformin, we found that in humans, the heterozygous MATE variant did not affect blood lactate levels (Figure 2) (Toyama et al., 2010). In addition, the same results were obtained in Mate1+/− mice (Figure 1). This suggests that metformin-induced lactic acidosis is not just caused by the heterozygous MATE variant. On the other hand, there is no information about the blood lactate level in human homozygous MATE variant carriers due to low allelic frequencies of MATE variants with a loss of function (Chen et al., 2009; Kajiwara et al., 2009; Meyer zu Schwabedissen et al., 2010). Metformin-induced lactic acidosis is also quite rare with 3 cases per 100 000 patient-years, but severe with a mortality up to 50% (Bailey and Turner, 1996; Misbin et al., 1998). If possible, the nucleotide sequences of MATE should be determined in patients suffering from lactic acidosis after receiving metformin treatment.
The liver is a major pharmacological target organ for the action of metformin. In a previous report it was shown that the blood lactate level was elevated in Oct1+/+ mice, but not in Oct1−/− mice, after metformin treatment (Wang et al., 2003). Also hepatic concentrations of metformin were significantly lower in Oct1−/− mice than in Oct1+/+ mice at similar plasma concentrations. Therefore, it was suggested that liver is the key organ responsible for metformin-induced lactic acidosis. In the present study we demonstrated that the hepatic concentration of metformin was 69-fold higher in Mate1−/− mice than in Mate1+/+ mice, in spite of a 15-fold increase in the plasma concentration (Figure 4A and B). In Mate1−/− mice, the renal clearance of metformin was 18% of that in Mate1+/+ mice, and the plasma concentration of metformin was higher (Tsuda et al., 2009). In addition, it was reported that the MATE1 inhibitor pyrimethamine causes a 53 % reduction in hepatic clearance of metformin with respect to the liver concentration of metformin (Ito et al., 2010). Taken together, these data indicate that a MATE1 dysfunction synergistically increased metformin accumulation in the liver due to the loss of urinary and biliary efflux of metformin, resulting in the development of lactic acidosis.
In addition to its effects in the liver, metformin, by activation of AMP-activated protein kinase (AMPK), also has a pharmacological effect in skeletal muscle (Zhou et al., 2001). The AMPK activator AICAR has been reported to increase significantly the rate of lactate release within skeletal muscle cells (Young et al., 1996). A recent report showed that metformin was transported into skeletal muscle cells by OCT3 (Chen et al., 2010). MATE1 is also expressed in skeletal muscle (Otsuka et al., 2005) and in the present study it was found that the Kp value for metformin was increased in muscle from Mate1−/− mice (Figure 4G). Therefore, it is likely that MATE1 is responsible for metformin efflux from the skeletal muscle as well as in the kidney and liver.
Species differences exist in the MATE family (Yonezawa and Inui, 2011). The tissue distribution of the MATE family is reported to differ between humans and mice. MATE1 and MATE2-K are expressed in human kidney, whereas MATE2-K is not expressed in mice (Masuda et al., 2006; Tsuda et al., 2009). Therefore, Mate1 knockout mice could represent a model of both MATE1 and MATE2-K deficiency in humans, because of similar affinities in mice and humans (Figure 6) (Tanihara et al., 2007). The renal clearance of metformin in Mate1+/− mice was comparable with that in Mate1+/+ mice despite the reduction of MATE1 expression (Toyama et al., 2010). Taken together with the similar transport characteristics of MATE1 and MATE2-K (Tanihara et al., 2007), it is assumed that the renal excretion of metformin was not affected in either homozygous MATE1 or homozygous MATE2-K variant carriers. In the pharmacological targets such as liver and skeletal muscle, MATE1 was found but not MATE2-K (Yonezawa and Inui, 2011). In Mate1−/− mice, the hepatic and skeletal muscular Kp values for metformin were higher than those in the wild-type mice (Figure 4C and G). Therefore, it is anticipated that only the homozygous MATE1 variant causes the elevation in metformin concentrations in the liver and skeletal muscle, even though renal excretion is not changed. In fact, in a previous case report, metformin-induced lactic acidosis was found to occur within the therapeutic concentration of metformin (Tymms and Leatherdale, 1988; al-Jebawi et al., 1998). MATE1 is expressed in several tissues that are associated with metformin action, but MATE2-K is expressed only in the kidney (Yonezawa and Inui, 2011). Therefore, only the homozygous MATE1 variant would affect the pharmacodynamics of metformin without a reduction in renal clearance.
In the present study, a dysfunction in MATE1 caused lactic acidosis after metformin treatment, accompanied by a reduction in the renal clearance of metformin and increase in hepatic accumulation. These findings indicate that MATE1 plays an important role in the pharmacodynamics of metformin. In conclusion, the homozygous MATE variant is one of the risk factors for metformin-induced lactic acidosis. These observations may provide new insights into the causes of metformin-induced lactic acidosis.
Acknowledgments
The authors are grateful to all the medical staff of the Department of Diabetes and Clinical Nutrition, Graduate School of Medicine, Kyoto University, especially to Dr Chizumi Yamada, Dr Kazuyo Fujita, Dr Akio Obara, Dr Norio Harada, Dr Kazutaka Nagai and Dr Shiho Takahara for excellent help. This study was supported by a grant-in-aid for Scientific Research (KAKENHI) from the Ministry of Education, Science, Culture, and Sports of Japan, and in part by the Nakatomi Foundation.
Glossary
- ALT
alanine aminotranferase
- AST
aspartate aminotransferase
- BUN
blood urea nitrogen
- MATE
multidrug and toxin extrusion
- MPP
1-methyl-4-phenylpyridinium
- OCT
organic cation transporter
Conflicts of interest
None.
References
- Bailey CJ, Turner RC. Metformin. N Engl J Med. 1996;334:574–579. doi: 10.1056/NEJM199602293340906. [DOI] [PubMed] [Google Scholar]
- Becker ML, Visser LE, van Schaik RH, Hofman A, Uitterlinden AG, Stricker BH. Genetic variation in the multidrug and toxin extrusion 1 transporter protein influences the glucose-lowering effect of metformin in patients with diabetes: a preliminary study. Diabetes. 2009;58:745–749. doi: 10.2337/db08-1028. [DOI] [PMC free article] [PubMed] [Google Scholar]
- Chen L, Pawlikowski B, Schlessinger A, More SS, Stryke D, Johns SJ, et al. Role of organic cation transporter 3 (SLC22A3) and its missense variants in the pharmacologic action of metformin. Pharmacogenet Genomics. 2010;20:687–699. doi: 10.1097/FPC.0b013e32833fe789. [DOI] [PMC free article] [PubMed] [Google Scholar]
- Chen Y, Teranishi K, Li S, Yee SW, Hesselson S, Stryke D, et al. Genetic variants in multidrug and toxic compound extrusion-1, hMATE1, alter transport function. Pharmacogenomics J. 2009;9:127–136. doi: 10.1038/tpj.2008.19. [DOI] [PMC free article] [PubMed] [Google Scholar]
- Ito S, Kusuhara H, Kuroiwa Y, Wu C, Moriyama Y, Inoue K, et al. Potent and specific inhibition of mMate1-mediated efflux of type I organic cations in the liver and kidney by pyrimethamine. J Pharmacol Exp Ther. 2010;333:341–350. doi: 10.1124/jpet.109.163642. [DOI] [PubMed] [Google Scholar]
- al-Jebawi AF, Lassman MN, Abourizk NN. Lactic acidosis with therapeutic metformin blood level in a low-risk diabetic patient. Diabetes Care. 1998;21:1364–1365. doi: 10.2337/diacare.21.8.1364. [DOI] [PubMed] [Google Scholar]
- Kajiwara M, Terada T, Ogasawara K, Iwano J, Katsura T, Fukatsu A, et al. Identification of multidrug and toxin extrusion (MATE1 and MATE2-K) variants with complete loss of transport activity. J Hum Genet. 2009;54:40–46. doi: 10.1038/jhg.2008.1. [DOI] [PubMed] [Google Scholar]
- Kimura N, Masuda S, Tanihara Y, Ueo H, Okuda M, Katsura T, et al. Metformin is a superior substrate for renal organic cation transporter OCT2 rather than hepatic OCT1. Drug Metab Pharmacokinet. 2005;20:379–386. doi: 10.2133/dmpk.20.379. [DOI] [PubMed] [Google Scholar]
- Kusuhara H, Ito S, Kumagai Y, Jiang M, Shiroshita T, Moriyama Y, et al. Effects of a MATE protein inhibitor, pyrimethamine, on the renal elimination of metformin at oral microdose and at therapeutic dose in healthy subjects. Clin Pharmacol Ther. 2011;89:837–844. doi: 10.1038/clpt.2011.36. [DOI] [PubMed] [Google Scholar]
- Link E, Parish S, Armitage J, Bowman L, Heath S, Matsuda F, et al. SLCO1B1 variants and statin-induced myopathy – a genomewide study. N Engl J Med. 2008;359:789–799. doi: 10.1056/NEJMoa0801936. [DOI] [PubMed] [Google Scholar]
- Masuda S, Terada T, Yonezawa A, Tanihara Y, Kishimoto K, Katsura T, et al. Identification and functional characterization of a new human kidney-specific H+/organic cation antiporter, kidney-specific multidrug and toxin extrusion 2. J Am Soc Nephrol. 2006;17:2127–2135. doi: 10.1681/ASN.2006030205. [DOI] [PubMed] [Google Scholar]
- Meyer zu Schwabedissen HE, Verstuyft C, Kroemer HK, Becquemont L, Kim RB. Human multidrug and toxin extrusion 1 (MATE1/SLC47A1) transporter: functional characterization, interaction with OCT2 (SLC22A2), and single nucleotide polymorphisms. Am J Physiol Renal Physiol. 2010;298:F997–F1005. doi: 10.1152/ajprenal.00431.2009. [DOI] [PubMed] [Google Scholar]
- Misbin RI, Green L, Stadel BV, Gueriguian JL, Gubbi A, Fleming GA. Lactic acidosis in patients with diabetes treated with metformin. N Engl J Med. 1998;338:265–266. doi: 10.1056/NEJM199801223380415. [DOI] [PubMed] [Google Scholar]
- Mizuno T, Terada T, Kamba T, Fukudo M, Katsura T, Nakamura E, et al. ABCG2 421C>A polymorphism and high exposure of sunitinib in a patient with renal cell carcinoma. Ann Oncol. 2010;21:1382–1383. doi: 10.1093/annonc/mdq150. [DOI] [PubMed] [Google Scholar]
- Otsuka M, Matsumoto T, Morimoto R, Arioka S, Omote H, Moriyama Y. A human transporter protein that mediates the final excretion step for toxic organic cations. Proc Natl Acad Sci U S A. 2005;102:17923–17928. doi: 10.1073/pnas.0506483102. [DOI] [PMC free article] [PubMed] [Google Scholar]
- Pasanen MK, Neuvonen M, Neuvonen PJ, Niemi M. SLCO1B1 polymorphism markedly affects the pharmacokinetics of simvastatin acid. Pharmacogenet Genomics. 2006;16:873–879. doi: 10.1097/01.fpc.0000230416.82349.90. [DOI] [PubMed] [Google Scholar]
- Pearlman BL, Fenves AZ, Emmett M. Metformin-associated lactic acidosis. Am J Med. 1996;101:109–110. doi: 10.1016/s0002-9343(97)89422-3. [DOI] [PubMed] [Google Scholar]
- Safadi R, Dranitzki-Elhalel M, Popovtzer M, Ben-Yehuda A. Metformin-induced lactic acidosis associated with acute renal failure. Am J Nephrol. 1996;16:520–522. doi: 10.1159/000169052. [DOI] [PubMed] [Google Scholar]
- Scheen AJ. Clinical pharmacokinetics of metformin. Clin Pharmacokinet. 1996;30:359–371. doi: 10.2165/00003088-199630050-00003. [DOI] [PubMed] [Google Scholar]
- Stades AM, Heikens JT, Erkelens DW, Holleman F, Hoekstra JB. Metformin and lactic acidosis: cause or coincidence? A review of case reports. J Intern Med. 2004;255:179–187. doi: 10.1046/j.1365-2796.2003.01271.x. [DOI] [PubMed] [Google Scholar]
- Tanihara Y, Masuda S, Sato T, Katsura T, Ogawa O, Inui K. Substrate specificity of MATE1 and MATE2-K, human multidrug and toxin extrusions/H+-organic cation antiporters. Biochem Pharmacol. 2007;74:359–371. doi: 10.1016/j.bcp.2007.04.010. [DOI] [PubMed] [Google Scholar]
- Toyama K, Yonezawa A, Tsuda M, Masuda S, Yano I, Terada T, et al. Heterozygous variants of multidrug and toxin extrusions (MATE1 and MATE2-K) have little influence on the disposition of metformin in diabetic patients. Pharmacogenet Genomics. 2010;20:135–138. doi: 10.1097/FPC.0b013e328335639f. [DOI] [PubMed] [Google Scholar]
- Tsuda M, Terada T, Mizuno T, Katsura T, Shimakura J, Inui K. Targeted disruption of the multidrug and toxin extrusion 1 (Mate1) gene in mice reduces renal secretion of metformin. Mol Pharmacol. 2009;75:1280–1286. doi: 10.1124/mol.109.056242. [DOI] [PubMed] [Google Scholar]
- Tymms DJ, Leatherdale BA. Lactic acidosis due to metformin therapy in a low risk patient. Postgrad Med J. 1988;64:230–231. doi: 10.1136/pgmj.64.749.230. [DOI] [PMC free article] [PubMed] [Google Scholar]
- Wang DS, Kusuhara H, Kato Y, Jonker JW, Schinkel AH, Sugiyama Y. Involvement of organic cation transporter 1 in the lactic acidosis caused by metformin. Mol Pharmacol. 2003;63:844–848. doi: 10.1124/mol.63.4.844. [DOI] [PubMed] [Google Scholar]
- Yonezawa A, Inui K. Importance of the multidrug and toxin extrusion MATE/SLC47A family to pharmacokinetics, pharmacodynamics/toxicodynamics and pharmacogenomics. Br J Pharmacol. 2011;164:1817–1825. doi: 10.1111/j.1476-5381.2011.01394.x. [DOI] [PMC free article] [PubMed] [Google Scholar]
- Young ME, Radda GK, Leighton B. Activation of glycogen phosphorylase and glycogenolysis in rat skeletal muscle by AICAR-an activator of AMP-activated protein kinase. FEBS Lett. 1996;382:43–47. doi: 10.1016/0014-5793(96)00129-9. [DOI] [PubMed] [Google Scholar]
- Zhou G, Myers R, Li Y, Chen Y, Shen X, Fenyk-Melody J, et al. Role of AMP-activated protein kinase in mechanism of metformin action. J Clin Invest. 2001;108:1167–1174. doi: 10.1172/JCI13505. [DOI] [PMC free article] [PubMed] [Google Scholar]