

Abstract
BACKGROUND AND PURPOSE
Recent studies indicate that efflux of antidepressants by the multidrug resistance transporter P-glycoprotein (P-gp) at the blood–brain barrier (BBB) may contribute to treatment-resistant depression (TRD) by limiting intracerebral antidepressant concentrations. In addition, clinical experience shows that adjunctive treatment with the P-gp inhibitor verapamil may improve the clinical outcome in TRD. Therefore, the present study aimed to investigate the effect of P-gp inhibition on the transport of the tricyclic antidepressant imipramine and its active metabolite desipramine across the BBB.
EXPERIMENTAL APPROACH
Intracerebral microdialysis in rats was used to monitor brain levels of imipramine and desipramine following i.v. imipramine administration, with or without pretreatment with one of the P-gp inhibitors verapamil or cyclosporin A (CsA). Plasma drug levels were also determined at regular intervals.
KEY RESULTS
Pretreatment with either verapamil or CsA resulted in significant increases in imipramine concentrations in the microdialysis samples, without altering imipramine plasma pharmacokinetics. Furthermore, pretreatment with verapamil, but not CsA, led to a significant elevation in plasma and brain levels of desipramine.
CONCLUSIONS AND IMPLICATIONS
The present study demonstrated that P-gp inhibition enhanced the intracerebral concentration of imipramine, thus supporting the hypothesis that P-gp activity restricts brain levels of certain antidepressants, including imipramine. These findings may help to explain reports of a beneficial response to adjunctive therapy with verapamil in TRD.
Keywords: P-glycoprotein, imipramine, desipramine, antidepressant, blood–brain barrier, microdialysis, treatment-resistant depression
Introduction
Recent preclinical studies indicate that several antidepressant drugs may be substrates of the multidrug resistance transporter P-glycoprotein (P-gp) at the blood–brain barrier (BBB) (O'Brien et al., 2012; transporter nomenclature follows Alexander et al., 2011). P-gp, encoded by the ABCB1 gene in humans, is expressed at many sites within the body, including the luminal membrane of the brain capillary endothelial cells which form the BBB (Cordoncardo et al., 1989). Drug efflux by P-gp at the BBB represents a major obstacle in the delivery of pharmacological compounds which are P-gp substrates to the brain, and has been linked to treatment failure in various brain disorders such as epilepsy and brain cancer (Siddiqui et al., 2003; Pauwels et al., 2007).
Several functional single nucleotide polymorphisms (SNPs) in the ABCB1 gene have been identified which affect P-gp expression and/or function (Cascorbi, 2006). These functional SNPs may therefore affect the ability of P-gp substrate drugs to reach effective concentrations in the brain. Emerging clinical evidence indicates that the response rate to treatment with antidepressants, particularly those which have been shown to be P-gp substrates at the BBB in vivo, may be associated with ABCB1 genotype (Uhr et al., 2008; Sarginson et al., 2010; Lin et al., 2011). This suggests that P-gp-mediated efflux may contribute to the high prevalence of treatment-resistant depression (TRD) by limiting antidepressant concentrations at their intracerebral site of action (O'Brien et al., 2012). In addition, preliminary clinical studies have suggested that co-administration of the P-gp inhibitor verapamil may be beneficial in TRD (Clarke et al., 2009). However, despite numerous in vivo studies demonstrating enhanced brain levels of several antidepressants in P-gp knockout mice, compared with wild-type controls, the relative contribution of P-gp-mediated efflux and passive permeability on the transport of these antidepressant drugs across the BBB has yet to be definitively determined, and the significance of putative P-gp efflux to the BBB transport of antidepressants remains contentious (O'Brien et al., 2012). Not all antidepressants are P-gp substrates, however. Mirtazapine is one such example (Uhr et al., 2003; 2008), and interestingly clinical response to mirtazapine is not associated with ABCB1 genotype (Uhr et al., 2008). Furthermore, the complexity of the relationship between antidepressants and P-gp should be noted, as well as the difficulties in extrapolating results from one experimental context to another (O'Brien et al., 2012). This point is illustrated by work from the Pariante group, where in vitro studies led to the proposal that activity of P-gp at the BBB may itself be a target of antidepressant action (Pariante et al., 2003; 2004), whereas recent in vivo results appear to contradict this hypothesis (Mason et al., 2011).
While several studies have investigated the distribution of antidepressants to the brain in P-gp knockout mice relative to wild-type controls, there is a paucity of research investigating the effect of pharmacological P-gp inhibition on the ability of antidepressants to penetrate the BBB, with only three such studies published to date to our knowledge (Ejsing and Linnet, 2005; Ejsing et al., 2006; Clarke et al., 2009). We have previously shown that pretreatment with verapamil leads to enhanced brain-to-serum ratios of the tricyclic antidepressant imipramine and its active metabolite, desipramine, in certain brain regions (Clarke et al., 2009). However, in vitro transport studies using different P-gp expressing cell lines have yielded conflicting findings regarding the P-gp substrate status of imipramine (Mahar Doan et al., 2002; Faassen et al., 2003). Therefore, it remains unclear whether P-gp limits the ability of imipramine to penetrate the BBB. These earlier studies in normal animals have only investigated brain-to-serum ratios at a single (terminal) time after administration of the antidepressant and therefore have not elucidated the time-dependent effect of P-gp inhibition on the distribution of these antidepressants into the brain.
The present study utilized an integrated intracerebral microdialysis technique to investigate the effect of pretreatment with one of two distinct P-gp inhibitors, verapamil or cyclosporin A (CsA), on free imipramine and desipramine concentrations in brain extracellular fluid (ECF) over time in wild-type Sprague Dawley rats. Intracerebral microdialysis represents a useful investigational tool which can be used to assess drug permeability across the BBB as a function of time, particularly when applied to the study of drug transporters in the CNS (Sawchuk and Elmquist, 2000).
Methods
Animals
All animal care and experimental procedures were in accordance with EU directive 89/609/EEC and approved by the Animal Experimentation & Ethics Committee of University College Cork. Male Sprague Dawley rats (Harlan Laboratories, UK), weighing 255–290 g, were used in this study (total n= 18). Animals were group housed, with 4–6 animals per cage and maintained on a 12 h light/dark cycle (lights on at 0800 h) with food and water ad libitum. Room temperature was controlled at 22 ± 1°C.
Surgical procedures
Animals were anaesthetized before surgery with a ketamine/xylazine mixture (90/10 mg·kg−1 i.p.), with maintenance of anaesthesia achieved by repeating 20–25% of the induction dose at 30–40 min intervals, as required. Analgesia was provided by preoperative administration of carprofen (3 mg·kg−1 s.c.). Throughout surgical procedures, the body temperature of each rat was maintained using a heating pad.
Catheterization surgery
Two indwelling catheters were surgically implanted in each rat using standard surgical techniques: one in the carotid artery for collection of serial blood samples and one in the external right jugular vein to facilitate i.v. drug administration (Thrivikraman et al., 2002; Huang et al., 2006; Heiser, 2007). All catheters were pyrogen-free polyethylene tubing (Instech Laboratories, Plymouth Meeting, PA, USA). The arterial and venous catheters consisted of BPE-T25 tubing (0.018″ID × 0.036″OD) and BPE-T50 tubing (0.023″ID × 0.038″OD) respectively. The catheters were subcutaneously tunnelled to the back of the neck of the rat, where they were exteriorized and connected to three-way Discofix® stopcocks (B. Braun, Melsungen, Germany). To prevent clotting, the catheters were filled with a heparinized saline solution (20 IU·mL−1).
Microdialysis surgery
Immediately after completion of catheterization surgery, while still anaesthetized, rats were placed in a stereotaxic frame (Model 900 Small Animal Stereotaxic Instrument, David Kopf Instruments, Bilaney Consultants, St Julians, Sevenoaks, UK) with the skull flat. A small burr hole was made in the skull, centred 2.7 mm anterior and 0.7 mm lateral to bregma. The microdialysis probe was slowly lowered 5 mm from dura into the prefrontal cortex (PFC) (Paxinos and Watson, 1998) and secured with skull screws and dental acrylic. The inlet of the probe was connected to a fluid swivel (Instech Laboratories) and the rats were single-housed in cylindrical plexiglass containers (Instech Laboratories) filled with bedding and food pellets. The venous and arterial catheters were secured to the swivel in the cage to prevent the rats from interfering with them, while at the same time enabling free movement. Artificial CSF (aCSF; 147 mM NaCl, 1.7 mM CaCl2, 0.9 mM MgCl2 and 4 mM KCl) was continuously perfused through each microdialysis probe at a rate of 1.5 µL·min−1 by a microlitre ‘Pico Plus’ syringe pump (Harvard Apparatus, Fircroft Way, Edenbridge, Kent, UK) and the rats were allowed to recover overnight before sampling on the following day during the optimal post-surgical period (de Lange et al., 2000).
Dialysis probe construction and calibration
Vertical concentric microdialysis probes were constructed as described elsewhere (Page and Lucki, 2002). Briefly, a piece of fused silica (ID 75 ± 3 µm, OD 150 ± 6 µm; CM Scientific Ltd, UK) was inserted through PE10 tubing (Instech Laboratories). A Spectra/Por® Micro-dialysis Hollow Fiber regenerated cellulose semi-permeable membrane with a 13 kD molecular weight cut-off (Spectrum Europe BV, Breda, the Netherlands) was placed over the fused silica and into the PE10 tubing, and fixed in place using epoxy adhesive. The open end of the semi-permeable membrane was sealed with a 0.5 mm epoxy plug, and the active area of the fibre, where diffusion takes place across the membrane, was limited to 3 mm in length by coating regions outside this range with epoxy adhesive. To determine the in vitro probe recovery rate, each probe was immersed in a well of aCSF containing a known concentration (100 ng·mL−1) of imipramine and desipramine. The recovered concentration of imipramine and desipramine in the perfusate was expressed as a percentage of the known concentration in the well. Probes used in the in vivo studies had in vitro recovery rates between 6.8 and 12.2% for imipramine and between 7.0 and 13.5% for desipramine. As imipramine is known to bind to plastic tubing (Friedl and Propping, 1984), it was not possible to calibrate the probes in vivo using standard techniques such as the no-net-flux or retrodialysis methods, due to imipramine binding to inlet (polyethylene) tubing in the probes (O'Brien et al., unpubl. obs.). As the diffusion properties of compounds in brain tissue are likely to be different from in vitro conditions, dialysate values were not corrected to account for the in vitro recovery rate of the probe. However, it was possible to directly compare the uncorrected dialysate concentrations between the groups as there was no statistical difference between in vitro probe recovery rates across the groups (Table 1), thus ensuring comparisons were valid as previously reported (Sato et al., 1994; Evrard et al., 1998; Page and Lucki, 2002; Page et al., 2010).
Table 1.
Summary of key pharmacokinetic (PK) parameters and probe recovery values
| IMI only | IMI + VERAP | IMI + CsA | Overall P value | ||
|---|---|---|---|---|---|
| Mean ± SEM | Mean ± SEM | Mean ± SEM | |||
| Plasma AUC (ng·mL−1·min) | Imipramine | 101 635 ± 18 370 | 88 002 ± 7876 | 81 041 ± 7350 | 0.500 |
| Desipramine | 11 137 ± 2393 | 46 050 ± 4984*** | 7990 ± 1527 | <0.001*** | |
| Imipramine plasma PK parameters | kel (min−1 × 10⁻³) | 9.5 ± 1.1 | 7.9 ± 0.6 | 8.8 ± 0.7 | 0.426 |
| t1/2 (min) | 79.8 ± 12.3 | 90.2 ± 7.0 | 81.5 ± 6.0 | 0.681 | |
| Cl (mL·min−1) | 15.43 ± 2.13 | 16.05 ± 1.55 | 17.69 ± 2.21 | 0.713 | |
| In vitro probe recovery (%) | Imipramine | 8.23 ± 0.80 | 8.91 ± 0.48 | 8.92 ± 0.66 | 0.703 |
| Desipramine | 8.62 ± 0.98 | 9.56 ± 0.68 | 9.18 ± 0.57 | 0.701 | |
| Dialysate AUC (ng·mL−1·min) | Imipramine | 1322 ± 98 | 1802 ± 144* | 2108 ± 169** | 0.004** |
| Desipramine | n/a1 | 158.4 ± 14 | n/a1 | n/a | |
| Ratio of imipramine dialysate AUC: plasma AUC | 0.0149 ± 0.0024 | 0.0215 ± 0.0028 | 0.0274 ± 0.0038* | 0.035* | |
P≤ 0.05;
P < 0.01;
P < 0.001 (relative to IMI only group).
Below limit of quantification.
n/a, not available.
Experimental design
Rats were divided into three groups: imipramine only (IMI only), imipramine plus verapamil (IMI + VERAP) and imipramine plus CsA (IMI + CsA; n= 6 per group) (Figure 1). Imipramine (5 mg·kg−1 i.v.) was administered to all rats via the jugular vein catheter, with or without pretreatment with either verapamil or CsA, both of which are P-gp inhibitors. Rats in the IMI + VERAP group were pretreated with verapamil (20 mg·kg−1 i.p.) 90 min before imipramine administration. Rats in the IMI + CsA group were pretreated with CsA (25 mg·kg−1 i.v.) 30 min before imipramine administration. The doses, routes of administration and timing of P-gp inhibitor administration used were based on earlier studies of P-gp inhibition (Tsai et al., 2002; Bart et al., 2003; Syvanen et al., 2006; Liow et al., 2007; Clarke et al., 2009). Microdialysis samples (dialysates) from the PFC were collected at 20 min intervals for 1 h before (blanks) and for 4 h after imipramine administration. Dialysates were stored at −80°C until analysed by HPLC. Blood samples were taken at eight time-points, one before imipramine administration (blank) and then at 5, 15, 30, 60, 120, 180 and 240 min after imipramine administration. Blood samples (∼250 µL) were immediately centrifuged at 1845× g for 5 min, plasma taken and stored at −80°C until extraction for analysis by HPLC with electrochemical detection. At the conclusion of the experiment, rats were deeply anaesthetized using i.v. ketamine/xylazine mixture, and bromophenol blue dye was then infused through the probe to mark its location. The rats were subsequently decapitated while under anaesthesia, and the brains removed for histological verification of probe placement. Data were discarded if the probe placement was outside of the PFC.
Figure 1.
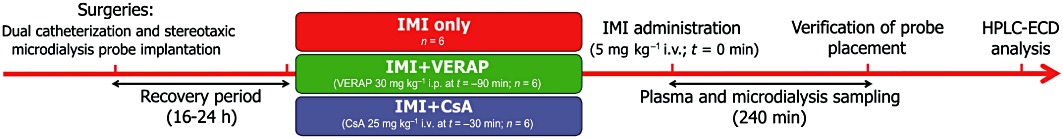
Experimental design. Diagram illustrating experimental design and timelines (refer to Methods section for full details).
Plasma extraction
Imipramine and its active metabolite desipramine were extracted from plasma using the liquid–liquid extraction technique described previously (Clarke et al., 2009), with some modifications. Briefly, 2 µL of the internal standard, trimipramine, was added to 98 µL of plasma, to yield a final concentration of 20 ng·mL−1 trimipramine. To this trimipramine-containing plasma, 1 mL of sodium hydroxide (2 M) and 3 mL of water were added. Extraction was carried out in 7.5 mL of 1.5% isoamyl alcohol in n-heptane by vortexing for 30 s, followed by agitation on a mechanical shaker for 15 min and then centrifugation at 3997× g for 15 min at 20°C. The upper solvent layer was transferred to a tube containing 200 µL of 25 mM orthophosphoric acid, vortexed for 30 s, then agitated on a mechanical shaker for 15 min followed by centrifugation at 3997× g for 15 min at room temperature. Twenty microlitres of the lower aqueous phase was injected onto the HPLC system for analysis.
HPLC equipment
The HPLC with electrochemical detection (HPLC-ECD) system consisted of a Shimadzu LC-20AD XR Prominence Pump, CBM-20A communication bus module, SIL-20AC XR Prominence Autosampler, CTO-20A Prominence Column oven (all supplied by Mason Technology, Cork, Ireland). System components were used in conjunction with Shimadzu LC solutions software (Mason Technology). The detector used was ESA Coulochem III with the 5041 Amperometric Cell (supplied by ESA Analytical, Ltd., Aylesbury, Bucks, England). All samples were injected onto a reversed phase Luna 3 µm C18(2) 150 × 2 mm column (Phenomenex UK Ltd., Macclesfield, UK), which was protected by Krudkatcher Ultra in-line filters (Phenomenex).
HPLC conditions
The HPLC-ECD method was adapted from previously described methods (Sato et al., 1994; Frahnert et al., 2003). Briefly, the mobile phase which was used on the HPLC system consisted of a mixture of potassium dihydrogen phosphate (25 mM, pH 7 with 4N NaOH) and HPLC grade acetonitrile (56:44). EDTA (17 mg·L−1) was added to this mixture and the mobile phase was filtered through Millipore 0.22 µm Durapore filters (Millipore, Ireland) and vacuum degassed prior to use. Compounds were eluted isocratically over a 30 min run-time at a flow rate of 0.4 mL·min−1 after a 20 µL injection. The column was maintained at a temperature of 30°C and samples/standards were kept at 8°C in the cooled autoinjector before analysis. The glassy carbon working electrode combined with a platinum reference electrode (ESA Analytical, Ltd.) was operated at a potential of 600 mV and a range of 50 nA.
Analyte identification and quantification
Imipramine, desipramine, verapamil and trimipramine (internal standard) were identified by their characteristic retention times as determined by standard injections which were run at regular intervals during sample analysis. For the extracted plasma samples, analyte : internal standard peak height ratios were measured and compared with standard injections, and results were expressed as ng analyte per mL of plasma. As no extraction procedure was necessary for microdialysis samples, analyte peak heights from undiluted samples were compared directly with standard injections and expressed as ng analyte per mL of dialysate. The limit of detection (S/N ratio of 2) was 0.22 ng·mL−1 and 0.28 ng·mL−1 for desipramine and imipramine, respectively, while the limit of quantification (S/N ratio of 5) was 0.56 ng·mL−1 for desipramine and 0.71 ng·mL−1 for imipramine. The coefficient of variation (% CV) for the HPLC method was 2% for desipramine and 3% for imipramine (n= 8). The accuracy of the technique was determined by carrying out the extraction procedure on plasma samples containing known concentrations of imipramine and desipramine followed by HPLC analysis. The mean (±SEM) concentration determined for extracted desipramine and impramine samples were 96 ± 1% and 102 ± 1% of the known concentration, respectively (n= 4).
Data analysis and statistical procedures
Pharmacokinetic parameters were calculated from the observed data by non-compartmental analysis. The area under the concentration-time curve (AUC) for imipramine and desipramine in plasma and dialysate samples was calculated using the linear trapezoidal method from the first to the last measured plasma concentration in all cases. The elimination rate constant (kel) for imipramine in plasma was calculated by log-linear regression of the last four plasma concentration time-points. The apparent terminal elimination half-life (t1/2) of imipramine in plasma was obtained from the kel. Imipramine clearance from plasma (Cl) after i.v. bolus dose administration was calculated by dividing the i.v. dose by the AUC. All statistical analyses were carried out using standard commercial software (PASW Statistics, version 17.0.2; SPSS, Inc., Chicago, IL, USA). Plasma and dialysate concentration versus time profiles was compared using one-way repeated measures anova. Statistical analyses of all other parameters were carried out using one-way anova. Where a significant overall group effect was observed, the two-sided Dunnett's post hoc test was used to elucidate differences between the IMI only group and the other two groups. All data are reported as mean ± SEM. The criterion for statistical significance was P≤ 0.05.
Materials
High performance liquid chromatography (HPLC) grade acetonitrile, potassium dihydrogen phosphate and orthophosphoric acid were obtained from Fisher Scientific (Ireland). Heparin sodium solution (Wockhardt UK Ltd, Wrexham, UK) and CsA (Sandoz Pharmaceuticals, Surrey, UK) were purchased from Uniphar Group (Cork, Ireland). Imipramine, desipramine, trimipramine and verapamil were obtained from Sigma-Aldrich (Wicklow, Ireland) as were all other chemicals unless otherwise stated.
Results
Plasma imipramine and desipramine pharmacokinetics
There was no significant difference between the groups in terms of imipramine levels in plasma over time [F(2, 15) = 0.696, P > 0.05; Figure 2A]. Furthermore, there was no significant difference in mean plasma imipramine AUC values between the groups [F(2, 15) = 0.726, P > 0.05; Table 1]. Plasma pharmacokinetic parameters for imipramine are listed in Table 1. No statistically significant differences between the groups were observed in any of the plasma pharmacokinetic parameters.
Figure 2.
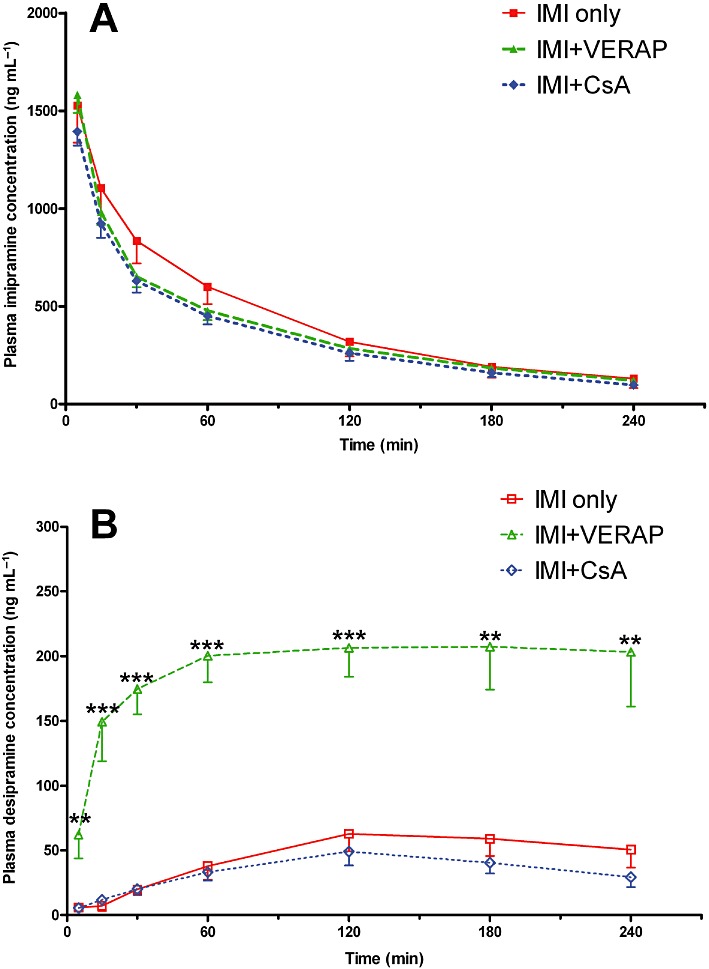
Plasma imipramine and desipramine profiles. (A) Imipramine concentrations in plasma as measured at different time-points. There was no statistical difference in imipramine plasma profiles between the three groups. (B) Desipramine concentrations in plasma as measured at different time-points. There was a significant overall difference between the groups in terms of desipramine plasma profiles (P < 0.001). Desipramine levels were markedly increased in the IMI + VERAP group relative to the IMI only group at all time-points; **P < 0.01; ***P < 0.001. Data shown are means ± SEM from 5–6 animals per group.
Due to transient technical difficulties with baseline stabilization pertaining to the electrochemical detection technique, it was not possible to determine plasma desipramine concentrations at certain time-points for 2 of the 18 animals in the study. As a result of these missing individual data points, these animals could not be included in repeated measures analysis of plasma desipramine levels, thus reducing our group numbers to n= 5 for both the IMI only and IMI + CsA groups for the repeated measures anova. Nonetheless, there was a significant overall group effect on plasma desipramine levels over time [F(2, 13) = 53.311, P < 0.001; Figure 2B], with significantly higher plasma desipramine concentrations in the IMI + VERAP group than the IMI only group at every time-point (Figure 2B). In addition, there was a significant group effect on mean plasma desipramine AUC values [F(2, 15) = 40.689, P < 0.001; Table 1], with post hoc analysis revealing that the mean plasma desipramine AUC was significantly higher in the IMI + VERAP group than the IMI only group (P < 0.001), with no difference between the IMI only and IMI + CsA groups (Table 1).
Dialysate imipramine and desipramine PKs
There was a significant overall group effect on dialysate imipramine concentrations over time [F(2, 15) = 8.361, P < 0.01; Figure 3A], with significantly greater dialysate imipramine concentrations observed in the IMI + CsA group than the IMI only group between the second and fifth samples inclusive (Figure 3A). In addition, there was a significant overall difference between the groups in terms of dialysate imipramine AUC values [F(2, 15) = 7.533, P < 0.01; Table 1]. The increases in imipramine dialysate AUC values observed in the IMI + VERAP group (36% increase; P= 0.05) and IMI + CsA group (59% increase; P < 0.01) relative to the IMI only group were statistically significant. Desipramine levels in the dialysate samples proved to be below the limit of quantification in the IMI only and IMI + CsA groups. However, it was possible to quantify desipramine levels in the dialysate from rats in the IMI + VERAP group (Figure 3B; Table 1), thus suggesting that the levels were higher in this group although statistical analysis was precluded by the lack of quantifiable samples from the other two groups.
Figure 3.
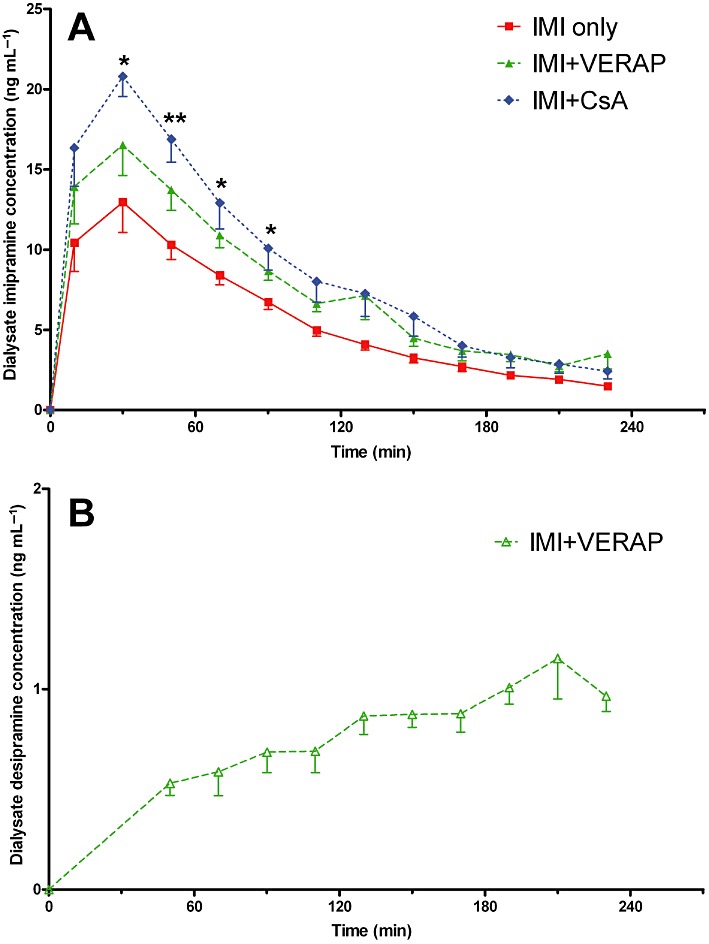
Dialysate imipramine and desipramine profiles. (A) Imipramine concentrations in the dialysate samples as measured at different time intervals. Samples were continually collected and taken for analysis at 20 min intervals. There was a significant overall group effect on dialysate imipramine concentrations over time (P < 0.05). Imipramine concentrations were significantly higher in the IMI + CsA group than the IMI only group between the second and fifth samples, inclusive; *P < 0.05; **P < 0.01. (B) Dialysate desipramine concentrations as measured at different time intervals. Note: Desipramine concentrations in dialysate samples from the IMI only and IMI + CsA groups were below the limit of quantification. The first five time-points shown represent mean values of 3–5 animals per time-point. At these early time-points, values for the excluded animal(s) were below the limit of quantification and were therefore omitted. Data shown are means ± SEM from six animals per group.
Comparison of dialysate : plasma imipramine AUC ratios
The dialysate : plasma imipramine AUC ratio gives an indication of BBB transport as it accounts for any variations in plasma imipramine levels which might explain observed differences in dialysate concentration. There was a significant overall group effect on the ratio of dialysate : plasma imipramine AUC [F(2, 15) = 4.210, P < 0.05; Table 1]. Post hoc analysis revealed that the 84% increase observed in the IMI + CsA group relative to the IMI only group was statistically significant (P < 0.05), while the 44% increase observed in the IMI + VERAP group relative to the IMI only group was not statistically significant (Figure 4).
Figure 4.
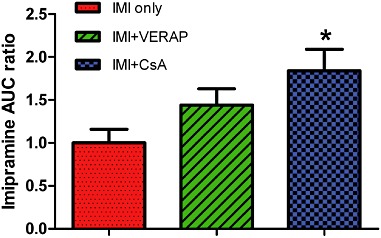
Comparison of dialysate : plasma imipramine AUC ratio. Dialysate : plasma imipramine AUC ratio for each group, normalized to IMI only group. There was a significant overall group effect (P < 0.05), with post hoc analysis showing that the 84% increase evident in the IMI + CsA group is statistically significant; *P < 0.05. The 44% increase observed in the IMI + VERAP group did not reach statistical significance. Data shown are means ± SEM from six animals per group.
Discussion and conclusions
Despite some conflicting reports in the literature, much recent evidence highlights a potential link between therapeutic response to antidepressants which have been shown to be P-gp substrates and functional SNPs in the ABCB1 gene which encodes P-gp in humans (Gex-Fabry et al., 2008; Kato et al., 2008; Nikisch et al., 2008; Uhr et al., 2008; Sarginson et al., 2010; Lin et al., 2011). The present study demonstrated that pretreatment with either verapamil or CsA, both of which are well-established P-gp inhibitors, significantly increased levels of the tricyclic antidepressant imipramine in brain ECF without affecting imipramine levels in plasma. This offers the intriguing possibility of adjunctive treatment with P-gp inhibitors to enhance the BBB penetrating ability of certain antidepressant therapies, which may be particularly relevant to TRD. Furthermore, the potential to lower the dose of the antidepressant required to achieve the same clinical effect when administered in combination with a P-gp inhibitor may help to negate some of the problematic peripheral side effects associated with antidepressant therapy. Both verapamil and CsA are first-generation P-gp inhibitors with other pharmacological activities aside from P-gp inhibition (Colabufo et al., 2010). Verapamil is primarily used as a calcium channel blocker, while CsA is an immunosuppressive agent. Therefore, unwanted side effects associated with other pharmacological actions are likely to preclude the widespread use of these particular drugs to achieve adjunctive P-gp inhibition in the management of depression. More specific second- and third-generation P-gp inhibitors may represent viable alternatives due to reduced off-target effects. However, it is important to be cautious when extrapolating results from preclinical rodent studies to the clinical setting due to potential species differences in terms of P-gp substrate specificity (Yamazaki et al., 2001; Baltes et al., 2007).
The P-gp-inhibition-mediated increases in brain antidepressant levels occurred independently of any significant alteration in the plasma pharmacokinetics of imipramine. Clinical investigations have demonstrated that co-administration of verapamil increased imipramine bioavailability following oral administration in healthy volunteers, and this effect might have been due to reduced clearance of imipramine (Hermann et al., 1992). In the present study, pretreatment with verapamil did not alter the plasma clearance of imipramine (Table 1). We have earlier reported a significant, but small, increase in serum imipramine concentration at a single (terminal) time-point following verapamil pretreatment (Clarke et al., 2009). This effect was not observed in the present study, possibly due to the different routes of imipramine administration employed in the two studies (i.p. previously vs. i.v. in the present study) or the different methods of sampling (trunk blood collection following decapitation previously vs. sampling from indwelling catheter in the present study). The ratio of dialysate : plasma imipramine AUC for animals in the IMI + CsA group was 84% higher than for animals in the IMI only group. This observed difference was statistically significant, which strongly suggests enhanced imipramine transport across the BBB in CsA-treated animals. Although dialysate imipramine AUC was significantly higher in the IMI + VERAP group than the IMI only group, the 44% difference in the dialysate : plasma imipramine AUC ratio observed between these groups did not reach statistical significance, probably due to the increased variability observed when plasma concentrations were taken into account. As both CsA and verapamil are well characterized as P-gp inhibitors (Baumert and Hilgeroth, 2009), these data corroborate our previous findings (Clarke et al., 2009) and further support the hypothesis that P-gp limits the ability of certain antidepressants, including imipramine, to cross the BBB (O'Brien et al., 2012). Moreover, it is worth noting that the greater increase in brain imipramine levels observed in the CsA pretreated group compared with verapamil pretreated animals is in agreement with CsA being a more potent P-gp inhibitor than verapamil (Hsiao et al., 2008).
To our knowledge, the present study is the first to employ the microdialysis technique to investigate the effect of P-gp inhibition on the ability of antidepressants to cross the BBB and enter the brain. The microdialysis technique offers several advantages over traditional methods which involve the analysis of drug concentrations in brain homogenate samples (de Lange et al., 2000; Hammarlund-Udenaes, 2010). Firstly, samples obtained using the microdialysis technique only contain drug which has penetrated the BBB, whereas samples obtained from brain homogenates contain drug still within the blood in the network of capillaries throughout the brain. Secondly, microdialysis measures only free drug molecules in the brain ECF, whereas the traditional brain homogenate method does not typically differentiate between pharmacologically inactive bound and active unbound drug. Thirdly, using the microdialysis technique, it is possible to track fluctuations in brain drug concentrations in individual animals over time with or without P-gp inhibition, thus providing temporal resolution which is not possible with homogenate-based approaches. In addition, microdialysis enables us to investigate the effect of P-gp inhibition on drug concentrations in a specific brain region of interest, such as the PFC. While region-specific analysis can be carried out using brain homogenate techniques (Clarke et al., 2009), previous studies have almost exclusively focused on whole brain antidepressant drug concentrations rather than investigating region-specific effects. This is a major limitation of such studies considering that there are differences in P-gp expression and function between different anatomical regions in the brain (Kwan et al., 2003; Clarke et al., 2009). Therefore, the use of whole brain analysis previously may have obscured important region-specific differences in drug concentrations. When comparing dialysate concentrations which have not been corrected to account for in vivo probe recovery in microdialysis studies investigating the effect of P-gp efflux on the net BBB transport of a drug, it is important to consider that altering drug clearance by P-gp inhibition is likely have an effect on probe recovery (Sawchuk and Elmquist, 2000). However, it can be predicted that in vivo probe recovery would be lower in rats treated with a P-gp inhibitor than in untreated animals (Bungay et al., 1990), and this has proven to be the case experimentally (de Lange et al., 1998; Xie et al., 1999). Therefore, it is likely that if it were possible to correct our dialysate concentrations for in vivo recovery and thereby calculate actual brain ECF imipramine concentrations, we would in fact see an even more marked increase in brain imipramine levels in the verapamil- and CsA-pretreated animals, relative to the untreated controls. Given the different methodology employed in the present study, it is difficult to compare the magnitude of the increases in brain imipramine concentrations reported here with those reported previously in other studies which have investigated the effect of P-gp inhibition on the BBB transport of antidepressants. Moreover, it will be of interest to assess how these findings relate to human patients treated chronically with antidepressants.
Interestingly, verapamil pretreatment markedly enhanced the concentrations of desipramine, an active metabolite of imipramine and an antidepressant in its own right, in plasma. The mean AUC for desipramine in plasma in the IMI + VERAP group was over fourfold greater than the corresponding value in the IMI only group and almost six times greater than the desipramine plasma AUC in the CsA pretreated group. We previously reported a 1.3-fold, non-significant increase in serum desipramine levels in verapamil pretreated rats relative to controls (Clarke et al., 2009). The greater difference observed in the present study is likely to be due to differences in the experimental protocol (i.e. dosing regimen and sampling methods) as discussed previously. The mechanism underlying this verapamil-mediated increase in plasma desipramine concentrations is unclear at present. However, it seems unlikely that it is mediated by P-gp inhibition, as there was no increase in plasma desipramine levels in CsA-pretreated animals. In addition to its primary pharmacological role as a calcium channel antagonist and its ability to inhibit P-gp, verapamil interacts with various other transporters, receptors and metabolic enzymes (Auguet et al., 1986; Cole et al., 2000; Polasek et al., 2004; Wang et al., 2004). Moreover, verapamil has been shown to alter the pharmacokinetics of several drugs (Backman et al., 1994; Kantola et al., 1998; Fleishaker et al., 2000; Kovarik et al., 2005). Thus, it seems likely that the increase in plasma desipramine levels might be mediated via one of these alternative interactions rather than by inhibition of P-gp. In particular, verapamil has been described as an inhibitor of cytochrome P450 enzymes (Wang et al., 2004), and these enzymes play the predominant role in imipramine and desipramine metabolism in humans (Lemoine et al., 1993). While co-administration of verapamil did not alter imipramine plasma clearance (Table 1), the increase in plasma desipramine levels observed in the IMI + VERAP group might be due to verapamil-mediated inhibition of desipramine metabolism. In addition, it is worth noting that a functional cytochrome P450 monooxygenase system exists in the brain (Ravindranath, 1998). Therefore, putative inhibition of these enzymes by verapamil could affect drug levels in the brain. The increased desipramine levels in plasma observed in the IMI + VERAP group were reflected in the brain, where desipramine levels in microdialysis samples could only be reliably quantified in animals pretreated with verapamil, thus indicating higher brain levels in these animals. Whether this increase in brain desipramine concentrations plays a role in the therapeutic benefits of verapamil augmentation in TRD (Clarke et al., 2009) remains to be clarified. However, it should be noted that a clinical study in healthy volunteers found that verapamil co-administration had no effect on desipramine concentrations in plasma following oral administration of imipramine (Hermann et al., 1992). Therefore, the increase in desipramine levels following verapamil pretreatment in rats treated with i.v. imipramine observed here might not be relevant to humans receiving oral imipramine treatment. As it was not possible to quantify desipramine concentrations in dialysate samples from the IMI only or IMI + CsA groups, it was not possible to determine whether pretreatment with either P-gp inhibitor affected the BBB transport of desipramine.
In conclusion, the present study clearly demonstrated that pretreatment with either verapamil or CsA, both of which are P-gp inhibitors, increased brain levels of the antidepressant imipramine in normal rats. This shows that P-gp efflux limits the ability of imipramine to cross the BBB. These findings support the increasing body of clinical evidence which indicates that P-gp prevents some antidepressants from reaching effective concentrations at their sites of action in the brain. Such effects could contribute to the high prevalence of TRD. In light of these findings, it is tempting to speculate that adjunctive therapy with P-gp inhibitors may offer clinical benefits in the treatment of depression.
Acknowledgments
The authors wish to thank Chunlong Huang and staff at the University College Cork Biological Services Unit for their technical assistance with this study. The Alimentary Pharmabiotic Centre is a research centre funded by Science Foundation Ireland (SFI), through the Irish Government's National Development Plan. T. G. D. and J. F. C. are supported by SFI (grant nos. 02/CE/B124 and 07/CE/B1368). The centre is also funded by GlaxoSmithKline. The SFI-funded Strategic Research Cluster grant no. 07/SRC/B1154 and the Irish Drug Delivery Network also fund B. T. G. and J. F. C. G. C. received research funding from the American Neurogastroenterology and Motility Society.
Glossary
- AUC
area under the concentration-time curve
- BBB
blood–brain barrier
- C0
initial concentration following bolus intravenous administration
- Cl
drug clearance from plasma
- CsA
cyclosporin A
- ECF
extracellular fluid
- HPLC-ECD
high performance liquid chromatography with electrochemical detection
- kel
elimination rate constant
- PFC
prefrontal cortex
- P-gp
P-glycoprotein
- PK
pharmacokinetic
- SNP
single nucleotide polymorphism
- t1/2
half-life of drug in plasma
- TRD
treatment-resistant depression
- Vd
volume of distribution
Conflicts of interest
None.
References
- Alexander SPH, Mathie A, Peters JA. Guide to Receptors and Channels (GRAC), 5th Edition. Br J Pharmacol. 2011;164(Suppl. 1):S1–S324. doi: 10.1111/j.1476-5381.2011.01649_1.x. [DOI] [PMC free article] [PubMed] [Google Scholar]
- Auguet M, Delaflotte S, Clostre F, Defeudis FV. Verapamil as an apparent competitive antagonist of the serotonin receptor of rabbit isolated aorta. Gen Pharmacol. 1986;17:133–135. doi: 10.1016/0306-3623(86)90129-1. [DOI] [PubMed] [Google Scholar]
- Backman JT, Olkkola KT, Aranko K, Himberg JJ, Neuvonen PJ. Dose of midazolam should be reduced during diltiazem and verapamil treatments. Br J Clin Pharmacol. 1994;37:221–225. doi: 10.1111/j.1365-2125.1994.tb04266.x. [DOI] [PMC free article] [PubMed] [Google Scholar]
- Baltes S, Gastens AM, Fedrowitz M, Potschka H, Kaever V, Loscher W. Differences in the transport of the antiepileptic drugs phenytoin, levetiracetam and carbamazepine by human and mouse P-glycoprotein. Neuropharmacology. 2007;52:333–346. doi: 10.1016/j.neuropharm.2006.07.038. [DOI] [PubMed] [Google Scholar]
- Bart J, Willemsen AT, Groen HJ, van der Graaf WT, Wegman TD, Vaalburg W, et al. Quantitative assessment of P-glycoprotein function in the rat blood-brain barrier by distribution volume of [11C]verapamil measured with PET. Neuroimage. 2003;20:1775–1782. doi: 10.1016/s1053-8119(03)00405-1. [DOI] [PubMed] [Google Scholar]
- Baumert C, Hilgeroth A. Recent advances in the development of P-gp inhibitors. Anticancer Agents Med Chem. 2009;9:415–436. doi: 10.2174/1871520610909040415. [DOI] [PubMed] [Google Scholar]
- Bungay PM, Morrison PF, Dedrick RL. Steady-state theory for quantitative microdialysis of solutes and water in vivo and in vitro. Life Sci. 1990;46:105–119. doi: 10.1016/0024-3205(90)90043-q. [DOI] [PubMed] [Google Scholar]
- Cascorbi I. Role of pharmacogenetics of ATP-binding cassette transporters in the pharmacokinetics of drugs. Pharmacol Ther. 2006;112:457–473. doi: 10.1016/j.pharmthera.2006.04.009. [DOI] [PubMed] [Google Scholar]
- Clarke G, O'Mahony SM, Cryan JF, Dinan TG. Verapamil in treatment resistant depression: a role for the P-glycoprotein transporter? Hum Psychopharmacol. 2009;24:217–223. doi: 10.1002/hup.1008. [DOI] [PubMed] [Google Scholar]
- Colabufo NA, Berardi F, Cantore M, Contino M, Inglese C, Niso M, et al. Perspectives of P-glycoprotein modulating agents in oncology and neurodegenerative diseases: pharmaceutical, biological, and diagnostic potentials. J Med Chem. 2010;53:1883–1897. doi: 10.1021/jm900743c. [DOI] [PubMed] [Google Scholar]
- Cole SPC, Loe DW, Deeley RG. Verapamil stimulates glutathione transport by the 190-kDa multidrug resistance protein 1 (MRP1) J Pharmacol Exp Ther. 2000;293:530–538. [PubMed] [Google Scholar]
- Cordoncardo C, O'Brien JP, Casals D, Rittmangrauer L, Biedler JL, Melamed MR, et al. Multidrug-resistance gene (P-glycoprotein) is expressed by endothelial-cells at blood-brain barrier sites. Proc Natl Acad Sci U S A. 1989;86:695–698. doi: 10.1073/pnas.86.2.695. [DOI] [PMC free article] [PubMed] [Google Scholar]
- Ejsing TB, Linnet K. Influence of P-glycoprotein inhibition on the distribution of the tricyclic antidepressant nortriptyline over the blood-brain barrier. Hum Psychopharmacol. 2005;20:149–153. doi: 10.1002/hup.667. [DOI] [PubMed] [Google Scholar]
- Ejsing TB, Hasselstrom J, Linnet K. The influence of P-glycoprotein on cerebral and hepatic concentrations of nortriptyline and its metabolites. Drug Metabol Drug Interact. 2006;21:139–162. doi: 10.1515/dmdi.2006.21.3-4.139. [DOI] [PubMed] [Google Scholar]
- Evrard PA, Ragusi C, Boschi G, Verbeeck RK, Scherrmann JM. Simultaneous microdialysis in brain and blood of the mouse: extracellular and intracellular brain colchicine disposition. Brain Res. 1998;786:122–127. doi: 10.1016/s0006-8993(97)01454-6. [DOI] [PubMed] [Google Scholar]
- Faassen F, Vogel G, Spanings H, Vromans H. Caco-2 permeability, P-glycoprotein transport ratios and brain penetration of heterocyclic drugs. Int J Pharm. 2003;263:113–122. doi: 10.1016/s0378-5173(03)00372-7. [DOI] [PubMed] [Google Scholar]
- Fleishaker JC, Sisson TA, Carel BJ, Azie NE. Pharmacokinetic interaction between verapamil and almotriptan in healthy volunteers. Clin Pharmacol Ther. 2000;67:498–503. doi: 10.1067/mcp.2000.106292. [DOI] [PubMed] [Google Scholar]
- Frahnert C, Rao ML, Grasmader K. Analysis of eighteen antidepressants, four atypical antipsychotics and active metabolites in serum by liquid chromatography: a simple tool for therapeutic drug monitoring. J Chromatogr B Analyt Technol Biomed Life Sci. 2003;794:35–47. doi: 10.1016/s1570-0232(03)00393-3. [DOI] [PubMed] [Google Scholar]
- Friedl W, Propping P. 3H-imipramine binding in human platelets: a study in normal twins. Psychiatry Res. 1984;11:279–285. doi: 10.1016/0165-1781(84)90002-7. [DOI] [PubMed] [Google Scholar]
- Gex-Fabry M, Eap CB, Oneda B, Gervasoni N, Aubry JM, Bondolfi G, et al. CYP2D6 and ABCB1 genetic variability: influence on paroxetine plasma level and therapeutic response. Ther Drug Monit. 2008;30:474–482. doi: 10.1097/FTD.0b013e31817d6f5d. [DOI] [PubMed] [Google Scholar]
- Hammarlund-Udenaes M. Active-site concentrations of chemicals – are they a better predictor of effect than plasma/organ/tissue concentrations? Basic Clin Pharmacol Toxicol. 2010;106:215–220. doi: 10.1111/j.1742-7843.2009.00517.x. [DOI] [PubMed] [Google Scholar]
- Heiser A. Rat Jugular Vein and Carotid Artery Catheterization for Acute Survival Studies: A Practical Guide. 1st edn. New York: Springer; 2007. [Google Scholar]
- Hermann DJ, Krol TF, Dukes GE, Hussey EK, Danis M, Han YH, et al. Comparison of verapamil, diltiazem, and labetalol on the bioavailability and metabolism of imipramine. J Clin Pharmacol. 1992;32:176–183. doi: 10.1002/j.1552-4604.1992.tb03823.x. [DOI] [PubMed] [Google Scholar]
- Hsiao P, Bui T, Ho RJ, Unadkat JD. In vitro-to-in vivo prediction of P-glycoprotein-based drug interactions at the human and rodent blood-brain barrier. Drug Metab Dispos. 2008;36:481–484. doi: 10.1124/dmd.107.018176. [DOI] [PubMed] [Google Scholar]
- Huang C, Yoshimoto M, Miki K, Johns EJ. The contribution of brain angiotensin II to the baroreflex regulation of renal sympathetic nerve activity in conscious normotensive and hypertensive rats. J Physiol. 2006;574:597–604. doi: 10.1113/jphysiol.2006.107326. [DOI] [PMC free article] [PubMed] [Google Scholar]
- Kantola T, Kivisto KT, Neuvonen PJ. Erythromycin and verapamil considerably increase serum simvastatin and simvastatin acid concentrations. Clin Pharmacol Ther. 1998;64:177–182. doi: 10.1016/S0009-9236(98)90151-5. [DOI] [PubMed] [Google Scholar]
- Kato M, Fukuda T, Serretti A, Wakeno M, Okugawa G, Ikenaga Y, et al. ABCB1 (MDR1) gene polymorphisms are associated with the clinical response to paroxetine in patients with major depressive disorder. Prog Neuropsychopharmacol Biol Psychiatry. 2008;32:398–404. doi: 10.1016/j.pnpbp.2007.09.003. [DOI] [PubMed] [Google Scholar]
- Kovarik JM, Beyer D, Bizot MN, Jiang Q, Allison MJ, Schmouder RL. Pharmacokinetic interaction between verapamil and everolimus in healthy subjects. Br J Clin Pharmacol. 2005;60:434–437. doi: 10.1111/j.1365-2125.2005.02434.x. [DOI] [PMC free article] [PubMed] [Google Scholar]
- Kwan P, Sills GJ, Butler E, Gant TW, Brodie MJ. Differential expression of multidrug resistance genes in naive rat brain. Neurosci Lett. 2003;339:33–36. doi: 10.1016/s0304-3940(02)01453-2. [DOI] [PubMed] [Google Scholar]
- de Lange EC, de Bock G, Schinkel AH, de Boer AG, Breimer DD. BBB transport and P-glycoprotein functionality using MDR1A (−/−) and wild-type mice. Total brain versus microdialysis concentration profiles of rhodamine-123. Pharm Res. 1998;15:1657–1665. doi: 10.1023/a:1011988024295. [DOI] [PubMed] [Google Scholar]
- de Lange ECM, de Boer AG, Breimer DD. Methodological issues in microdialysis sampling for pharmacokinetic studies. Adv Drug Deliv Rev. 2000;45:125–148. doi: 10.1016/s0169-409x(00)00107-1. [DOI] [PubMed] [Google Scholar]
- Lemoine A, Gautier JC, Azoulay D, Kiffel L, Belloc C, Guengerich FP, et al. Major pathway of imipramine metabolism is catalyzed by cytochromes P-450 1A2 and P-450 3A4 in human liver. Mol Pharmacol. 1993;43:827–832. [PubMed] [Google Scholar]
- Lin KM, Chiu YF, Tsai IJ, Chen CH, Shen WW, Liu SC, et al. ABCB1 gene polymorphisms are associated with the severity of major depressive disorder and its response to escitalopram treatment. Pharmacogenet Genomics. 2011;21:163–170. doi: 10.1097/FPC.0b013e32833db216. [DOI] [PubMed] [Google Scholar]
- Liow JS, Lu S, McCarron JA, Hong J, Musachio JL, Pike VW, et al. Effect of a P-glycoprotein inhibitor, Cyclosporin A, on the disposition in rodent brain and blood of the 5-HT1A receptor radioligand, [11C](R)-(-)-RWAY. Synapse. 2007;61:96–105. doi: 10.1002/syn.20348. [DOI] [PubMed] [Google Scholar]
- Mahar Doan KM, Humphreys JE, Webster LO, Wring SA, Shampine LJ, Serabjit-Singh CJ, et al. Passive permeability and P-glycoprotein-mediated efflux differentiate central nervous system (CNS) and non-CNS marketed drugs. J Pharmacol Exp Ther. 2002;303:1029–1037. doi: 10.1124/jpet.102.039255. [DOI] [PubMed] [Google Scholar]
- Mason BL, Thomas SA, Lightman SL, Pariante CM. Desipramine treatment has minimal effects on the brain accumulation of glucocorticoids in P-gp-deficient and wild-type mice. Psychoneuroendocrinology. 2011;36:1351–1360. doi: 10.1016/j.psyneuen.2011.03.008. [DOI] [PMC free article] [PubMed] [Google Scholar]
- Nikisch G, Eap CB, Baumann P. Citalopram enantiomers in plasma and cerebrospinal fluid of ABCB1 genotyped depressive patients and clinical response: a pilot study. Pharmacol Res. 2008;58:344–347. doi: 10.1016/j.phrs.2008.09.010. [DOI] [PubMed] [Google Scholar]
- O'Brien FE, Dinan TG, Griffin BT, Cryan JF. Interactions between antidepressants and P-glycoprotein at the blood-brain barrier: clinical significance of in vitro and in vivo findings. Br J Pharmacol. 2012;165:289–312. doi: 10.1111/j.1476-5381.2011.01557.x. [DOI] [PMC free article] [PubMed] [Google Scholar]
- Page ME, Lucki I. Effects of acute and chronic reboxetine treatment on stress-induced monoamine efflux in the rat frontal cortex. Neuropsychopharmacology. 2002;27:237–247. doi: 10.1016/S0893-133X(02)00301-9. [DOI] [PubMed] [Google Scholar]
- Page ME, Bao L, Andre P, Pelta-Heller J, Sluzas E, Gonzalez-Alegre P, et al. Cell-autonomous alteration of dopaminergic transmission by wild type and mutant (DeltaE) TorsinA in transgenic mice. Neurobiol Dis. 2010;39:318–326. doi: 10.1016/j.nbd.2010.04.016. [DOI] [PMC free article] [PubMed] [Google Scholar]
- Pariante CM, Kim RB, Makoff A, Kerwin RW. Antidepressant fluoxetine enhances glucocorticoid receptor function in vitro by modulating membrane steroid transporters. Br J Pharmacol. 2003;139:1111–1118. doi: 10.1038/sj.bjp.0705357. [DOI] [PMC free article] [PubMed] [Google Scholar]
- Pariante CM, Thomas SA, Lovestone S, Makoff A, Kerwin RW. Do antidepressants regulate how cortisol affects the brain? Psychoneuroendocrinology. 2004;29:423–447. doi: 10.1016/j.psyneuen.2003.10.009. [DOI] [PubMed] [Google Scholar]
- Pauwels EKJ, Erba P, Mariani G, Gomes CMF. Multidrug resistance in cancer: its mechanism and its modulation. Drug News Perspect. 2007;20:371–377. doi: 10.1358/dnp.2007.20.6.1141496. [DOI] [PubMed] [Google Scholar]
- Paxinos G, Watson C. The Rat Brain in Stereotaxic Coordinates. 4th edn. San Diego: Academic Press; 1998. [Google Scholar]
- Polasek TM, Elliot DJ, Lewis BC, Miners JO. Mechanism-based inactivation of human cytochrome P4502C8 by drugs in vitro. J Pharmacol Exp Ther. 2004;311:996–1007. doi: 10.1124/jpet.104.071803. [DOI] [PubMed] [Google Scholar]
- Ravindranath V. Metabolism of xenobiotics in the central nervous system: implications and challenges. Biochem Pharmacol. 1998;56:547–551. doi: 10.1016/s0006-2952(97)00671-0. [DOI] [PubMed] [Google Scholar]
- Sarginson JE, Lazzeroni LC, Ryan HS, Ershoff BD, Schatzberg AF, Murphy GM. ABCB1 (MDR1) polymorphisms and antidepressant response in geriatric depression. Pharmacogenet Genomics. 2010;20:467–475. doi: 10.1097/FPC.0b013e32833b593a. [DOI] [PubMed] [Google Scholar]
- Sato Y, Shibanoki S, Sugahara M, Ishikawa K. Measurement and pharmacokinetic analysis of imipramine and its metabolite by brain microdialysis. Br J Pharmacol. 1994;112:625–629. doi: 10.1111/j.1476-5381.1994.tb13120.x. [DOI] [PMC free article] [PubMed] [Google Scholar]
- Sawchuk RJ, Elmquist WF. Microdialysis in the study of drug transporters in the CNS. Adv Drug Deliv Rev. 2000;45:295–307. doi: 10.1016/s0169-409x(00)00104-6. [DOI] [PubMed] [Google Scholar]
- Siddiqui A, Kerb R, Weale ME, Brinkmann U, Smith A, Goldstein DB, et al. Association of multidrug resistance in epilepsy with a polymorphism in the drug-transporter gene ABCB1. N Engl J Med. 2003;348:1442–1448. doi: 10.1056/NEJMoa021986. [DOI] [PubMed] [Google Scholar]
- Syvanen S, Blomquist G, Sprycha M, Hoglund AU, Roman M, Eriksson O, et al. Duration and degree of cyclosporin induced P-glycoprotein inhibition in the rat blood-brain barrier can be studied with PET. Neuroimage. 2006;32:1134–1141. doi: 10.1016/j.neuroimage.2006.05.047. [DOI] [PubMed] [Google Scholar]
- Thrivikraman KV, Huot RL, Plotsky PM. Jugular vein catheterization for repeated blood sampling in the unrestrained conscious rat. Brain Res Brain Res Protoc. 2002;10:84–94. doi: 10.1016/s1385-299x(02)00185-x. [DOI] [PubMed] [Google Scholar]
- Tsai TH, Liu SC, Tsai PL, Ho LK, Shum AY, Chen CF. The effects of the cyclosporin A, a P-glycoprotein inhibitor, on the pharmacokinetics of baicalein in the rat: a microdialysis study. Br J Pharmacol. 2002;137:1314–1320. doi: 10.1038/sj.bjp.0704959. [DOI] [PMC free article] [PubMed] [Google Scholar]
- Uhr M, Grauer MT, Holsboer F. Differential enhancement of antidepressant penetration into the brain in mice with abcb1ab (mdr1ab) P-glycoprotein gene disruption. Biol Psychiatry. 2003;54:840–846. doi: 10.1016/s0006-3223(03)00074-x. [DOI] [PubMed] [Google Scholar]
- Uhr M, Tontsch A, Namendorf C, Ripke S, Lucae S, Ising M, et al. Polymorphisms in the drug transporter gene ABCB1 predict antidepressant treatment response in depression. Neuron. 2008;57:203–209. doi: 10.1016/j.neuron.2007.11.017. [DOI] [PubMed] [Google Scholar]
- Wang YH, Jones DR, Hall SD. Prediction of cytochrome P450 3A inhibition by verapamil enantiomers and their metabolites. Drug Metab Dispos. 2004;32:259–266. doi: 10.1124/dmd.32.2.259. [DOI] [PubMed] [Google Scholar]
- Xie R, Hammarlund-Udenaes M, de Boer AG, de Lange EC. The role of P-glycoprotein in blood-brain barrier transport of morphine: transcortical microdialysis studies in mdr1a (−/−) and mdr1a (+/+) mice. Br J Pharmacol. 1999;128:563–568. doi: 10.1038/sj.bjp.0702804. [DOI] [PMC free article] [PubMed] [Google Scholar]
- Yamazaki M, Neway WE, Ohe T, Chen I, Rowe JF, Hochman JH, et al. In vitro substrate identification studies for p-glycoprotein-mediated transport: species difference and predictability of in vivo results. J Pharmacol Exp Ther. 2001;296:723–735. [PubMed] [Google Scholar]