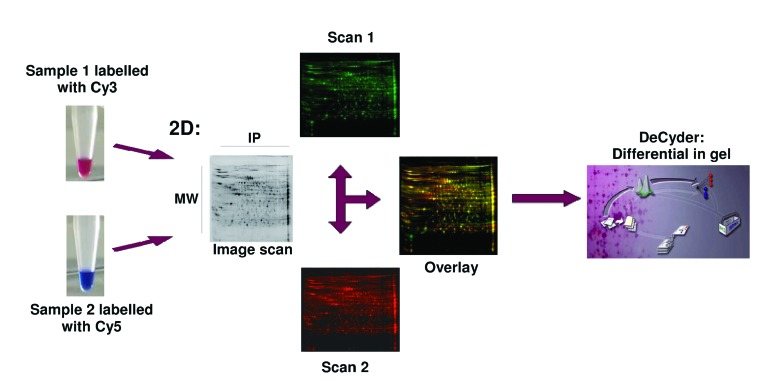
Fig. 1.
A summary of the difference gel electrophoresis (DiGE) used to compare abundance of proteins between difference proteomes. The proteins from each proteome are labelled with fluorescent dyes (for example Cy3, Cy5, Cy2) prior to two-dimensional electrophoresis. After the gel electrophoresis, the gel is scanned with the excitation wavelength of each dye one after the other. Quantitative analysis is then conducted through differential in gel analysis (DIA) with image analysis software such as DeCyder from GE Healthcare.

