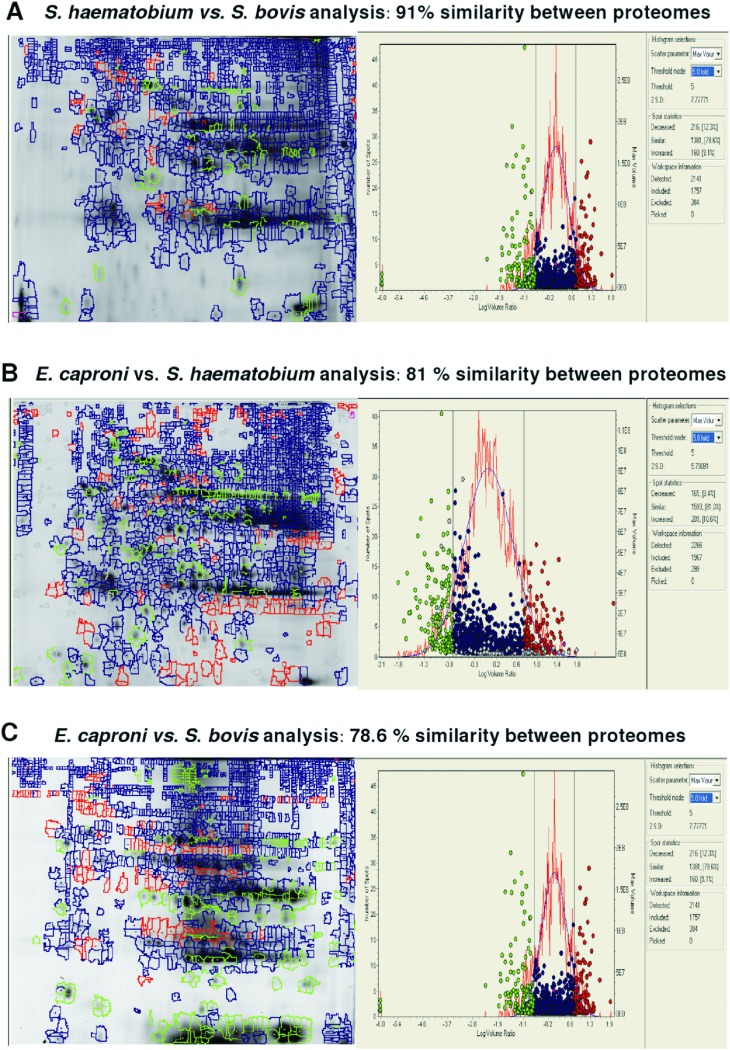
Fig. 2.
Differential in gel analysis (DIA) images for the comparison between schistosomes and the echinostsome parasites showing the different abundances of different proteins and the corresponding histogram comparing the abundance of each protein spot on the gel as well as the overall % similarity in the proteomes.
A) Comparing S. haematobium with S. bovis. Green spots=higher expression in S. haematobium; Red spots=higher expression in S. bovis; Blue spots=expression levels similar in both species.B) Comparing E. caproni with S. haematobium. Green spots=higher expression in S. haematobium; Red spots=higher expression in E. caproni; Blue spots=expression levels similar in both species.
C) Comparing E. caproni with S. bovis. Green spots=higher expression in E. caproni; Red spots=higher expression in S. bovis; Blue spots=expression levels similar in both species. Fig. adapted from Higon et al. 2011.

