

Abstract
Objective
To estimate the disease burden attributable to unsafe water and poor sanitation and hygiene in China, to identify high-burden groups and to inform improvement measures.
Methods
The disease burden attributable to unsafe water and poor sanitation and hygiene in China was estimated for diseases resulting from exposure to biologically contaminated soil and water (diarrhoeal disease, helminthiases and schistosomiasis) and vector transmission resulting from inadequate management of water resources (malaria, dengue and Japanese encephalitis). The data were obtained from China’s national infectious disease reporting system, national helminthiasis surveys and national water and sanitation surveys. The fraction of each health condition attributable to unsafe water and poor sanitation and hygiene in China was estimated from data in the Chinese and international literature.
Findings
In 2008, 327 million people in China lacked access to piped drinking water and 535 million lacked access to improved sanitation. The same year, unsafe water and poor sanitation and hygiene accounted for 2.81 million disability-adjusted life years (DALYs) and 62 800 deaths in the country, and 83% of the attributable burden was found in children less than 5 years old. Per capita DALYs increased along an east–west gradient, with the highest burden in inland provinces having the lowest income per capita.
Conclusion
Despite remarkable progress, China still needs to conduct infrastructural improvement projects targeting provinces that have experienced slower economic development. Improved monitoring, increased regulatory oversight and more government transparency are needed to better estimate the effects of microbiologically and chemically contaminated water and poor sanitation and hygiene on human health.
Résumé
Objectif
Estimer la charge de morbidité imputable à l'eau insalubre ainsi qu'à un niveau sanitaire et hygiénique déficients en Chine afin d'identifier les groupes à impact élevé et de proposer des mesures d'amélioration.
Méthodes
La charge de morbidité attribuable à l'eau insalubre et à un système d'assainissement et d'hygiène déficients en Chine a été estimée pour les maladies résultant de l'exposition aux terres et eaux biologiquement contaminées (diarrhées, helminthiases et schistosomiase), ainsi que pour la transmission vectorielle résultant d'une gestion inadéquate des ressources en eau (paludisme, dengue et encéphalite japonaise). Les données ont été obtenues grâce au registre national chinois de déclaration des maladies infectieuses, aux études nationales sur les helminthiases et aux études nationales sur l'eau et l'assainissement. Le pourcentage de chaque affection imputable aux eaux insalubres et aux carences en assainissement et hygiène en Chine a été estimé sur la base des données de publications scientifiques chinoises et internationales.
Résultats
En 2008, 327 millions de personnes en Chine n'avaient pas accès à une eau courante potable, et 535 millions de personnes ne disposaient pas de sanitaires performants. La même année, l'eau insalubre et les conditions sanitaires et hygiéniques médiocres représentaient 2,81 millions d'années de vie de maladie (DALY) et 62 800 décès dans le pays, 83% des cas concernant des enfants âgés de moins de 5 ans. Le «DALY» par habitant était croissant selon un axe est-ouest, la charge de morbidité la plus importante étant marquée dans les provinces intérieures avec le plus faible taux de revenu par habitant.
Conclusion
Malgré des progrès remarquables, la Chine a encore besoin de mener des projets d'amélioration de son infrastructure, ciblant les provinces qui ont connu un développement économique plus lent. Une amélioration du suivi, l'augmentation de la surveillance obligatoire et une plus grande transparence du gouvernement sont nécessaires pour mieux estimer les effets des contaminations microbiologiques et chimiques des eaux ainsi que des mauvaises conditions sanitaires et hygiéniques sur la santé humaine.
Resumen
Objetivo
Calcular la carga de morbilidad atribuible a la insalubridad del agua y a las deficiencias en el saneamiento e higiene en China con el fin de identificar los grupos de carga más elevada y de informar acerca de medidas de mejora.
Métodos
Se calculó la carga de morbilidad atribuible a la insalubridad del agua y a las deficiencias en el saneamiento e higiene en China para aquellas enfermedades provocadas por la exposición a suelos y aguas biológicamente contaminados (diarrea, helmintiasis y esquistosomiasis) y a la transmisión vectorial ocasionada por una gestión inadecuada de los recursos hídricos (malaria, dengue y encefalitis japonesa). Los datos se recopilaron a partir del sistema de notificación nacional sobre enfermedades infecciosas de China, las encuestas nacionales sobre helmintiasis y las encuestas nacionales sobre agua y saneamiento. A partir de los datos procedentes de la documentación china e internacional, se calculó la proporción de cada enfermedad atribuible a la insalubridad del agua y a las deficiencias en el saneamiento e higiene en China.
Resultados
En el año 2008, 327 millones de chinos no tenían acceso a agua potable canalizada y 535 millones no disponían de acceso a un saneamiento adecuado. En ese mismo año, la insalubridad del agua y las deficiencias en el saneamiento y la higiene se tradujeron en 2,81 millones de años de vida ajustados en función de la discapacidad (AVAD) y 62 800 muertes en el país. Además, el 83% de la carga atribuible se registró en niños con una edad inferior a los 5 años. Los AVAD per cápita fueron en aumento siguiendo un gradiente este-oeste y se observó la mayor carga en las provincias del interior, que contaban con los menores ingresos per cápita.
Conclusión
A pesar de los considerables esfuerzos realizados, China sigue necesitando iniciar proyectos de mejora de las infraestructuras, centrándose en aquellas provincias que han registrado un desarrollo económico más lento. Son necesarios un control mayor, un aumento de la supervisión normativa y una mayor transparencia gubernamental para calcular mejor los efectos que tienen en la salud humana las aguas contaminadas química y microbiológicamente y las deficiencias en el saneamiento y la higiene.
ملخص
الغرض
تقدير عبء المرض الذي ينسب إلى مياه الشرب غير المأمونة وسوء الإصحاح والنظافة في الصين بغية تحديد فئات العبء الثقيل والإبلاغ بتدابير تحسينها.
الطريقة
تم تقدير عبء المرض الذي ينسب إلى مياه الشرب غير المأمونة وسوء الإصحاح والنظافة في الصين بالنسبة للأمراض الناجمة عن التعرض للتربة والمياه الملوثة بيولوجياً (مرض الإسهال والعدوى الديدانية والبلهارسيات) وانتقال النواقل الناجم عن عدم كفاية التدبير العلاجي لموارد المياه (الملاريا وحمى الضنك والتهاب الدماغ الياباني). وتم الحصول على البيانات من النظام الوطني الصيني للإبلاغ عن الأمراض المعدية والاستقصاءات الوطنية للعدوى الديدانية والاستقصاءات الوطنية للمياه والإصحاح. وتم تقدير نسبة كل حالة صحية تنسب إلى مياه الشرب غير المأمونة وسوء الإصحاح والنظافة في الصين من البيانات الواردة في الأبحاث الصينية والدولية المنشورة.
النتائج
افتقر 327 مليون شخص في الصين في عام 2008 إلى الحصول على مياه الشرب التي تضخ في مواسير، كما افتقر 535 مليون شخص إلى الحصول على الإصحاح المحسن. وتنسب 2.81 مليون سنة من سنوات العمر المصححة باحتساب مدد العجز و62800 حالة وفاة في البلد إلى مياه الشرب غير المأمونة وسوء الإصحاح والنظافة خلال العام ذاته وتبين أن 83 % من العبء المنسوب لدى الأطفال أقل من 5 سنوات. وزادت سنوات العمر المصححة باحتساب مدد العجز للفرد على طول الميل من الشرق إلى الغرب مع تواجد أثقل عبء في المقاطعات الداخلية التي يحصل فيها الفرد على أدنى دخل.
الاستنتاج
برغم التقدم الملحوظ، لا تزال الصين في حاجة إلى تنفيذ مشاريع لتحسين البنية التحتية مع استهداف المقاطعات التي تعاني من تنمية اقتصادية بطيئة. ويتعين تحسين الرصد وزيادة الإشراف التنظيمي وزيادة الشفافية الحكومية بغية تقدير آثار المياه الملوثة ميكروبيولجياً وكيميائياً وسوء الإصحاح والنظافة على صحة الإنسان على نحو أفضل.
摘要
目的
估计在中国由于不安全的水和恶劣的卫生清洁条件所致疾病的负担,识别高负担群体,并告知改善措施。
方法
针对由于接触生物污染土壤和水而导致的疾病(腹泻病、蠕虫病和血吸虫病)和由于水源管理不足而导致的媒介传播的疾病(疟疾、登革热和日本脑炎),估计在中国由于不安全的水和恶劣的卫生清洁条件而导致的疾病的负担。数据来自中国国家传染病疫情报告系统、国家蠕虫病调查以及国家水和卫生设施调查。采用中国和国际文献的数据估计每种由于不安全的水和恶劣的卫生条件导致的健康状况的比重。
结果
在2008 年,中国有3.27亿人口无法使用管道饮用水,5.35亿人口缺乏改善的卫生设施。同年,全国由于不安全的水和恶劣的卫生清洁条件导致281 万残疾调整寿命年(DALY)和 6.28 万人死亡,83%的可归因负担分布在5 岁以下的儿童群体中。人均残疾调整寿命年按由东至西的梯度增加,内陆省份人均收入最低,负担最高。
结论
尽管取得了显著的进步,中国仍然需要针对经济发展较慢的省份开展基础设施改善项目。需要加强监控,增加管理监督,提高政府透明度,以便更好地估计被微生物和化学污染的水和恶劣的卫生清洁条件对人体健康的影响。
Резюме
Цель
Оценить бремя болезней, связанных с грязной водой и плохими санитарно-гигиеническими условиями Китае, чтобы определить группы, на которые ложится наиболее тяжелое бремя болезней, а также проинформировать о мерах по совершенствованию.
Методы
Бремя болезней, связанных с грязной водой и плохими санитарно-гигиеническими условиями в Китае, было оценено для заболеваний, вызванных контактом с биологически загрязненной почвой и водой (диарея, гельминтоз и шистосомоз), и векторной передачи в результате неадекватного управления водными ресурсами (малярия, лихорадка денге и японский энцефалит). Данные были получены из национальной системы информирования об инфекционных заболеваниях Китая, национальных исследований гельминтоза и национальных исследований воды и санитарии. Доля каждого заболевания, связанного с загрязненной водой и плохими санитарно-гигиеническими условиями в Китае, оценивалась на основе данных китайской и мировой литературы.
Результаты
В 2008 г. 327 млн. человек в Китае не имели доступа к водопроводной питьевой воде, а 535 млн. не имели доступа к улучшенным условиям. В том же году небезопасная вода и плохие санитарно-гигиенические условия привели к потерям в размере 2,81 млн. скорректированных на нетрудоспособность лет жизни (DALY) и стали причиной 62 800 смертей в стране, причем 83% бремени пришлось на детей младше 5 лет. Показатель DALY на душу населения увеличивался при продвижении с востока на запад, а наибольшее бремя приходилось на внутренние провинции с низким доходом на душу населения.
Вывод
Несмотря на заметный прогресс, Китай все еще нуждается в реализации инфраструктурных проектов с ориентацией на провинции, экономическое развитие в которых происходило медленнее. Необходимо улучшить систему контроля, усилить регулирующий надзор и увеличить открытость правительства, чтобы лучше оценить последствия микробиологического и химического загрязнения воды, а также плохих санитарно-гигиенических условий для здоровья человека.
Introduction
China’s rapid economic growth has brought about a shift in health priorities as infectious diseases associated with poverty are gradually displaced by chronic illnesses.1 Yet the traditional causes of illness, including infections resulting from unsafe water and poor sanitation and hygiene,2,3 still exist and are unevenly distributed across China’s diverse cultural and geographic landscape as a result of regional differences in urbanization, economic development and environmental factors.4,5 Country-wide measures of important infectious diseases2,3 conceal important regional and socioeconomic disparities that, although widely recognized in China,6,7 have been poorly documented, particularly for diseases resulting from environmental pollution.3 In light of China’s large, diverse population and the government's recent commitment to invest heavily in water infrastructure,8,9 estimates of the burden of disease attributable to unsafe water and poor sanitation and hygiene are needed at a resolution capable of capturing regional disparities. Such estimates can inform policies for targeting vulnerable populations through investments in health care and in infrastructural development.
Globally, unsafe water and poor sanitation and hygiene account for approximately 1.9 million annual deaths and 4.2% of the global burden of disease.10 Where water and sanitation facilities are inadequate, faecal contamination of drinking water and soil permits transmission of diarrhoeal pathogens and, according to prior estimates, diarrhoea accounts for the largest fraction (> 90%) of the global burden of disease attributable to unsafe water and poor sanitation.11 In addition, unsafe disposal of human waste can promote the transmission of water- and soil-transmitted helminthic infections. Poorly managed surface water resources can facilitate vector breeding and promote the transmission of vector-borne diseases such as malaria and dengue. The burden of diseases attributable to unsafe water and poor sanitation and hygiene is largely borne by the poorer members of society10,11 and the resulting health effects, including impaired child growth and reduced work capacity, are substantial and poverty-reinforcing.12
Over the past two decades, the water and sanitation infrastructure has improved dramatically in China. However, access to safe water and good sanitation varies markedly throughout the country, which suggests that some population groups bear a greater risk of disease than others. Rural residents, who represent 60% of China’s population, may be particularly vulnerable. In urban areas, piped water coverage rose from 48% in 1990 to nearly 94% in 2007.13 Access to sanitation facilities and piped water in rural areas has more than tripled since the initiation of a national campaign in the 1980s,14 yet in 2006 only 55% of 60 000 rural households surveyed across China had access to a centralized public water supply.15 Furthermore, 44% of rural water supplies did not meet minimum drinking water quality standards,15 largely on account of contamination from untreated sewage.16,17 To inform policy to further improve water and sanitation in China, we estimated the burden of eight diseases attributable to unsafe water and poor sanitation and hygiene and examined the distribution of disease burden by age, province and level of economic development.
Methods
Unsafe water and poor sanitation and hygiene can cause illness through various pathways. Drinking water can be contaminated with biological or chemical agents, soil, water or fomites can be contaminated with faeces, and, if water resources are poorly managed, they can become vector habitats. We used the comparative risk assessment (CRA) framework18 to estimate the amount of ill health in China that could be prevented by improving unclean water and sanitation facilities, promoting access to pathogen-free water supplies and reducing vector habitats. Our approach integrated exposure and disease surveillance data with a review of evidence of the impact of interventions to reduce hazardous exposures on population health. For each health outcome, we estimated the attributable fraction or proportion of disease that could be prevented through interventions to improve sanitation and water, based on a review of the literature. To ensure the suitability of our estimates for the local context, we used studies specific to China whenever possible. For example, in China, drinking hot tea may reduce the risk of diarrhoea among people exposed to unimproved drinking water sources, but tea drinking may not be accounted for in studies conducted in other regions.
We considered only interventions that were feasible, ethical and environmentally sound and sustainable, such as providing piped or treated water, installing sanitary toilets and covering or eliminating water containers around the home. No interventions that could harm ecosystems, such as destroying wetlands to reduce mosquito populations, were considered. To express health impacts across multiple diseases, we used the disability-adjusted life year (DALY), a health metric that accounts for years of life lost from early death or from disease and disability.19
Selection of health outcomes
We limited our analysis to diseases for which (i) data describing disease prevalence or incidence or population exposure at the provincial level were available from Chinese national surveillance systems, and (ii) sufficient evidence linking improvements in water and sanitation to reductions in disease incidence was available. Our estimates do not include the health impacts of contamination of water supplies with industrial chemicals and municipal discharge, agricultural run-off and naturally-occurring metals such as arsenic. These sources of contamination are of great concern in China, yet efforts to estimate the burden of disease attributable to exposure to these contaminants have been hampered by limited data and important knowledge gaps that we discuss further in Box A1 in Appendix A (available at: http://www.sph.emory.edu/eh/remais/bwho). We identified eight health outcomes that met the required criteria: diarrhoeal disease, dengue, malaria, Japanese encephalitis, schistosomiasis, ascariasis, trichuriasis and hookworm infection.
Diarrhoeal diseases
Poor sanitation and unsafe drinking water can cause diarrhoeal diseases by exposing humans to ingestion of food or water contaminated with faecal material from unclean hands and fomites. Due to difficulties in directly measuring the incidence of diarrhoeal diseases, particularly on a national scale, we used an exposure-based approach to estimate the diarrhoeal disease burden attributable to unsafe water and poor sanitation and hygiene.
We adapted exposure scenarios previously defined by Prüss et al. to estimate the global burden of diarrhoeal diseases11 to reflect China’s typical water and sanitation systems and associated pathogen loads in the environment (Table 1). We estimated the relative risk (RR) of diarrhoeal disease based on a systematic review of the Chinese literature (Table A1 in Appendix A). However, to estimate the RR associated with Scenario II (relative to Scenario I) we used estimates derived from a study conducted in the United States of America because of the small likelihood of observing Scenario I in China.20 The RR for Scenario IV, 4.5, was estimated from an intervention trial conducted in Henan.21 This estimate falls between the realistic (RR: 6.9) and conservative (RR: 3.8) global estimates for Scenario IV.11 In the same study, the incidence of diarrhoea was reduced by 12.6% when partially improved drinking water was provided in areas with improved sanitation (Scenario Va to IV), but in a similar study the reduction in incidence was 75.7%.23 We selected the more conservative estimate for its consistency with multinational studies.31,32 The RR for Scenario Vb, derived from a case-control study,22 suggests that improved sanitation has a greater effect on diarrhoea incidence than improved drinking water.31 Seven studies examined the impact of providing access to improved water or sanitation facilities where neither existed before. We selected the median estimate (RR: 11.2) and conducted sensitivity analyses using the minimum (RR: 5.2) and maximum (RR: 16.9) estimates.
Table 1. China-specific scenarios of exposure to water and sanitation facilities and associated relative risk (RR) of diarrhoea.
| Exposure scenarioa | Description | RR of diarrhoea | Reference for RR |
|---|---|---|---|
| I | There is no transmission of diarrhoeal disease from unsafe water or sanitation. | 1.0b | – |
| II | Centralized, treated drinking water is piped to each residence AND improved sanitation facilities are appropriately installed.c,d | 2.5 | Mead et al.20 |
| IIIe | – | – | – |
| IV | Drinking water is available from centralized piped systems, but treatment is incomplete or nonexistent (hence only partially improved) AND improved sanitation facilities are appropriately installed.c,d | 4.5 | Cao21 |
| Va | No improved or partially improved drinking water is available BUT improved sanitation facilities are appropriately installed.c,d | 5.2 | Cao21 |
| Vb | Partially improved drinking water is available BUT improved sanitation is not.c,d | 6.8 | Xing et al.22 |
| VI | No improved or partially improved drinking water or improved sanitation is available.c,d | 11.2 | Xing et al.,22 Cao & Zhang,23 Yang et al.,24 Luo et al,25 Gu et al.,26 Chen et al.,27 Chen et al.28 |
a For comparability, we have numbered our scenarios to indicate similarities with previous work.11
b Reference group.
c Improved sanitation includes a sewer connection (typically seen in urban areas), a triple compartment septic tank, an anaerobic biogas digester, a double barrel funnel type septic tank, and a urine-separating toilet with a septic tank. The latter four designs, found in rural areas, reduce pathogen loads through extended residence times as well as physical and chemical inactivation of pathogens, depending on soil and weather conditions.29,30 Unimproved sanitation includes unprotected stool pits and the absence of any sanitation system.
d Improved drinking water is defined as water that comes from centralized piped water systems that are treated regularly. Partially improved drinking water also comes from centralized piped water systems, but treatment is irregular or nonexistent. Untreated wells and surface water sources were classified as unimproved.
e In light of typical Chinese access to safe water and sanitation facilities, we have omitted Scenario III as previously defined by Prüss et al. (i.e. access to water and sanitation facilities with improved drinking water quality through piped water systems or point-of-use treatment or improved personal hygiene).11 Improved sanitation and piped water access are included in China-specific Scenarios IV and II, and the widespread practice of consuming hot water or tea leads to point-of-use drinking water treatment in most households.
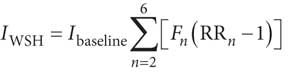
The population in each exposure scenario was estimated from the National Survey on Rural Water and Sanitation for 2006–2007 and the National health yearbook (2008).33–35 We assumed that all urban populations had access to improved sanitation and drinking water (Scenario II). We estimated the incidence of diarrhoea attributable to unsafe water and poor sanitation and hygiene (IWSH) as the diarrhoea incidence in excess of the incidence expected under Scenario 1 (Ibaseline) using the following equation11:
 |
(1) |
Where Fn is the fraction of the population exposed to Scenario n and RRn is the relative risk of diarrhoea for Scenario n (relative to Scenario I). Ibaseline was estimated from diarrhoea incidence rates in established market economies where exposure to water and sanitation is assumed to conform to Scenario II, divided by the RR of infection in exposure Scenario II (versus Scenario I).36 Deaths from diarrhoea attributable to unsafe water and poor sanitation and hygiene were estimated using China-specific case-fatality percentages and diarrhoea incidence and mortality rates derived from the Global Burden of Disease Project.36
Schistosomiasis and soil-transmitted helminthiases
The helminths Schistosoma japonicum, Ascaris lumbricoides, Trichuris trichiura, Ancylostoma duodenale and Necator americanus are excreted by human hosts in faeces. Because proper disposal of human waste should halt human exposure to the eggs of helminths, we estimate that 100% of schistosomiasis and soil-transmitted helminthiases could be avoided through the provision of improved sanitation and hygiene facilities.37 China’s National Helminth Infection Surveys, conducted in 2004, were used to estimate the prevalence of helminthiasis in 2008.38 No national interventions to control soil-transmitted helminthiases were implemented between 2004 and 2008.
Vector-borne infections
Proximate human hosts and vectors, and hence vector habitats, are required for the diseases such as malaria and dengue to be transmitted. Both factors can be impacted by water resource management. Stagnant water around the home and development projects involving water, such as large dams, can provide vector breeding grounds and increase the risk of human infection.
The mosquito vectors of malaria, dengue and Japanese encephalitis can breed in standing water near households. Based on previous work, we estimated that 42% of all cases of malaria could be prevented through interventions designed to improve water resource management.39,40 Although some authors attribute a greater proportion of the burden of malaria to environmental factors (up to 88%),41 we did not adopt these estimates because they include interventions that can harm ecosystems, such as the draining of wetlands. Dengue can be prevented almost entirely by covering or eliminating containers holding stagnant water in or around the home.42 Eliminating vector breeding sites reduces vector density, a predictor of dengue infection risk.43 In the case of Japanese encephalitis, the proximity of livestock reservoirs to irrigated areas can increase the risk of human infection.44 Intermittent irrigation of rice paddy habitats and isolation of pig rearing from such areas can reduce the risk of infection.45 On the basis of previous work, we estimated that 95% of the burden of dengue and of Japanese encephalitis is attributable to unsafe water and sanitation.39
Death and incidence rates for malaria, dengue and Japanese encephalitis in 2008 were obtained for each province from the Chinese National Infectious Disease Reporting system (NIDR). The NIDR includes 28 reportable diseases and has operated since 2004 on a real-time basis using networked computers that link the national surveillance centre, regional centres for disease control and prevention, and almost all rural and urban hospitals.2
Estimation of disease burden
DALYs19 and mortality rates were used to quantify the health impact of multiple diseases. While the comparability of DALYs across diseases is sensitive to the choice of disability weights and to disease duration, which poses a particular challenge for conditions of low severity and high prevalence,46 the integration of multiple disease outcomes into a single measure is appropriate for exposures, such as exposure to unsafe water and poor sanitation and hygiene, that can lead to different health endpoints. Age and sex-specific incidence and mortality rates (for diarrhoea and vector-borne infections) or prevalence rates (for schistosomiasis and soil-transmitted helminthiases) at the provincial level were used to calculate DALYs using established morbidity weights, disease duration, age-weighting and 3% annual discounting for delayed morbidity (Box A2 in Appendix A).19 Provincial population estimates for 2008 were obtained from the National Bureau of Statistics. Province-specific age distributions from the 2000 Chinese National Census were projected against the population of each province in 2008.
Results
In 2008, 712 million people in China (54% of the population) had access to improved drinking water, 269 million (21%) had access to partially improved drinking water and 327 million (25%) had no improved drinking water source at all. Approximately 773 million people had access to improved sanitation (59%), whereas 535 million people did not. Drinking water and sanitation access varied markedly by province, from a high of 99% coverage in Shanghai to a low of 23% in Tibet (Fig. A1 and Table A2, both in Appendix A).
Unsafe water and poor sanitation and hygiene accounted for 62 800 deaths and 2.81 million DALYs in China in 2008 (Table 2). Most (83%) of the attributable disease burden and most (97%) of the deaths occurred in young children. Diarrhoeal disease accounted for 98% of the attributable DALYs. If all provinces attained universal coverage with improved water and sanitation (Scenario II), an estimated 1.84 million DALYs and 42 000 deaths from diarrhoea alone could be prevented annually. Sensitivity analyses conducted using high and low RR estimates for Scenario VI yielded estimates of 1.83 and 3.63 million DALYs attributable to diarrhoea, respectively. When DALYs were calculated without age-weighting or without discounting future health effects, disease burden estimates nearly doubled. However, the overwhelming contribution of diarrhoea to DALYs attributable to unsafe water and poor sanitation and hygiene did not change (Table A3 in Appendix A).
Table 2. Deaths and disability-adjusted life years (DALYs) attributable to unsafe water and poor sanitation and hygiene, by disease and age group, China, 2008.
| Cases | No. (%) of deaths | No. (%) of DALYsa | |
|---|---|---|---|
| Disease | |||
| Diarrhoeal disease | 487 305 914 | 62 655 (99.7) | 2 750 874 (98.0) |
| Ascariasis | 158 587 041 | 0 (0) | 19 762 (0.7) |
| Japanese encephalitis | 3296 | 158 (0.3) | 19 743 (0.7) |
| Hookworm infection | 73 127 379 | 0 (0) | 8182 (0.3) |
| Schistosomiasis | 679 464 | 0 (0) | 5195 (0.2) |
| Trichuriasis | 55 109 540 | 0 (0) | 1844 (0.1) |
| Malaria | 10 364 | 9 (0) | 232 (0) |
| Dengue | 207 | 0 (0) | 4 (0) |
| Age (years) | |||
| 0–4 | – | 61 192 (97.4) | 2 329 712 (83.0) |
| 5–14 | – | 75 (0.1) | 103 089 (3.7) |
| 15–44 | – | 388 (0.6) | 275 440 (9.8) |
| 45–59 | – | 195 (0.3) | 64 110 (2.3) |
| 60+ | – | 971 (1.5) | 33 483 (1.2) |
| Total | – | 62 822 (100) | 2 805 835 (100) |
a DALYs are age-weighted and include 3% annual discounting.
Note: The estimates are based on data from the Chinese National Infectious Disease Reporting system, China’s National Helminth Infection Surveys, China’s National Survey on Rural Water and Sanitation, the Chinese Census and the Global Burden of Disease Project. Estimates of the fraction of each disease attributable to unsafe water and poor sanitation are based on a detailed review of the Chinese and international literature.
Collectively, soil-transmitted helminthiases were the second leading cause of attributable DALYs: an estimated 287 million such infections occurred in China in 2008, and they accounted for 29 800 DALYs. Vector-borne diseases were less common than diarrhoeal diseases and soil-transmitted helminthiases. However, the disease burden attributable to Japanese encephalitis is high because of the high case-fatality rate and the long-term sequelae of the infection.
The distributions of total and disease-specific DALYs attributable to unsafe water and poor sanitation and hygiene showed substantial geographical and socioeconomic disparities (Table A4 and Table A5, both in Appendix A; Fig. 1). DALYs by province ranged from 46 to 522 per 100 000 people (in Shanghai and Tibet, respectively) and were highest in provinces with the lowest per capita GDP (Table 3, and Fig. A2 in Appendix A). The burden of diarrhoeal disease attributable to unsafe water and poor sanitation increased from east to west, generally following the gradient of economic development and infrastructural investment in China. Vector-borne infections were more focally distributed. They were found primarily in southwestern provinces and, to a lesser extent, in the southeastern and central regions. DALYs caused by helminthiases were concentrated in southwestern and central China and on the southern island of Hainan. The disease burden from vector-borne and helminthic infections was lowest in the northern provinces.
Fig. 1.
The distribution of disability-adjusted life years (DALYs) attributable to unsafe water and poor sanitation and hygiene, by province, China, 2008
Note: Vector-borne infections include dengue, malaria and Japanese encephalitis. Helminthiases include ascariasis, hookworm infection, trichuriasis and schistosomiasis.

Table 3. The distribution of deaths and disability-adjusted life years (DALYs) attributable to unsafe water and poor sanitation and hygiene among Chinese provinces, 2008.
| Province | Population | Provincial GDP | Total | Diarrhoeal diseases | Vector-borne infectionsa | Helminthiasesb | |||||||
|---|---|---|---|---|---|---|---|---|---|---|---|---|---|
| Deathsc | DALYsc,d | Deathsc | DALYsc,d | Deathsc | DALYsc,d | Deathsc | DALYsc,d | ||||||
| Tibet | 2 870 000 | 13 824 | 12.70 | 522 | 12.67 | 520 | 0.03 | 1.49 | 0.00 | 0.86 | |||
| Guizhou | 37 927 300 | 9428 | 9.67 | 416 | 9.59 | 397 | 0.09 | 7.99 | 0.00 | 10.51 | |||
| Ningxia | 6 176 900 | 19 609 | 8.73 | 366 | 8.73 | 366 | 0.00 | 0.00 | 0.00 | 0.69 | |||
| Yunnan | 45 430 000 | 12 570 | 8.60 | 365 | 8.55 | 359 | 0.05 | 5.07 | 0.00 | 1.03 | |||
| Gansu | 26 281 200 | 12 110 | 7.17 | 313 | 7.17 | 311 | 0.00 | 1.05 | 0.00 | 0.56 | |||
| Jiangxi | 44 000 000 | 15 900 | 6.80 | 298 | 6.79 | 294 | 0.01 | 0.85 | 0.00 | 2.18 | |||
| Qinghai | 5 543 000 | 18 421 | 6.98 | 295 | 6.98 | 294 | 0.00 | 0.00 | 0.00 | 0.63 | |||
| Xinjiang | 21 308 000 | 19 797 | 6.79 | 288 | 6.79 | 288 | 0.00 | 0.02 | 0.00 | 0.59 | |||
| Sichuan | 81 380 000 | 15 495 | 6.31 | 286 | 6.27 | 272 | 0.04 | 4.64 | 0.00 | 8.83 | |||
| Anhui | 61 350 000 | 14 447 | 5.84 | 262 | 5.83 | 258 | 0.01 | 2.38 | 0.00 | 1.30 | |||
| Shanxi | 34 106 100 | 21 506 | 6.09 | 261 | 6.08 | 261 | 0.01 | 0.22 | 0.00 | 0.55 | |||
| Hainan | 8 540 000 | 17 691 | 4.44 | 248 | 4.43 | 192 | 0.01 | 2.08 | 0.00 | 54.16 | |||
| Henan | 94 290 000 | 19 181 | 5.55 | 247 | 5.53 | 244 | 0.02 | 2.13 | 0.00 | 0.45 | |||
| Guangxi | 48 160 000 | 14 652 | 5.62 | 246 | 5.60 | 243 | 0.01 | 1.89 | 0.00 | 0.50 | |||
| Hunan | 63 800 000 | 18 147 | 5.09 | 239 | 5.08 | 228 | 0.01 | 1.33 | 0.00 | 10.03 | |||
| Inner Mongolia | 24 137 300 | 35 263 | 4.79 | 214 | 4.79 | 214 | 0.00 | 0.01 | 0.00 | 0.38 | |||
| Hebei | 69 888 200 | 22 986 | 4.82 | 213 | 4.82 | 212 | 0.00 | 0.14 | 0.00 | 0.39 | |||
| Chongqing | 28 390 000 | 20 490 | 4.73 | 212 | 4.70 | 205 | 0.03 | 6.62 | 0.00 | 0.44 | |||
| Shaan'xi | 37 620 000 | 19 480 | 4.68 | 211 | 4.67 | 210 | 0.00 | 0.50 | 0.00 | 0.44 | |||
| Hubei | 57 110 000 | 19 858 | 3.86 | 193 | 3.85 | 181 | 0.01 | 0.56 | 0.00 | 11.88 | |||
| Shandong | 94 172 300 | 32 936 | 4.10 | 181 | 4.09 | 180 | 0.01 | 0.60 | 0.00 | 0.34 | |||
| Jilin | 27 340 000 | 23 521 | 3.52 | 163 | 3.52 | 163 | 0.00 | 0.03 | 0.00 | 0.31 | |||
| Heilongjiang | 38 253 900 | 21 740 | 3.49 | 160 | 3.49 | 160 | 0.00 | 0.00 | 0.00 | 0.32 | |||
| Liaoning | 43 147 000 | 31 736 | 3.34 | 153 | 3.34 | 153 | 0.00 | 0.00 | 0.00 | 0.31 | |||
| Fujian | 36 040 000 | 30 122 | 3.12 | 142 | 3.11 | 141 | 0.01 | 0.67 | 0.00 | 0.39 | |||
| Guangdong | 95 440 000 | 38 748 | 3.15 | 139 | 3.15 | 138 | 0.00 | 0.58 | 0.00 | 0.52 | |||
| Zhejiang | 51 200 000 | 42 166 | 2.63 | 118 | 2.63 | 117 | 0.01 | 0.66 | 0.00 | 0.34 | |||
| Jiangsu | 76 773 000 | 40 497 | 2.31 | 107 | 2.30 | 106 | 0.01 | 0.55 | 0.00 | 0.40 | |||
| Tianjin | 11 760 000 | 58 656 | 1.68 | 78 | 1.67 | 77 | 0.01 | 0.12 | 0.00 | 0.28 | |||
| Beijing | 16 950 000 | 66 797 | 1.24 | 59 | 1.24 | 59 | 0.00 | 0.02 | 0.00 | 0.24 | |||
| Shanghai | 18 884 600 | 75 109 | 0.95 | 46 | 0.95 | 45 | 0.00 | 0.25 | 0.00 | 0.22 | |||
GDP, gross domestic product.
a Vector-borne infections include dengue, malaria and Japanese encephalitis.
b The helminthiases include ascariasis, hookworm infection, trichuriasis and schistosomiasis.
c Per 100 000 population.
d DALYs are age-weighted and include 3% annual discounting.
Note: The estimates are based on data from the Chinese National Infectious Disease Reporting system, China’s National Helminth Infection Surveys, China’s National Survey on Rural Water and Sanitation, the Chinese Census and the Global Burden of Disease Project. Estimates of the fraction of each disease attributable to unsafe water and poor sanitation are based on a detailed review of the Chinese and international literature.
Discussion
The deaths and DALYs reported in this paper are the first estimates of the health impacts of unsafe water and poor sanitation and hygiene in China to capture within-country heterogeneity in disease burden. We found unsafe water and poor sanitation and hygiene to be particularly detrimental to the health of young children, as they account for 61 200 deaths and 2.33 million DALYs in children under five, predominantly attributable to diarrhoeal diseases. Geographically, the disease burden attributable to unsafe water and poor sanitation and hygiene is concentrated in China’s poorest, inland provinces.
While the burden of diarrhoeal diseases attributable to unsafe water and poor sanitation increased along an east–west gradient, the burden of helminthiases was clustered in Guizhou and Sichuan in the south-west, Hubei and Hunan in central China, and Hainan in the south. The transmission of schistosomiasis and soil-transmitted helminthiases is facilitated by the temperature and ecological conditions that prevail in these warm, low-lying provinces.47 The greatest per capita burden of soil-transmitted helminthiasis occurred in Hainan, where 59.4% of residents and 73.4% of school children were found to be infected with at least one soil-transmitted helminth in 2004.48
Vector-borne infections composed a relatively small fraction of the total DALYs attributable to unsafe water and poor sanitation and hygiene, but Japanese encephalitis was the third leading source of such DALYs. Notably, Japanese encephalitis is a vaccine-preventable disease. Widespread vaccination began in China in the 1980s and over 300 million people have been immunized since 1990.49 This has resulted in steady declines in the annual incidence of Japanese encephalitis, from a high of 20.92 cases per 100 000 during the epidemic of 1970 to less than one case per 100 000 since 1996.50 Before 2006, vaccination was not equally accessible across regions; poor regions offered fee-for-service vaccination, and wealthier regions provided it free. As a result, children in poorer regions had the lowest vaccination coverage,51 and these regions show the highest incidence of Japanese encephalitis in our analysis. China is now integrating vaccination against Japanese encephalitis into the country’s free, routine immunization programme to improve coverage in rural and underdeveloped areas.49 Coupled with improved management of water resources, this policy change could substantially reduce the burden of Japanese encephalitis in China.
Access to improved water and sanitation has been a national priority within China’s rural development projects since the 1980s. During each five-year planning phase, the Ministry of Health, the Ministry of Construction, the Bureau of Environmental Protection and the Ministry of Agriculture convene a steering meeting to set goals and strategies for improving water and sanitation over the ensuing five-year period. Most recently, China's 12th five-year plan emphasized the importance of safe water and good sanitation and hygiene in promoting rural modernization, and the Ministry of Health has set a goal to achieve 68% coverage for both water and sanitation by 2011 in rural areas.52 To help achieve these targets, China will expand its nationwide surveillance (e.g. water quality testing and human health monitoring) and step up enforcement of drinking water safety in both urban and rural areas. As of 2011, the national drinking water surveillance system included more than 20 000 surveillance points, and these are expected to increase substantially under the twelfth five-year plan. What is more, the plan includes an investment of 27 billion United States dollars (US$) in improving drinking water access in rural areas as part of the National Project for Rural Drinking Water Safety. This reflects a nearly US$ 16 billion increase relative to the previous five-year plan. Central and western parts of the country have been identified as priority areas where these investments should be accompanied by expanded sanitation coverage as well (e.g. improved sanitation facilities at the household level). Technical support and evaluation of these efforts are available from China's National Centre for Rural Water Supply Technical Guidance, which has helped to establish a national rural water quality and human health monitoring network as well as a sanitation evaluation programme.52,53 These efforts to ensure effective implementation of water and sanitation improvement programmes and to monitor drinking water quality should make it possible to achieve China's most recent targets and could yield significant reductions in diseases attributable to unsafe water and poor sanitation and hygiene. Our estimates of the burden of such diseases offer a baseline against which to assess the impact of future improvements.
We caution that the true toll of unsafe water and poor sanitation and hygiene in China extends beyond the human health impacts presented here. Biological and chemical pollution of water resources can lead to ecological degradation54 and, in the water-scarce north, pollution can exacerbate the health impacts of water shortages by forcing populations to rely on contaminated supplies.3 Chemical contamination of drinking water can lead to malignancies and other sequelae not accounted for in this analysis,3 and many such health endpoints attributable to unsafe water and poor sanitation and hygiene are associated with substantial economic costs from lost productivity, impaired cognitive development and other effects.55 Diarrhoeal diseases attributable to unsafe water and poor sanitation and hygiene can trigger a cascade of ill health which can in turn lead to malnutrition and make young children vulnerable to major childhood diseases, including measles and pneumonia. As much as 29% of the global burden of disease attributable to unsafe water and poor sanitation and hygiene is probably due to the secondary health effects of diarrhoea.55 Finally, unsafe water and poor sanitation can facilitate transmission of other parasitic infections whose distributions have not been well documented. For example, the foodborne trematode Clonorchis sinensis, which causes cholangiocarcinoma and infects an estimated 15 million people in China, is transmitted through unsafe human waste disposal.56
The number of people without access to safe drinking water in China, and the associated disease burden, may exceed our estimates, as we have assumed that urban piped water systems are regularly treated. A 2006 survey of several thousand urban water suppliers revealed that 28% of municipal plants and 53% of private plants were not complying with water quality monitoring requirements. Over 15% of water samples did not meet drinking water standards, most often on account of microbial parameters.57 Transparent monitoring of municipal water systems is needed to ensure compliance with water quality standards and identify areas in need of long-term remediation and short-term public health advisories.
Globally, efforts to increase access to safe water and sanitation facilities have been frustratingly slow.58 In contrast, China has dramatically increased access to safe water and sanitation facilities over the past two decades. Our findings indicate the need for further work to increase access to improved water and sanitation and reduce disparities in the disease burden attributable to poor sanitation and unsafe water supplies. Investment in water and sanitation infrastructure is needed most urgently in western Chinese provinces with a high disease burden. Future improvements to water and sanitation should be accompanied by periodic estimates of the burden of disease attributable to unsafe water and poor sanitation to track progress in reducing these preventable diseases and identify populations that remain at risk of death and disability from unsafe water and poor sanitation and hygiene. The disease burden estimates provided in this paper can guide the allocation of resources for improving water and sanitation facilities as well as provide a basis for establishing milestones for incremental infrastructural improvements.
Acknowledgements
When this study was conducted, SL was affiliated with the College of Public Health of Ohio State University.
Funding:
This work was supported in part by the National Institute for Allergy and Infectious Diseases (grant nos. R01AI068854 and K01AI091864) and the NIH/NSF Ecology of Infectious Disease Program (grant no. 0622743). Elizabeth Carlton is additionally supported by an American Recovery and Reinvestment Act supplement (R01AI068854-04S1). Justin Remais is also supported by the Emory Global Health Institute Faculty Distinction Fund. Song Liang received additional support from the International Gateway Research Grant sponsored by the Office of International Affairs (OIA) and from the Public Health Preparedness for Infectious Diseases (PHPID) programme of the Ohio State University. Wei Luo is supported in part by a grant from the Chinese National Basic Research Programme (2008CB418106).
Competing interests:
None declared.
References
- 1.Wang L, Kong L, Wu F, Bai Y, Burton R. Preventing chronic diseases in China. Lancet. 2005;366:1821–4. doi: 10.1016/S0140-6736(05)67344-8. [DOI] [PubMed] [Google Scholar]
- 2.Wang L, Wang Y, Jin S, Wu Z, Chin DP, Koplan JP, et al. Emergence and control of infectious diseases in China. Lancet. 2008;372:1598–605. doi: 10.1016/S0140-6736(08)61365-3. [DOI] [PMC free article] [PubMed] [Google Scholar]
- 3.Zhang J, Mauzerall DL, Zhu T, Liang S, Ezzati M, Remais JV. Environmental health in China: progress towards clean air and safe water. Lancet. 2010;375:1110–9. doi: 10.1016/S0140-6736(10)60062-1. [DOI] [PMC free article] [PubMed] [Google Scholar]
- 4.Cook IG, Dummer TJB. Changing health in China: re-evaluating the epidemiological transition model. Health Policy. 2004;67:329–43. doi: 10.1016/j.healthpol.2003.07.005. [DOI] [PMC free article] [PubMed] [Google Scholar]
- 5.Fang P, Dong S, Xiao J, Liu C, Feng X, Wang Y. Regional inequality in health and its determinants: evidence from China. Health Policy. 2010;94:14–25. doi: 10.1016/j.healthpol.2009.08.002. [DOI] [PubMed] [Google Scholar]
- 6.Blumenthal D, Hsiao W. Privatization and its discontents–the evolving Chinese health care system. N Engl J Med. 2005;353:1165–70. doi: 10.1056/NEJMhpr051133. [DOI] [PubMed] [Google Scholar]
- 7.Chan EY, Griffiths S, Gao Y, Chan CW, Fok TF. Addressing disparities in children’s health in China. Arch Dis Child. 2008;93:346–52. doi: 10.1136/adc.2007.130146. [DOI] [PubMed] [Google Scholar]
- 8.Yu C. China’s water crisis needs more than words. Nature. 2011;470:307. doi: 10.1038/470307a. [DOI] [PubMed] [Google Scholar]
- 9.Gong P, Yin Y, Yu C. China: invest wisely in sustainable water use. Science. 2011;331:1264–5. doi: 10.1126/science.331.6022.1264-b. [DOI] [PubMed] [Google Scholar]
- 10.Global health risks: mortality and burden of disease attributable to selected major risks. Geneva: World Health Organization; 2009. [Google Scholar]
- 11.Prüss A, Kay D, Fewtrell L, Bartram J. Estimating the burden of disease from water, sanitation, and hygiene at a global level. Environ Health Perspect. 2002;110:537–42. doi: 10.1289/ehp.02110537. [DOI] [PMC free article] [PubMed] [Google Scholar]
- 12.Hotez PJ, Fenwick A, Savioli L, Molyneux DH. Rescuing the bottom billion through control of neglected tropical diseases. Lancet. 2009;373:1570–5. doi: 10.1016/S0140-6736(09)60233-6. [DOI] [PubMed] [Google Scholar]
- 13.National Bureau of Statistics. Chinese national statistical yearbook, 2007 and 2008 Beijing: China Statistics Press; 2008. [Google Scholar]
- 14.Luo P, Ye L. Analyses and strategies of drinking water quality in rural areas. Gong Gong Wei Sheng Yu Yu Fang Yi Xue. 2005;16:49–51. [Chinese.] [Google Scholar]
- 15.Zhang R, Li HX, Wu XF, Fan F, Sun B, Wang Z, et al. Current situation analysis on China's rural drinking water quality. Huan Jing Yu Jian Kang Za Zhi. 2009;26:3–5. [Chinese.] [Google Scholar]
- 16.Lu H. Analysis on pollution factors and countermeasures of drinking water sources in rural areas Beijing: China Environmental Protection Industry; 2009. [Google Scholar]
- 17.Zhong QY, Liu J, Huang Z. Investigation of rural water quality and prevention of contamination. Shui Xi Wu Ran Yu Bao Hu. 2001;2:6–8. [Chinese.] [Google Scholar]
- 18.Ezzati M, Lopez AD, Rogers A, Murray CLJ, editors. Comparative quantification of health risks: global and regional burden of disease attributable to selected major risk factors Geneva: World Health Organization; 2004. [Google Scholar]
- 19.Murray CLJ, Lopez AD, editors. The global burden of disease: a comprehensive assessment of mortality and disability from diseases, injuries, and risk factors in 1990 and projected to 2020 Cambridge: Harvard University Press; 1996. [Google Scholar]
- 20.Mead PS, Slutsker L, Dietz V, McCaig LF, Bresee JS, Shapiro C, et al. Food-related illness and death in the United States. Emerg Infect Dis. 1999;5:607–25. doi: 10.3201/eid0505.990502. [DOI] [PMC free article] [PubMed] [Google Scholar]
- 21.Cao D. Relationship between diarrhea and improved water supply and sanitation, and a cost-benefit analysis in Henan Province [Master’s thesis]. Beijing: Centre for Disease Control and Prevention; 2008. [Google Scholar]
- 22.Xing L, Si MX, Wang JR. Investigation of diarrhoea prevention and control. Zhi Ye Yu Jian Kang. 2002;18:87–8. [Chinese.] [Google Scholar]
- 23.Cao D, Zhang R. Effects of improved access to water and sanitation on the control of diarrhea in rural environment. Chin Rural Health Serv Admin. 2007;26:466–7. [Chinese.] [Google Scholar]
- 24.Yang Y, Xiao JF, Nie HZ, Tan KT, Zang SQ, Zhou SY, et al. Disease prevention effect of improvement of latrines in rural areas in Hunan Province. Huan Jing Yu Jian Kang Za Zhi. 2005;22:125–7. [Chinese.] [Google Scholar]
- 25.Luo JY, Tang MD, Gao ZX. Analysis of society benefit by changing the water in the villages of Hunan Province. Huan Jing Yu Jian Kang Za Zhi. 1995;12:200–2. [Chinese.] [Google Scholar]
- 26.Gu XM, Zhao H, Song XX, Zhang QJ. Relationships between improved drinking water supply and intestinal infectious diseases in rural areas of Kashi District of Xinjiang. Huan Jing Yu Jian Kang Za Zhi. 2000;17:34–6. [Chinese.] [Google Scholar]
- 27.Chen L, Tang MD, Gao ZX. The environmental epidemiological investigation on the water change in six counties of Hunan Province. Zhong Guo Gong Gong Wei Sheng. 1995;11:22–4. [Chinese.] [Google Scholar]
- 28.Chen XD, Lin P, Cheng MH. Research of the effect of rebuilding deep well into simple centralized water supply to guard against diarrhea in Huaibei. Jiangsu Weisheng Bao Jian. 1999;1:16–9. [Chinese.] [Google Scholar]
- 29.Remais J, Chen L, Seto E. Leveraging rural energy investment for parasitic disease control: schistosome ova inactivation and energy co-benefits of anaerobic digesters in rural China. PLoS ONE. 2009;4:e4856. doi: 10.1371/journal.pone.0004856. [DOI] [PMC free article] [PubMed] [Google Scholar]
- 30.China rural sanitary latrine technology guidelines Beijing: National Center for Rural Water Supply; 2003. [Chinese.] Available from: http://www.crwstc.org/html/chubanwu/ [accessed 1 April 2012].
- 31.Esrey SA, Potash JB, Roberts L, Shiff C. Effects of improved water supply and sanitation on ascariasis, diarrhoea, dracunculiasis, hookworm infection, schistosomiasis, and trachoma. Bull World Health Organ. 1991;69:609–21. [PMC free article] [PubMed] [Google Scholar]
- 32.Fewtrell L, Kaufmann RB, Kay D, Enanoria W, Haller L, Colford JM., Jr Water, sanitation, and hygiene interventions to reduce diarrhoea in less developed countries: a systematic review and meta-analysis. Lancet Infect Dis. 2005;5:42–52. doi: 10.1016/S1473-3099(04)01253-8. [DOI] [PubMed] [Google Scholar]
- 33.2008 health yearbook Beijing: Ministry of Health of the People’s Republic of China; 2008. [Google Scholar]
- 34.Yao W, Qu X, Li H, Fu Y. Investigation of latrine improvment and excreta utilization in rural areas, China. Huan Jing Yu Jian Kang Za Zhi. 2009;26:12–4. [Chinese.] [Google Scholar]
- 35.Zhao Y, Yao W, Li H, Tao Y. Influencing factors for rural drinking water and sanitation. Huan Jing Yu Jian Kang Za Zhi. 2009;26:8–9. [Chinese.] [Google Scholar]
- 36.The global burden of disease: 2004 update Geneva: World Health Organization; 2008. [Google Scholar]
- 37.Prüss-Ustün A, Corvalán C. How much disease burden can be prevented by environmental interventions? Epidemiology. 2007;18:167–78. doi: 10.1097/01.ede.0000239647.26389.80. [DOI] [PubMed] [Google Scholar]
- 38.Zhou XN, Guo JG, Wu XH, Jiang QW, Zheng J, Dang H, et al. Epidemiology of schistosomiasis in the People’s Republic of China, 2004. Emerg Infect Dis. 2007;13:1470–6. doi: 10.3201/eid1310.061423. [DOI] [PMC free article] [PubMed] [Google Scholar]
- 39.Pruss-Ustun A, Corvalan C. Preventing disease through healthy environments: towards an estimate of the environmental burden of disease. Geneva: World Health Organization; 2006. [Google Scholar]
- 40.Fewtrell L, Pruss-Ustun A, Bos R, Gore F, Bartram J. Water, sanitation and hygiene: quantifying the health impact at national and local levels in countries with incomplete water supply and sanitation coverage Geneva: World Health Organization; 2007. [Google Scholar]
- 41.Keiser J, Singer BH, Utzinger J.Reducing the burden of malaria in different eco-epidemiological settings with environmental management: a systematic review. Lancet Infect Dis 20055695–708.doi:10.1016/S1473-3099(05)70268-1PMID: 16253887 [DOI] [PubMed] [Google Scholar]
- 42.Erlanger TE, Keiser J, Utzinger J. Effect of dengue vector control interventions on entomological parameters in developing countries: a systematic review and meta-analysis. Med Vet Entomol. 2008;22:203–21. doi: 10.1111/j.1365-2915.2008.00740.x. [DOI] [PubMed] [Google Scholar]
- 43.Sanchez L, Vanlerberghe V, Alfonso L, Marquetti MC, Guzman MG, Bisset J, et al. Aedes aegypti larval indices and risk for dengue epidemics. Emerg Infect Dis. 2006;12:800–6. doi: 10.3201/eid1205.050866. [DOI] [PMC free article] [PubMed] [Google Scholar]
- 44.Erlanger TE, Weiss S, Keiser J, Utzinger J, Wiedenmayer K. Past, present, and future of Japanese encephalitis. Emerg Infect Dis. 2009;15:1–7. doi: 10.3201/eid1501.080311. [DOI] [PMC free article] [PubMed] [Google Scholar]
- 45.Keiser J, Maltese MF, Erlanger TE, Bos R, Tanner M, Singer BH, et al. Effect of irrigated rice agriculture on Japanese encephalitis, including challenges and opportunities for integrated vector management. Acta Trop. 2005;95:40–57. doi: 10.1016/j.actatropica.2005.04.012. [DOI] [PubMed] [Google Scholar]
- 46.Mathers CD, Ezzati M, Lopez AD. Measuring the burden of neglected tropical diseases: the global burden of disease framework. PLoS Negl Trop Dis. 2007;1:e114. doi: 10.1371/journal.pntd.0000114. [DOI] [PMC free article] [PubMed] [Google Scholar]
- 47.Brooker S, Clements AC, Bundy DA. Global epidemiology, ecology and control of soil-transmitted helminth infections. Adv Parasitol. 2006;62:221–61. doi: 10.1016/S0065-308X(05)62007-6. [DOI] [PMC free article] [PubMed] [Google Scholar]
- 48.Report on the National Survey of Current Status of Major Parasitic Diseases in China Beijing: Ministry of Health Bureau of Disease Prevention and Control, Chinese Center for Disease Control and Prevention, National Institute of Parasitic Disease Control and Prevention; 2008. [Google Scholar]
- 49.Wang H, Li Y, Liang X, Liang G. Japanese encephalitis in mainland china. Jpn J Infect Dis. 2009;62:331–6. [PubMed] [Google Scholar]
- 50.Yin Z, Wang H, Yang J, Luo H, Li Y, Hadler SC, et al. Acute Meningitis and Encephalitis Syndrome (AMES) Study Group Japanese encephalitis disease burden and clinical features of Japanese encephalitis in four cities in the People’s Republic of China. Am J Trop Med Hyg. 2010;83:766–73. doi: 10.4269/ajtmh.2010.09-0748. [DOI] [PMC free article] [PubMed] [Google Scholar]
- 51.Liu W, Clemens JD, Yang JY, Xu ZY. Immunization against Japanese encephalitis in China: a policy analysis. Vaccine. 2006;24:5178–82. doi: 10.1016/j.vaccine.2006.04.006. [DOI] [PubMed] [Google Scholar]
- 52.Management plans for improving water and sanitation facilities in rural areas (2009, 2010) Beijing: Ministry of Health of the People’s Republic of China; 2010. [Google Scholar]
- 53.Technical protocol for national surveillance of rural drinking water and health Beijing; National Patriotic Health Committee; 2010. [Google Scholar]
- 54.Cost of pollution in China: economic estimates of physical damages Washington: The World Bank; 2007. [Google Scholar]
- 55.Bartram J, Cairncross S. Hygiene, sanitation, and water: forgotten foundations of health. PLoS Med. 2010;7:e1000367. doi: 10.1371/journal.pmed.1000367. [DOI] [PMC free article] [PubMed] [Google Scholar]
- 56.Keiser J, Utzinger J. Food-borne trematodiases. Clin Microbiol Rev. 2009;22:466–83. doi: 10.1128/CMR.00012-09. [DOI] [PMC free article] [PubMed] [Google Scholar]
- 57.Zhang L. Investigation on drinking water safety in China in 2006. Huan Jing Yu Jian Kang Za Zhi. 2007;24:595–7. [Chinese.] [Google Scholar]
- 58.Hunter PR, MacDonald AM, Carter RC. Water supply and health. PLoS Med. 2010;7:e1000361. doi: 10.1371/journal.pmed.1000361. [DOI] [PMC free article] [PubMed] [Google Scholar]