Abstract
Neutrino oscillation was discovered through studies of neutrinos produced by cosmic-ray interactions in the atmosphere. These neutrinos are called atmospheric neutrinos. They are produced as decay products in hadronic showers resulting from collisions of cosmic rays with nuclei in the atmosphere. Electron-neutrinos and muon-neutrinos are produced mainly by the decay chain of charged pions to muons to electrons. Atmospheric neutrino experiments observed zenith-angle and energy dependent deficit of muon-neutrino events. Neutrino oscillations between muon-neutrinos and tau-neutrinos explain these data well. Neutrino oscillations imply that neutrinos have small but non-zero masses. The small neutrino masses have profound implications to our understanding of elementary particle physics and the Universe. This article discusses the experimental discovery of neutrino oscillations.
Keywords: neutrino, neutrino oscillation, atmospheric neutrino, cosmic ray
1. Introduction
Neutrino is a particle introduced by W. Pauli in 19301) in order to secure the energy, momentum and spin conservations in the nuclear beta decays. Neutrinos are one of the most abundant particles in the Universe. They, however, are very difficult to observe. They have no electric charge; hence they do not interact via the electro-magnetic force. Likewise, they do not interact via the strong nuclear force, by which nucleons are bound to a nucleus. Neutrinos only interact via the weak force, which is indeed very weak. The consequence is significant. If a neutrino is produced, it travels straightly in any matter as if it is traveling in the vacuum. It seldom interacts with matter. For example, a neutrino produced in the Earth’s atmosphere can easily travel through the whole Earth.
Since it has been extremely difficult to study neutrinos, details of the properties of neutrinos have not been known. A remarkable feature of neutrinos is their masses. As an example, we consider a beta decay of a tritium, i.e., 3H. A 3H decays to a 3He, an e−, and an anti-electron-neutrino (ν̄e). If the mass of the neutrino is heavy, one expects that the maximum energy of the observed electron is lower than the case of a mass-less neutrino. All the experiments, which observed the energy spectrum of the electrons very accurately, showed that the mass of the neutrino is consistent with zero within the experimental accuracies. These results suggested that neutrinos could be mass-less. Indeed, the standard model of elementary particle physics has been formulated assuming that the masses of the neutrinos are exactly zero. This theory has been extraordinary successful in explaining all the existing data from recent particle physics experiments that have been carried out using high energy accelerators.
On the other hand, it has also been recognized that there is no strong theoretical reason that postulates vanishing neutrino mass. In fact, it has been recognized that the small but finite neutrino masses can be understood naturally by the See-Saw mechanism2)–4) by introducing super-heavy neutral particles. Therefore, there have been continuing experimental activities to search for non-zero neutrino masses. One of the methods to search for non-zero neutrino masses is to study neutrino oscillations. Neutrino oscillation is a phenomenon that a neutrino produced in a definite type to be observed in a different type after traveling some distances. It is possible that a type of neutrino does not have a unique mass. Instead, it is generally possible that a type of neutrino is a mixture of several (probably three) mass states with definite masses. In this case, neutrino oscillations occur. For simplicity, let us discuss neutrino oscillations between two types of neutrinos. In neutrino oscillations, the original type of neutrino (for example, νμ) changes to a different neutrino type (for example, ντ) after traveling some distances.5),6) After further traveling, the type of the neutrino becomes the original one (in this example, νμ). This way, the type of the neutrino oscillates, and therefore this phenomenon is called neutrino oscillations. The probability that a neutrino of an original type to be observed in a different type after traveling a distance of L with the energy of Eν is a function of the neutrino mass, or more exactly the difference of the neutrino masses squared (Δm2), namely mνj2 − mνi2, where mνi and mνj are masses of i-th and j-th mass states of definite masses. Therefore, by measuring the neutrino oscillation probability as a function of the neutrino flight length or the neutrino energy, it is possible to get information on the neutrino masses.
The fraction of the ν2 and ν3 components in νμ is expressed by introducing a “mixing angle θ”. If νμ is composed of ν2 only, the mixing angle θ is 0 degree. If νμ is composed of ν2 and ν3 with an equal fraction, the mixing angle θ is 45 degrees. Assuming the neutrino oscillation is purely between νμ and ντ, the probability of a νμ survived as a νμ after traveling some distance L is expressed as;
| [1] |
The disappeared νμ is oscillated to ντ.
Motivated by the prediction of neutrino oscillations and by the importance for the neutrino masses, there were many neutrino oscillation experiments starting around the 1980’s. Most of them used neutrinos produced by accelerators or reactors. No convincing evidence for neutrino oscillations was discovered. These accelerator experiments typically had the neutrino energy around 1 GeV and the neutrino flight length of about 1 km. The reactor experiments have the typical neutrino flight length of less than 100 m and the typical neutrino energy of a few MeV. Therefore these experiments had the typical sensitivity in Δm2 larger than 0.1 to 1 eV2.
Eq. [1] indicates that, if one intends to measure small neutrino masses, one need to observe neutrinos that travel long distances. One such example is neutrinos that are generated by cosmic-ray interactions in the atmosphere. The flight length of the neutrinos ranges up to 12,700 km, the diameter of the Earth. Indeed, the small neutrino mass was discovered by the study of these neutrinos: In June 1998, at the 18th International Conference on Neutrino Physics and Astrophysics (Neutrino’98) held in Takayama, Japan, about 400 neutrino physicists heard that data from an underground neutrino detector, Super-Kamiokande, showed evidence for oscillation of atmospheric neutrinos.7),8) In the following sections, the history of the neutrino oscillation discovery and the subsequent developments are described.
2. Atmospheric neutrinos
Cosmic rays are a radiation of high energy particles arriving at the Earth from the Universe. In the GeV/nucleon energy region, these cosmic-ray particles are mostly protons, about 5% are Helium nuclei and a still smaller fraction of heavier nuclei. Electrons and photons also compose a part of the cosmic rays. However, since these components are nothing to do with the neutrino production, these particles will not be mentioned later. The energy spectrum of these particles extends to very high energies, although the flux of these particles decreases rapidly with the increasing energy. These particles, once enter into the Earth’s atmosphere, interact with the nuclei in the high altitude atmosphere. Typically, in these high-energy nuclear interactions, many π mesons, and less abundantly K mesons, are produced. Since these mesons are unstable, they decay to other particles. For example, a π+ decays to a muon (μ+) and a νμ. The produced muon (μ+) is also unstable and decays to a positron (e+), a ν̄μ and a νe. A similar decay processes occur for π− and K mesons. In this manner, neutrinos are produced when a cosmic-ray particle enters an atmosphere. Figure 1 shows schematically the production of neutrinos in the atmosphere. These neutrinos are called atmospheric neutrinos. The primary cosmic-ray flux decreases rapidly with the energy, approximately E −2.7 in the GeV to TeV energy region. Therefore, the calculated neutrino flux rapidly decreases with the increasing energy.
Fig. 1.
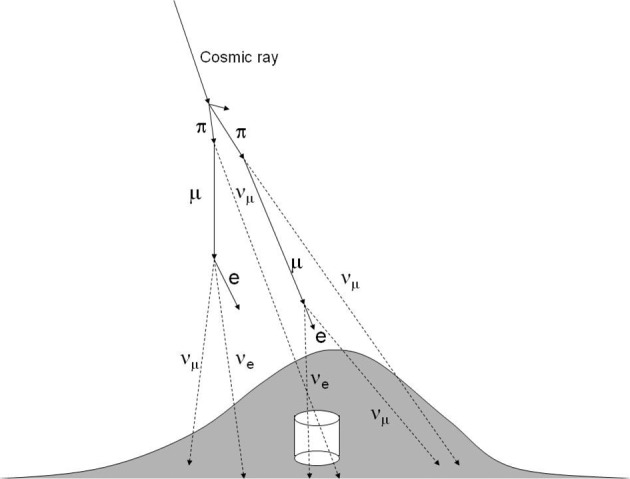
Production of neutrinos by cosmic-ray interactions with the air nucleus in the atmosphere. The typical height of the neutrino production is 15 km above the ground.
If we study the processes of the neutrino production, we find that 2 (νμ plus ν̄μ) and 1 (νe or ν̄e) are produced for every charged-pion decay. Since the energies of these neutrinos are almost equal, one finds that the flux ratio of (νμ + ν̄μ) and (νe + ν̄e) should be approximately 2. This ratio is indeed predicted to be very close to 2 by detailed calculations of the neutrino flux. The accuracy of the calculated ratio is estimated to be better than a few percent in the GeV energy range. It turned out that this flux ratio is a good indicator for neutrino oscillations, since this ratio should deviate from the predicted ratio if neutrinos oscillate. Indeed, as described later, the first serious indication for neutrino oscillation was observed by the study of this ratio. Later in most part of this article, both neutrinos and anti-neutrinos are called neutrinos for simplicity.
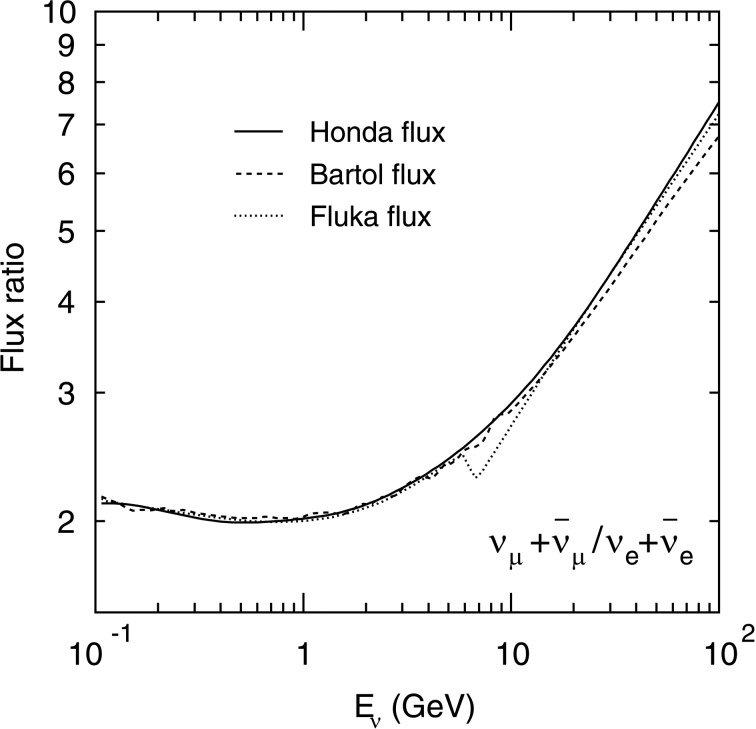
Figure 2 shows the calculated (νμ + ν̄μ)=(νe + ν̄e) flux ratio as a function of the neutrino energy. It is clear that the ratio is approximately 2 below about 1 GeV, where most of the muons produced by the pion decays are expected to decay before reaching the ground. Above this energy range, the ratio increases due to the increasing probability of muons reaching the ground before their decay. It is also clear that the ratio is calculated very accurately, since the results from three independent calculations agree well.
Fig. 2.
Calculated (νμ + ν̄μ)/(νe + ν̄e) ratio of the atmospheric neutrino flux as a function of the neutrino energy by three independent groups.9)–11)
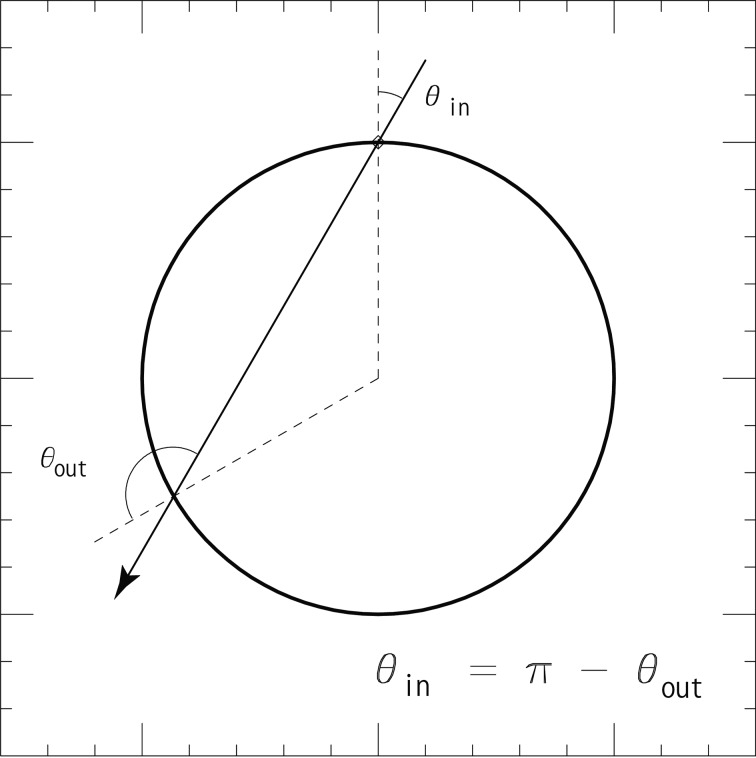
Another important feature of the atmospheric neutrino flux is the up-down symmetry. The neutrino thus produced enters the Earth at a point posin with a zenith angle θin should exit the Earth at a point posout with a zenith angle θout. Obviously, θin and θout are related by; θin = π − θout. See Figure 3. Since the cosmic ray enters into the atmosphere with approximately equal rate in every position in the Earth, there must be a neutrino that enters the Earth at a point posout with a zenith angle θin, and exits the Earth at a point posin with a zenith angle θout. These two processes occur with an equal rate as far as the cosmic-ray fluxes in both positions are equal. Thus one can conclude that the flux is up-down symmetric. This is a very useful prediction. As we will discuss later, the comparison of the up-down asymmetry of the experimental data with the prediction gave compelling evidence for neutrino oscillations.
Fig. 3.
A neutrino trajectory that enters the Earth with zenith angle θin will exit with a zenith angle θout = π − θin. As far as the primary fluxes are equal at the entry and exit points, one can deduce the up-down symmetry of the neutrino flux.
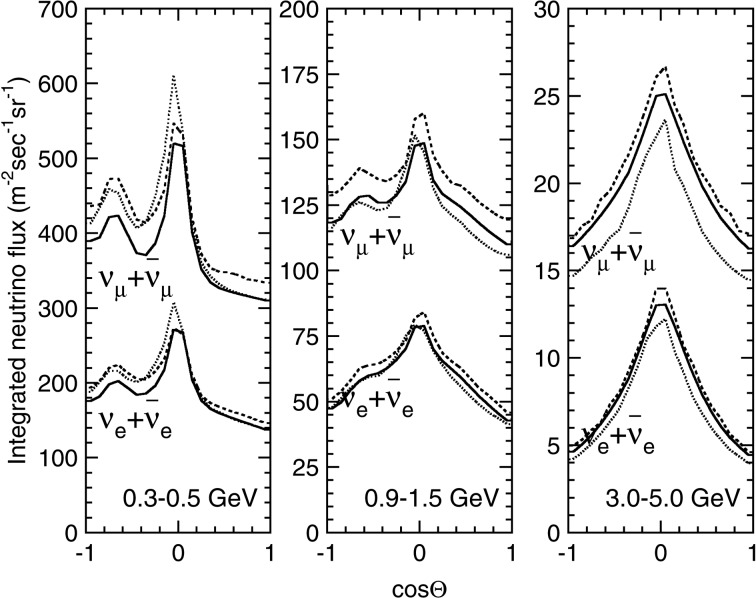
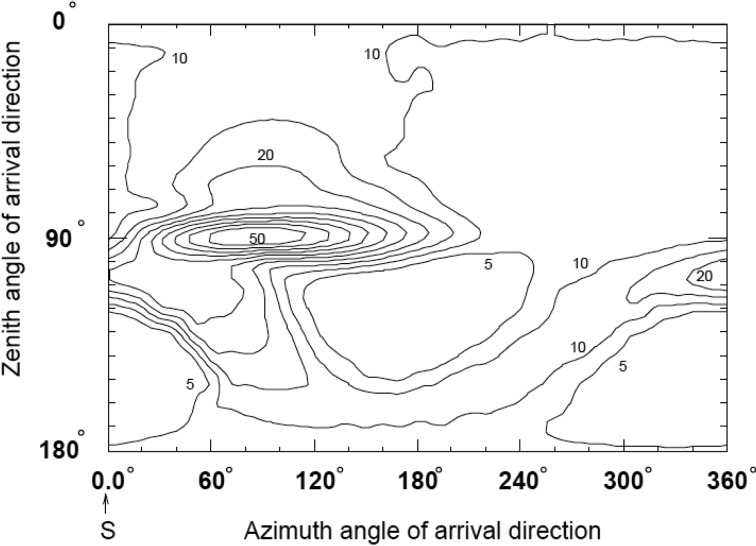
Figure 4 shows the calculated zenith-angle dependence of the atmospheric neutrino flux for several neutrino energy ranges at Kamioka, Japan. As expected, above a few GeV, the flux is up-down symmetric. Below this energy, the flux is not exactly up-down symmetric. This is due to the geomagnetic field: Low energy cosmic-ray particles, typically below 10 GeV, are bent significantly by the geomagnetic field, and only cosmic-ray particles above certain rigidity (cut-off rigidity, (GeV/c)/Ze), which depends on the position in the earth and on the direction of the cosmic-ray particles, can enter into the atmosphere. The cut-off rigidity for vertically entering cosmic rays is less than 1 GeV and approximately 15 GeV near the geomagnetic poles and equator, respectively. Thus the flux of the low-energy, downward-going neutrinos depends on the local geomagnetic field above the detector. On the other hand, for the flux of the low-energy, upward-going neutrinos, the geomagnetic field effect is more or less averaged out by integrating over the whole Earth. This effect is illustrated in Fig. 5, which shows the cut-off rigidity for cosmic rays that produces neutrinos directing to Kamioka.12) One sees that the cut-off rigidity near Kamioka is higher than the one averaged all over the Earth. Since cosmic-ray particles with the primary energy of E contribute to the neutrino flux in the energy range of 1/10 × E, it is understood that the geomagnetic-field effect could only produce sizable up-down asymmetry in the sub-GeV energy range.
Fig. 4.
Calculated zenith angle dependence of the atmospheric neutrino flux for several neutrino energy ranges at Kamioka by three independent groups.9)–11) While there is an enhancement of the flux near the horizon, the up-down symmetry is predicted in the energy range above a few GeV.
Fig. 5.
Contour map of cut-off rigidity for cosmic rays that produces neutrinos directing to Kamioka.12) Azimuth angles of 0, 90, 180 and 270 degrees represent directions to south, east, north and west, respectively. The unit is (GeV/c)/Ze, where Ze is the charge of the incident cosmic-ray particle.
3. Neutrino interactions
In order to study the details of the atmospheric neutrino events, it is necessary to understand the neutrino interactions. Practically, the measurements are compared with the simulation based on the calculated flux and the known neutrino cross sections and interaction kinematics. The Monte Carlo technique is used to simulate the neutrino interactions. The important energy range for atmospheric neutrino interactions is between 0.1 GeV and 10 TeV.
Usually, the following charged- and neutral-current neutrino interactions are considered in the Monte Carlo simulation:
(quasi-)elastic scattering, νN → lN ′,
single meson production, νN → lN ′ meson,
coherent π production, ν16O → l ν16O,
deep inelastic scattering, νN → lN ′ hadrons.
Where, N and N ′ are the nucleons (proton or neutron) in the initial and final states, respectively. l is the lepton (either a neutrino or a charged lepton). The most dominantly produced mesons are pions. If the neutrino interaction occurred in a nucleus, generated particles like pions and Kaons interact with the nuclear matter before escaping from the nucleus.
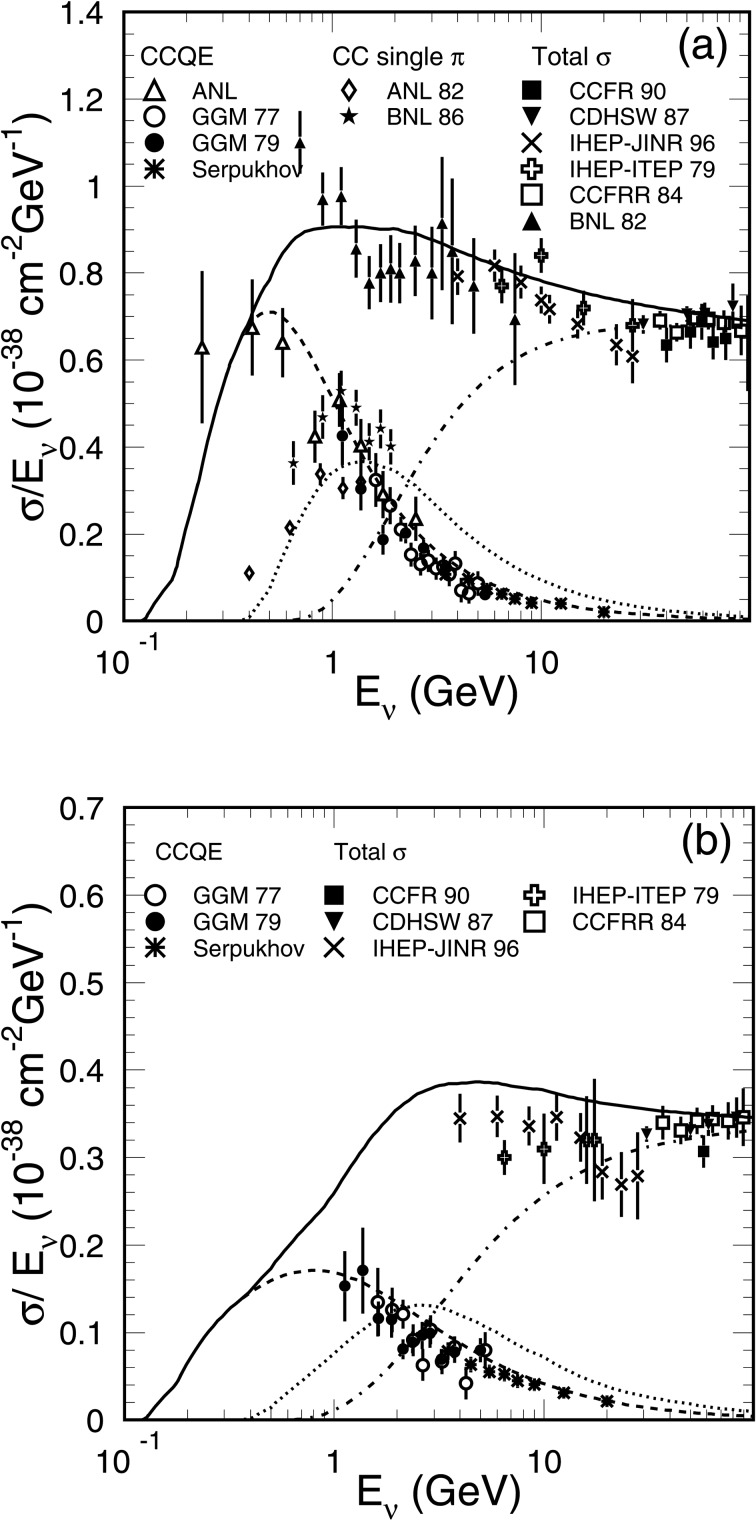
In the lowest energy range of less than 1 GeV, the (quasi-)elastic scattering is dominant. For scattering off nucleons in 16O, the Fermi motion of the nucleons and Pauli Exclusion Principle are taken into account. Typically, these effects are treated based on the relativistic Fermi gas model.13) In the GeV energy range, the single pion production processes14) are also important. In the multi-GeV or higher energy ranges, the deep inelastic scattering is dominant. Total charged-current cross sections, together with the cross sections for quasi-elastic scattering, single meson productions and deep inelastic scattering, are shown in Figure 6.
Fig. 6.
Charged-current total cross sections divided by Eν for (a) neutrino and (b) anti-neutrino interactions used in the Monte Carlo simulation in the Super-Kamiokande collaboration.15) Solid line shows the calculated total cross sections. The dashed, dotted and dash-dotted lines show the calculated quasi-elastic, single-meson and deep-inelastic scattering cross sections, respectively. Data points from various experiments are also shown. The references for the original data can also be found in.15)
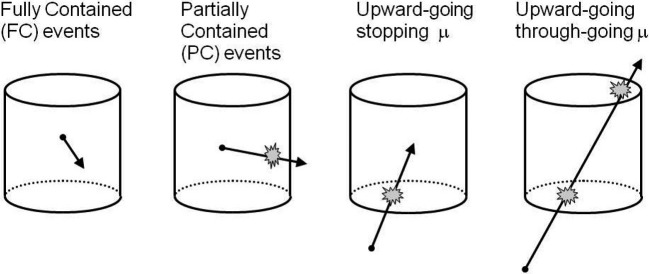
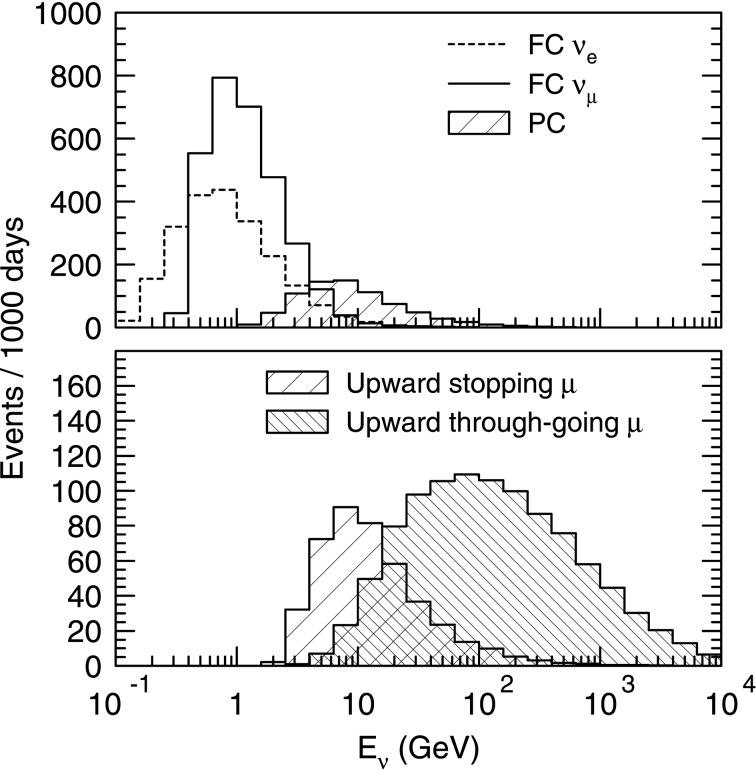
As seen from Fig. 6, the cross section for neutrino-nucleon interactions increases almost linearly with the increasing neutrino energy above 1 GeV. Therefore, the event rate as a function of the neutrino energy decreases as approximately E −2, since the flux is approximately proportional to E −3. For neutrinos with the typical energies above 10 GeV, atmospheric νμ events are typically observed as upward-going muons. In these events, neutrinos interact with the rock surrounding the detector and only the muons produced by charged-current νμ interactions are observed. Since the range of the muon is almost proportional to the muon energy, the target volume for these events increases approximately linearly with the increasing neutrino energy. Due to the cosmic-ray muon background for down-going muons, one typically requires that the muon direction should be upward-going for events originated by neutrino interactions. For these upward-going muon events, the event rate as a function of the neutrino energy decreases as approximately E −1, since the flux, cross section, and the target volume are approximately proportional to E −3, E1 and E1, respectively. Figure 7 summarizes the types of events (event topologies) observed in atmospheric neutrino experiments. Figure 8 shows the approximate event rate for a typical atmospheric neutrino experiment. As discussed above, due to the cross section and the muon-range factors, high energy neutrino events are observed with an enhanced event rate. The broad range of available energies, in combination with the variation in neutrino travel distances, makes the atmospheric neutrino data well suited for studying neutrino oscillations.
Fig. 7.
Types of events observed in atmospheric neutrino experiments. Events whose vertex positions are located inside the fiducial volume of the detector and all visible secondary particles stop in the detector are called “fully-contained (FC)” events (left panel). νμ events with the multi-GeV neutrino energies produce energetic muons which do not stop in the detector. They are called “partially-contained (PC)” events (second panel from the left). High energy νμ interactions in the rock below the detector produce high energy muons. These muons enter into the detector. Some of them stop in the detector (upward stopping muons, second panel from the right) or penetrate through the detector (upward through-going muons, right panel).
Fig. 8.
The parent neutrino energy distributions for the fully-contained, partially-contained, upward stopping muon and upward through-going muon events.15) A cylindrical detector with the fiducial, mass of 22.5 kton is assumed.
4. Early indication for neutrino oscillations
The observation of atmospheric neutrinos started in the mid. 1960’s. Two experiments that were carried out in extremely deep mines in India16) and South Africa17) successfully observed muons produced by atmospheric νμ interactions. In a subsequent publication in 1978 from the experiment at South Africa,18) the authors measured the flux of the atmospheric νμ’s. The ratio of the predicted flux over the observed flux was 1.6 ± 0.4. The uncertainty mainly arose from those in the flux and cross section. Due to the large uncertainty, the authors concluded that there was fair agreement between the observed and expected neutrino induced muon flux. However, the observed flux was lower than the expected one.
In the 1970’s, Grand Unified Theories of elementary particles were proposed.19),20) These theories predicted that the strong, electromagnetic and weak forces are unified at the very high energy of 1014–15 GeV/c2. According to the Grand Unified Theories, a proton (and a neutron as well), which is the fundamental constituent of the matter, should not be absolutely stable and decay with a certain lifetime. The predicted lifetime of a proton and a neutron was about 1030 years according to the Grand Unified Theories at that time. This means that it is possible to observe about 300 proton decays (or 600 proton plus neutron decays) if one observes 1,000 tons of matter for a year, since 1,000 tons of matter contains about 6 × 1032 of protons plus neutrons and since a typical matter contains approximately the same number of protons and neutrons. Motivated by this prediction, several proton decay experiments started in the early 1980’s whose detector masses ranged from about 100 to 3,000 tons.
These experiments did not observe any convincing signal of proton decays. However, these experiments observed hundreds of atmospheric neutrino interactions in the detectors. Atmospheric neutrino interactions are serious background for proton decay searches, since a neutrino arrives at the detector without showing any evidence for incidence and may interact with a nucleon, producing visible secondary particles. The proton decay signal and atmospheric neutrino background can only be separated by studying the details of the secondary particles. Because of this reason, these experiments studied details of these neutrino interactions. In short, various distributions for the observed contained events were consistent with the expectation from the atmospheric neutrino interactions. However, the IMB21) and Kamiokande22) observed in 1986 that the fraction of events accompanied with a muon decay signal was less than expected. One of the possibilities for these data was a deficit of νμ events. However, these data were not paid much attention.
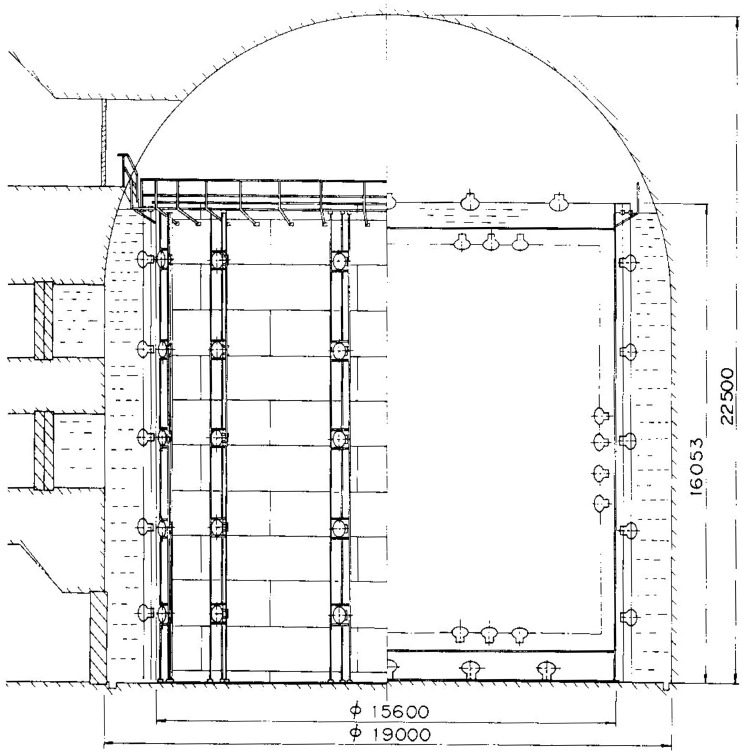
One of the experiments, Kamiokande, used water for the source of protons together with a specially produced huge photomultiplier tubes to study details of proton decays. Figure 9 shows the schematic of the Kamiokande detector. The total mass of the Kamiokande detector was 4,500 tons and the central 1,000 tons was the fiducial volume for proton decay and neutrino interactions. Only events occurring in this volume were used for various analyses.
Fig. 9.
The schematic of the Kamiokande detector. The detector had a cylindrical steel tank which contained 3,000 tons of pure water. Inside this tank, about 1,000 photomultiplier tubes, whose diameter was 50 cm, were used. Later, the outside of the tank was also filled with water of about 1,500 tons, and used as an anti-counter. Thus the total mass of the detector was 4,500 tons.
When a proton decay or a neutrino interaction occurs in water, secondary particles are produced. If the secondary charged particles propagate in water with the speed exceeding to that of the light in water, these particles emit Cherenkov radiation. The direction of the radiated photons is about 42 degrees away from the direction of the charged particle, if the particle propagates with approximately the speed of light in the vacuum. Therefore the image of the Cherenkov radiation shows the ring shape, and can be observed by the photomultiplier tubes instrumented on the wall.
In 1985, Kamiokande installed a new electronics system that was able to record the photon arrival time as well as the pulse height for each photo-multiplier tube. Furthermore, a 4π-solid-angle anti-counter was installed. These improvements were primarily for the solar neutrino studies. However, these improvements also motivated the systematic improvements for the reconstruction programs for the contained atmospheric neutrino events.
One important piece of information for the study of neutrino oscillations is the type of particles produced. An electron produced in the detector by a νe interaction propagates in the water producing an electro-magnetic shower. On the other hand, a muon produced by a νμ interaction propagates in water almost straightly loosing its energy slowly without producing an electro-magnetic shower. The ring image of the Cherenkov radiation due initially to an electron is the summation of the ring images of many electrons and positrons in the electro-magnetic shower and shows fuggy ring pattern. On the other hand, the ring image due to a muon is only produced by a muon and shows clearer ring pattern. Therefore, it is possible to separate Cherenkov rings due to an electron and a muon, and are called “e-like” and “μ-like”, respectively, in this paper.
The ability to separate e-like and μ-like Cherenkov rings depends on the amount of information one can get from the ring image, and therefore depends on the amount of Cherenkov photons one can observe. In this sense, Kamiokande was suited to carry out this analysis due to the use of the huge photo-multiplier tubes. The number of photoelectrons for 1GeV/c electrons and muons was about 3,000, which is large enough for the efficient identification of e-like and μ-like Cherenkov rings. The probability of correctly identify the types was 98%.
In 1988, Kamiokande reported a result on the number of μ-like and e-like events.23) A muon is produced by a νμ interaction, and an electron is produced by a νe interaction. Therefore, counting the number of μ-like and e-like events essentially corresponds to counting the number of νμ and νe interactions. In order to estimate the expected signal that should be compared with the actual data, a Monte Carlo simulation was performed. Table 1 shows the number of observed e-like and μ-like events together with the corresponding Monte Carlo predictions. One notices that the number of e-like events of the data, 93 ± 9.6(stat) agreed with the prediction within the statistical error of data. However, the observed number of μ-like events, 85 ± 9.2(stat) was much smaller than the predicted number of events. As discussed earlier, the νμ/νe ratio of the flux is accurately predicted, although the predicted absolute number of events had more than 20% uncertainty at that time. Therefore, the discrepancy between the data and the prediction could have been due to a new physics effect neglected in the Monte Carlo simulation.
Table 1.
The numbers of e-like and μ-like events observed in Kamiokande in 1988, compared with the prediction that did not take into account neutrino oscillations.23) The detector exposure was 2.87 kilo-ton · year. Only single-Cherenkov-ring events were used. About 90% of them were estimated to be due to charged-current νe and νμ interactions for e-like and μ-like events, respectively.
| Data | Monte Carlo Prediction | |
|---|---|---|
| e-like events | 93 ± 9.6 | 88.5 |
| μ-like events | 85 ± 9.2 | 144.0 |
One can in principle explain the data if one assumes neutrino oscillations, since, for example, if νμ oscillate to ντ with a large mixing angle, it is possible to explain down to 50% disappearance of the νμ events. Atmospheric neutrinos arriving at a detector near the surface of the Earth have flight lengths ranging from about 10 km to 12,700 km and also the energies of these neutrinos have a certain spread. As a result, only the average feature of the neutrino oscillations could be observed, and therefore one can expect at most 50% disappearance. However, at that time, it was commonly believed that the mixing angles between neutrinos must be small, since the corresponding mixing angles between the quarks are known to be small. Therefore, the result and the oscillation interpretation were not accepted by physicists, since they implied that the mixing angle between neutrinos is large.
Due to the same reason, many checks were carried out before the publication within the collaboration. The first indication for the deficit of νμ events was already obtained in the fall of 1986, when a detailed particle identification program was applied to the single-Cherenkov-ring events in the data. For about a year, various details of the analysis were studied to confirm or exclude the initial suggestion. For example, one can imagine that νμ events were eliminated during the data reduction processes by some unknown reasons. Therefore, independent data selection program was developed and the independent data sample was selected from the raw data. No additional neutrino event was found, confirming that the data selection did not have any problem. After one year of such studies, it was concluded that there was no serious mistake in the analysis, and a paper was published in 1988. In the paper, Kamiokande concluded that “We are unable to explain the data as the result of systematic detector effects or uncertainties in the atmospheric neutrino fluxes. Some as-yet-accounted-for physics such as neutrino oscillations might explain the data”.23) This was the beginning of the serious interest in the atmospheric neutrinos. It took 10 years to conclude that the observed deficit of νμ events was due to neutrino oscillations.
In spite of the large and statistically significant deficit of the number of νμ events, the experimental confirmation of this result was not obtained in the 1980’s. There were three other experiments that recorded similar amount of atmospheric neutrino data. Two of them used a significantly different technique to detect charged particles produced by a neutrino interaction. These experiments24),25) directly observed tracks of charged particles by using large number of particle counters interleaved with steel plates for the target of the neutrino interactions. Another experiment, called IMB, used the same detection technique as Kamiokande. It had about a factor of three larger fiducial mass, but used smaller 20 cm diameter photomultiplier tubes.
In the mean time, Kamiokande increased the data statistics. Also it improved the Monte Carlo simulation using more precise neutrino flux and interaction models, and the data analysis. However the deficit of μ-like events remained (see, for example Ref. 26)).
In 1991 and subsequently in 1992, the other water Cherenkov experiment, IMB, published the results on the νμ/νe ratio of the atmospheric neutrino flux. In the 1991 paper,27) there was indication for the νμ deficit, but the significance of the deficit was not conclusive. In the subsequent paper published in 1992,28) IMB doubled the data statistics and showed the statistically significant deficit. Also, Kamiokande published the second paper in 1992 on this topic including the results on the neutrino oscillation analysis.29) In the analysis, both νμ → ντ and νμ → νe were tested and concluded to be allowed, because the small μ-like/e-like ratio can occur for both oscillation channels. However, in both cases, it was clear that a large mixing angle is needed to explain the data in terms of neutrino oscillations.
The results were taken more seriously, since the two independent experiments showed the significant deficit of νμ events. However, the other two experiments that used different target material (steel) and different detection technology (tracking detectors), although with lower statistics, did not observe any evidence for νμ deficit.24),25) The further support for the νμ deficit came from the newer experiment, called Soudan-2. It used thin steel plates for the target of the neutrino interactions, and used particle counters that are not only able to detect the tracks of charged particles but also to measure the energy loss of the particles. In 1997, Soudan-230) observed the deficit of νμ events with a somewhat limited statistics.
The observed νμ deficit or equivalently the small νμ/νe flux ratio was called “atmospheric neutrino anomaly”. The atmospheric neutrino anomaly was taken more seriously with time. However, neutrino oscillation was still one of the possible explanations of the anomaly. It was widely thought that there must be some explanation of the data other than neutrino oscillations with a very large mixing angle. This was due partly to the fact that the observed effect was only the deviation of the νμ/νe flux ratio from the prediction. Indeed, the deficit of νμ events from Kamiokande and IMB did not show any strong zenith-angle and momentum dependences.
Soon after submitting the first paper on the atmospheric νμ deficit in 1988, Kamiokande started to select atmospheric νμ events with the energies in the multi-GeV range from the raw data. In the earlier analysis, the events selected for the search for proton decay were used. Hence the energy range covered was about 1 GeV or less. A multi-GeV νμ interaction typically produces a multi-GeV muon. These multi-GeV muons produced in the detector typically penetrate through the detector, reaching the surrounding rock. Kamiokande, in the second phase, had an anti-counter that surrounded the inner detector completely (see. Fig. 9). Neutrino interactions occurring inside the inner detector and an exiting muon can be identified by a signal in the anti-counter. These events are called partially-contained (PC) events. Since muons are essentially the only charged particle that can propagate in the water for more than a few meters, most of the partially-contained events are νμ interactions.
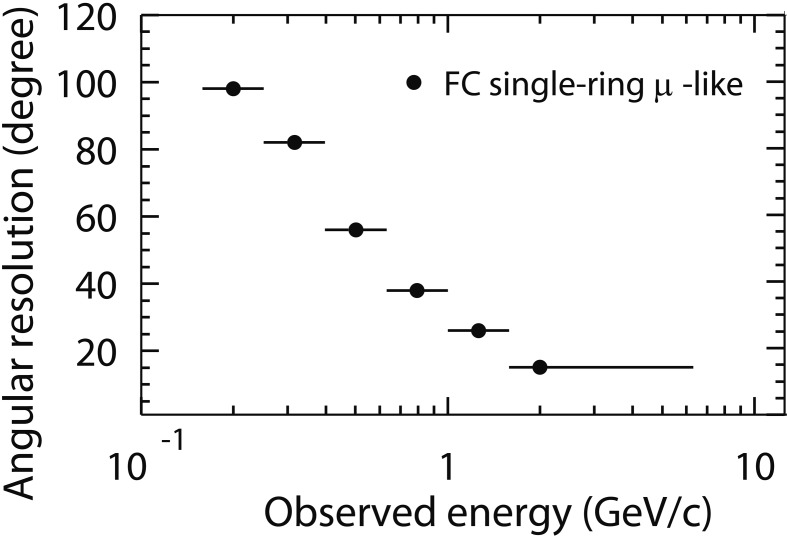
If the νμ deficit observed in the sub-GeV to the GeV range is due to neutrino oscillations, the deficit should also be observed in the higher energy range, since there is a well known relation between the neutrino oscillation probability and the neutrino energy, see Eq. [1]. Furthermore and more importantly, if the observed νμ deficit was due to neutrino oscillations, the deficit should depend on the neutrino flight length, and therefore depend on the zenith angle. However, in the energy range below about 1 GeV, the correlation between the neutrino direction and muon direction is rather poor. The zenith angle dependence in the neutrino direction is largely washed out in the muon zenith-angle distribution in this energy range. The angular correlation gets substantially better with increasing neutrino energy, and the zenith angle distribution for muons should represent the neutrino zenith angle distribution fairly well for multi-GeV neutrino events. Figure 10 shows the angular correlation between neutrinos and the produced leptons.
Fig. 10.
Angular correlation between neutrinos and the produced muons for single-Cherenkov-ring events in a water Cherenkov detector (Super-Kamiokande).
As discussed previously, the flux is predicted to be up-down symmetric. On the other hand, if the neutrino oscillation length is about 1,000 km for the neutrinos considered here, one expects that the νμ deficit should be observed in the upward-going directions, since the neutrino flight length is much less than 1,000 km and much more than 1,000 km for downward-going and upward-going neutrinos, respectively. This could be a very important measurement, since the observed up-down asymmetry can not happen for the non-oscillated neutrino flux. Only neutrino oscillations can explain the asymmetry. Furthermore, if neutrino oscillations are between νμ and ντ, the zenith-angle dependent deficit can only be observed in the νμ events. Finally, it is possible to estimate the neutrino mass parameter (Δm2) by identifying the zenith angle, and therefore the neutrino flight length, where the νμ deficit becomes significant.
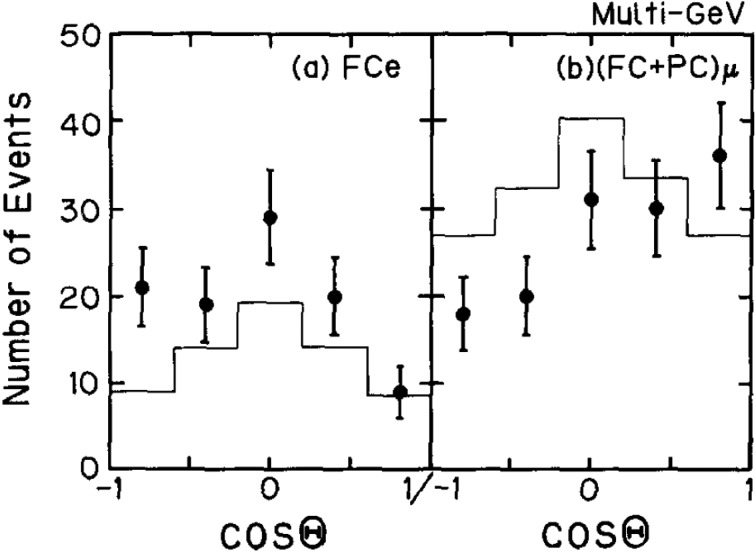
Since the flux of the atmospheric neutrinos decreases rapidly as the energy increases, the event rate for the multi-GeV νμ events was only about 20 per year in Kamiokande. It took several more years to collect statistically meaningful number of such events. Finally, in 1994, Kamiokande reported the multi-GeV atmospheric neutrino data.31) The μ-like data showed deficit of events in the upward-going direction, while the downward-going μ-like events did not show such deficit. Furthermore, the corresponding distribution for e-like events did not show any evidence for the deficit of upward-going events, in good agreement with the prediction. In fact, the Kamiokande multi-GeV e-like data showed a slight excess of upward-going e-like events, although it was not statistically significant. Figure 11 shows the observed zenith angle distributions for multi-GeV neutrino events in Kamiokande. The up/down ratios for multi-GeV μ-like and e-like events were 0.58− 0.11+0.13 and 1.38−0.30+0.39, respectively. The statistical significance of the observed up-down asymmetry in the μ-like events was 2.8 standard deviations. In other words, the probability that the observed result could be due to a statistical fluctuation was less than 1%. It was an interesting observation, which showed, for the first time, that the νμ deficit depended on the neutrino flight length as predicted by neutrino oscillations. However, the statistical significance was not strong enough to be conclusive. Experimental data with high enough statistics were waited for.
Fig. 11.
Zenith-angle distributions for multi-GeV (a) e-like and (b) fully-contained plus partially-contained μ-like events observed in Kamiokande,31) where multi-GeV is defined to be higher than 1.33 GeV in visible energy. Solid histogram shows the predicted distributions without oscillations. Absolute normalization had an uncertainty larger than 20%.
5. Discovery of neutrino oscillations
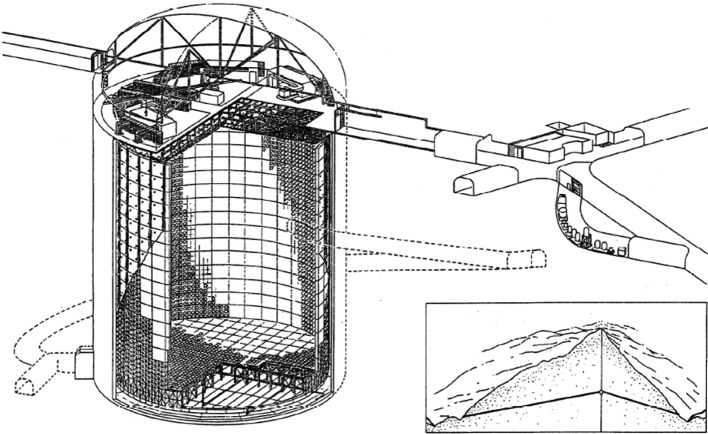
The Super-Kamiokande detector is a large water Cherenkov detector. It is a cylindrical detector with 41.4 meters high, 39.3 meters in diameter, and has the total mass of 50,000 tons. It is the largest neutrino detector that can study details of neutrino events in the GeV energy range. Like Kamiokande, the Super-Kamiokande detector consists of two parts; the inner detector that studies the details of neutrino interactions and the outer detector that identifies the exiting and incoming charged particles. The fiducial mass is the central 22,500 tons, and is about 20 times larger than that of Kamiokande. Figure 12 shows the schematic of the Super-Kamiokande detector.
Fig. 12.
Schematic of the Super-Kamiokande detector. Each dot seen on the wall shows the 50 cm diameter photomultiplier tube. About 11,200 photomultiplier tubes are used for the inner detector. The outer detector is equipped with about 1,900 20-cm-diameter photomultiplier tubes.
Due to the larger fiducial mass, Super-Kamio-kande can accumulate the neutrino events approximately 20 times faster than Kamiokande. Furthermore, the images of the Cherenkov rings observed by 11,200 photomultiplier tubes make it possible to study details of events. Figure 13 shows the candidate charged-current νe and νμ interactions with visible single Cherenkov ring observed in Super-Kamiokande. This feature turned out to be particularly useful to study neutrino oscillations in detail.
Fig. 13.
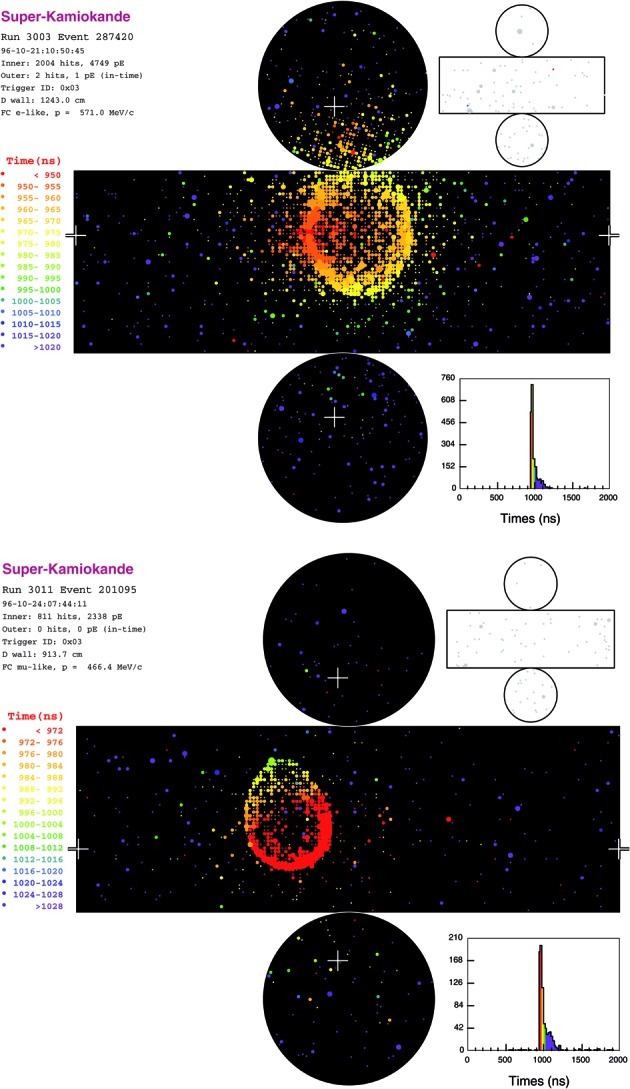
Candidates of charged-current νe (top) and νμ (bottom) interactions with visible single Cherenkov ring observed in Super-Kamiokande. The cylindrical detector is opened to flat. The colors indicate the timing of the photon detection and the size of the circles indicates the pulse height for each photomultiplier tube.
The Super-Kamiokande collaboration is an international collaboration from Japan, United States of America, Korea, China, Poland and Spain as of this writing. Many people from the Kamiokande and IMB collaborations joined in this experiment. The Super-Kamiokande detector was designed based on the experiences in these experiments together with improvements based on various technological developments.
The Super-Kamiokande experiment started in the spring of 1996 after 5 years of the detector construction. The analysis methods for the atmospheric neutrino interactions have been known well through the studies of atmospheric neutrinos in the previous experiments. Furthermore, Super-Kamiokande developed the Monte Carlo simulation and the analysis programs based on those in Kamiokande as well as those in IMB. Therefore, Super-Kamiokande was able to produce reliable results in a relatively short time after the start of the experiment. However, it was realized that the analysis program must be fully automated in order to fully utilize such high statistics. In Kamiokande, the number of Cherenkov rings was determined by physicists using an interactive graphic event display. This was possible in Kamiokande since the event rate in Kamiokande was relatively low and the possible systematic effects due to the physicist’s bias were likely to be much smaller than the statistical error. However, due to the much higher event statistics in Super-Kamiokande, possible bias in the event scanning could be a serious source of the systematic errors. In addition, it seemed to be almost impossible to scan both the data and Monte Carlo events (which should have much higher statistics than those of the data) visually. Therefore, Super-Kamiokande aimed at making the analysis fully automatic. It took more than a year to prepare the fully automatic analysis. The analysis results based on the automatic analysis began to be shown outside of the collaboration in the summer of 1997. By the spring of 1998, Super-Kamiokande analyzed 535 days of data, or equivalently 33 kilo-ton · year detector exposure. The total number of atmospheric neutrino events was 5,400, which was about 4 times more statistics than those in Kamiokande.
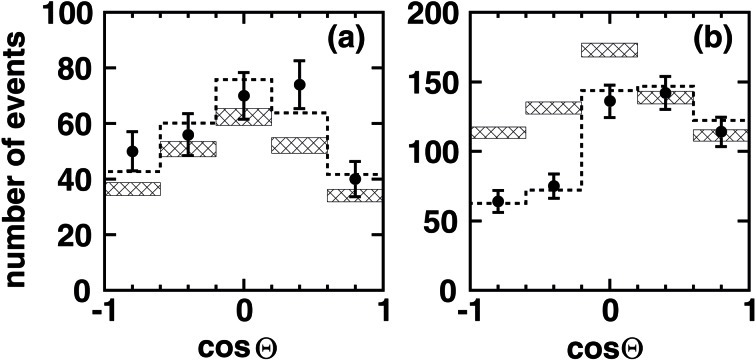
At the 18th International Conference on Neutrino Physics and Astrophysics (Neutrino’98), Super-Kamiokande made an announcement of the evidence for atmospheric neutrino oscillations.7),8) The evidence for neutrino oscillations was obtained by several kinds of measurements: The νμ/νe flux ratio was measured with greater precision for both sub- and multi-GeV energy ranges, showing significantly smaller ratios than the prediction in both energy ranges. However, the strongest evidence for oscillation came from the zenith angle distributions. The zenith angle distributions shown in Neutrino’98 are copied in Fig. 14. The left panel of Fig. 14 shows the zenith angle distribution for multi-GeV (namely, the visible energy of an event must be larger than 1.33 GeV) e-like events, while the right panel shows that for fully-contained multi-GeV μ-like plus partially-contained neutrino events. It was clear that the deficit of upward-going events was observed. The statistical significance was more than 6 standard deviations, implying that the deficit was not due to a statistical fluctuation. There must be some physical mechanism to reduce the number of νμ interactions for neutrinos that traveled more than several hundred km. On the other hand, the zenith angle distribution for e-like events did not show any statistically significant up-down asymmetry. This suggested that the νe events were detected as expected independent of the neutrino flight length. Namely, electron-neutrinos do not oscillate as far as the flight length is less than the diameter of the Earth. It was concluded essentially from this figure that muon-neutrinos oscillate to other types of neutrinos, most likely to tau-neutrinos. Furthermore, the zenith-angle distributions for upward-going muons, produced by very high energy atmospheric neutrino interactions in the rock below the Super-Kamiokande detector, showed a deviation from the non-oscillated Monte Carlo prediction; another indication of oscillations.
Fig. 14.
Zenith angle distributions for multi-GeV atmospheric neutrino events reported at the Nuetrino’98 conference based on 535 days exposure of the Super-Kamiokande detector. The left and right panels show the distributions for e-like and μ-like events, respectively. Θ shows the zenith angle, and cos Θ = 1 and −1 represent events whose direction is vertically downward-going and upward-going, respectively.
The data were analyzed assuming νμ → ντ neutrino oscillations. Figure 15 shows the summary of the oscillation analyses from Super-Kamiokande as well as those from Kamiokande at the Neutrino’98 conference. Five contours of allowed neutrino oscillation parameters obtained from Super-Kamiokande and Kamiokande overlapped, indicating that the data were consistently explained by neutrino oscillations. The “atmospheric neutrino anomaly” discovered in 1988 was concluded to be due to neutrino oscillations.
Fig. 15.
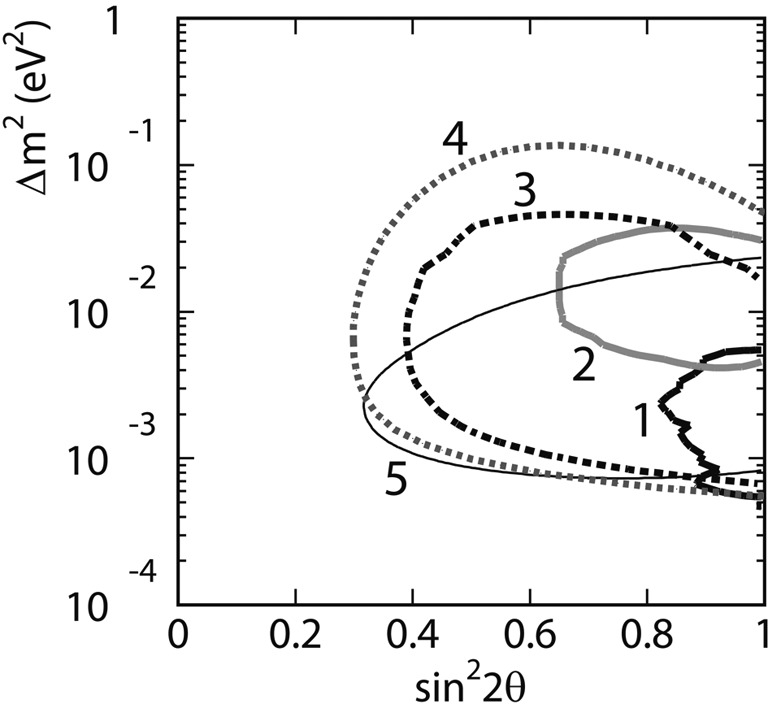
Allowed parameter regions of νμ → ντ oscillations from Super-Kamiokande and Kamiokande shown at the Neutrino’98 conference.7) Contours are obtained based on; (1) contained events from Super-Kamiokande, (2) contained events from Kamiokande, (3) upward through-going events from Super-Kamiokande, (4) upward through-going events from Kamiokande and (5) stop/through ratio analysis for upward-going muons from Super-Kamiokande.
There were two other experiments that observed atmospheric neutrinos at that time. One was Soudan-2 which has been taking data since 1989. The data statistics were substantially improved compared with those in the earlier publications. This detector was able to determine the direction of the particles by several methods. This experiment confirmed the νμ deficit as a function of the zenith angle of the event direction.32) Another experiment was MACRO, which was a large underground detector being able to measure upward-going muons as well as partially-contained neutrino events. The size of the detector was 12 m × 77 m × 10 m (height). This experiment also observed the zenith-angle dependent deficit of upward-going muons33) and partially-contained νμ events.34) The results from these experiments were completely consistent with those from Super-Kamiokande, and therefore neutrino oscillation was quickly accepted by physicists working in this field.
6. Further studies of neutrino oscillations
The data from Super-Kamiokande in 1998 showed that approximately 50% of muon-neutrinos disappear after traveling long distances, and were commonly interpreted to be neutrinos oscillations. However, there were still several un-answered questions, such as “what are the values of the neutrino mass squared difference (Δm2) and the neutrino mixing angle (θ)?”, “does the νμ disappearance probability really oscillate as predicted by the theory of neutrino oscillation?”, “is it possible to confirm νμ → ντ oscillations by detecting ντ interactions?”, and “is it possible to observe the same effect with a different neutrino beam?”. As of this writing, these questions have been answered experimentally.
6.1. More data and the measurement of oscillation parameters
Super-Kamiokande continued taking data until the summer of 2001. After that, the operation of the detector was stopped for a while to replace the dead photomultiplier tubes. After the replacement work, in Nov. 2001 while filling the detector with pure water, the Super-Kamiokande detector had an accident, with which more than half of the photomultiplier tubes were broken. It took more than a year to resume the operation of the detector with the survived 5,200 photomultiplier tubes. The initial phase of the Super-Kamiokande was called Super-Kamiokande-I (SK-I) and the second phase after the accident was called Super-Kamiokande-II (SK-II). In 2005, a work to fully recover the number of the photomultiplier tubes started. In 2006, a new phase of the experiment (SK-III) started. This phase continued until the 10 year old electronics system was replaced by a completely new system in 2008. Many results have been presented based on the SK-I or on the whole SKI+II+III data, and therefore are described here.
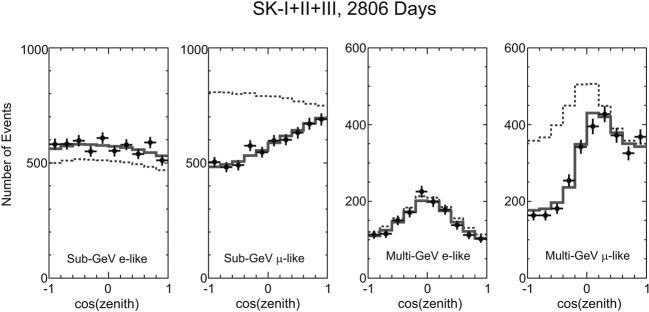
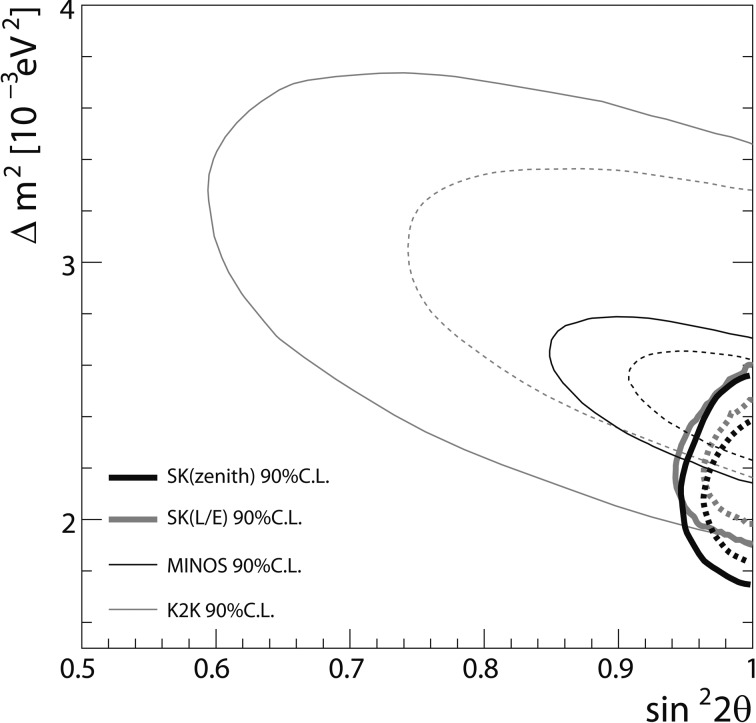
The total number of the atmospheric neutrino events during the SK-I+II+III periods was approximately 29,000, which contain more than a factor of 5 more statistics than the data analyzed in 1998. Figure 16 shows the zenith angle distributions for these events. It is clear that the event statistics are improved significantly compared with the 1998 data, which has been shown in Fig. 14. A measurement of neutrino oscillation parameters was carried out using these events assuming νμ → ντ 2-flavor oscillations. Figure 17 shows the allowed regions of neutrino oscillation parameters (Δm2 and sin22θ). There is a significant improvement in the determination of the neutrino oscillation parameters. Δm2 and sin22θ are constrained within about ± 15% and ± 4% at 68% confidence level, respectively. The mixing angle is consistent with the maximum mixing (sin22θ = 1.0). These parameters are much more accurately measured compared with those in 1998.
Fig. 16.
Zenith angle distributions observed in SK-I+II+III during 2,806 days of the detector exposure (173 kilo-ton · year). Sub- and multi-GeV fully-contained events are defined to have the visible energy below and above 1.33 GeV, respectively. In the right most panel, PC events are added to the multi-GeV μ-like events. The dotted and solid histograms show the un-oscillated and best-fit oscillated Monte Carlo distributions, respectively.
Fig. 17.
Allowed νμ → ντ neutrino oscillation parameter regions at 68 (dashed lines) and 90% (solid lines) confidence levels (CL) from various experiments. Thick-black and thick-gray lines show the allowed regions based on the zenith-angle analysis and L/E analyses in SK-I+II+III (preliminary), respectively. Also shown are the allowed regions from K2K (thin-gray lines) and MINOS (thin-black lines) long-baseline experiments.
We note that the mixing angles are very different between those in quarks and neutrinos. sin22θ > 0.96 corresponds to θ = 39 to 51 degrees, while the corresponding mixing angle between quarks is about 2.4 degrees. This difference was not expected before the discovery of neutrino oscillations. The difference in the mixing angles may give us a hint to understand the profound relation between quarks and leptons.
6.2. Observing “oscillation”
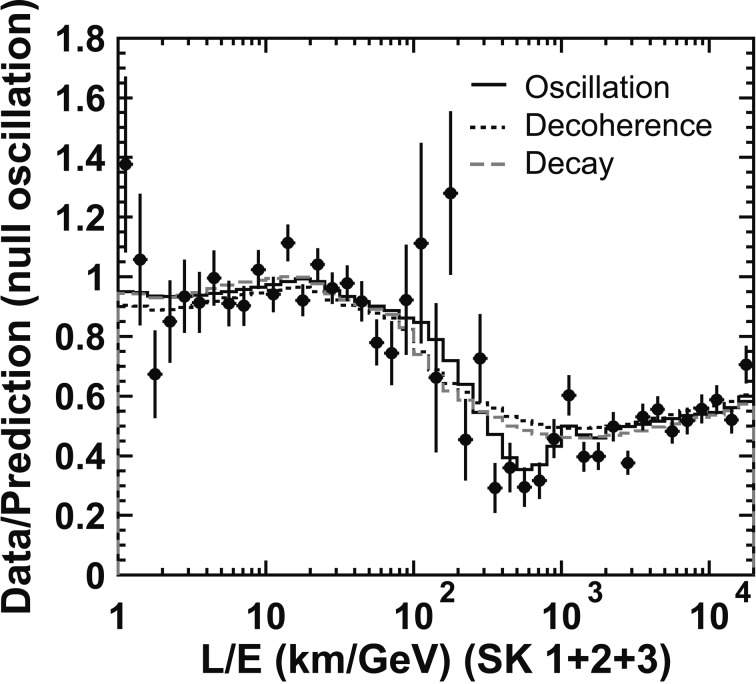
According to the neutrino oscillation formula (see Eq. [1]), the neutrino survival probability should obey the sinusoidal function. The νμ survival probability should be the minimum at a certain L/Eν value, come back to unity after traveling twice the distance, and continue oscillating. In Fig. 16, atmospheric neutrino events with various L/Eν are included in a zenith-angle bin and only an averaged survival probability is observed.
Super-Kamiokande made a special analysis that used only high L/Eν resolution events. In short, in this analysis, Super-Kamiokande did not use neutrino events whose direction is near the horizon, since the neutrino flight length (L) changes very significantly for a small change in the estimated neutrino arrival direction. Also, Super-Kamiokande did not use low energy neutrino events, since the scattering angle is large in low energy neutrinos (see Fig. 10): The uncertainty in the estimated neutrino flight length should be very large. Using high L/Eν resolution events only, it was shown that the νμ survival probability shows a dip at a position corresponding to the first minimum survival probability.35) Figure 18 shows the updated plot based on the SK-I+II+III data. This was the first evidence that the νμ survival probability obeys the sinusoidal function as predicted by neutrino oscillations. In Fig. 18, the expected νμ survival probabilities by neutrino oscillations as well as those from alternative models, which were able to explain the zenith angle distributions, are shown with the detector L/Eν resolution taken into account. It is clear that the alternative models cannot reproduce the dip seen near L/Eν = 500 km/GeV.
Fig. 18.
Data over non-oscillated Monte Carlo for the candidate charged-current νμ events are plotted as a function of L/Eν. The solid histogram shows the Monte Carlo prediction for νμ → ντ oscillations. The black-dotted and gray-dashed histograms show the Monte Carlo prediction for alternative models that were proposed to explain the zenith angle dependent deficit of the atmospheric neutrino data. Below about L/Eν less than 100, the data/MC value is about 1 indicating no oscillation effect. Near L/E = 500, there is a clear dip. Above L/Eν = 500, the data/MC value is about 0.5 corresponding to the averaged νμ → νμ survival probability. Data from SK-I+II+III are used.
6.3. Detecting tau-neutrinos
If the oscillations are between νμ and ντ, it should be possible to observe charged-current interactions of ντ generated by neutrino oscillations. A charged-current ντ interaction produces a tau lepton typically accompanied with several hadrons, most of which are pions. Due to the heavy tau mass (1.78 GeV/c2), the threshold for this interaction is about 3.5 GeV. Due to this rather high threshold together with the soft atmospheric neutrino flux, the expected event rate is only about 1 per kilo-ton per year. The rate for the charged-current ντ interactions is about 0.5% of the total atmospheric neutrino interactions. The lifetime of tau lepton is 2.9 × 10⁻¹³ sec. Hence, the produced tau lepton almost immediately decays into many hadrons plus a neutrino with the branching ratio of 65%. Therefore, a typical ντ interaction has many hadrons in the final state. On the other hand, the high-energy neutral-current interactions typically produce many hadrons in the final state. Hence, a search for ντ events in a water Cherenkov detector may not be easy due to these neutral-current background events. Figure 19 shows a simulated charged-current ντ interaction in the Super-Kamiokande detector. Compared with the images shown in Fig. 13, the event pattern is complicated with several overlapped images of Cherenkov rings in one event.
Fig. 19.
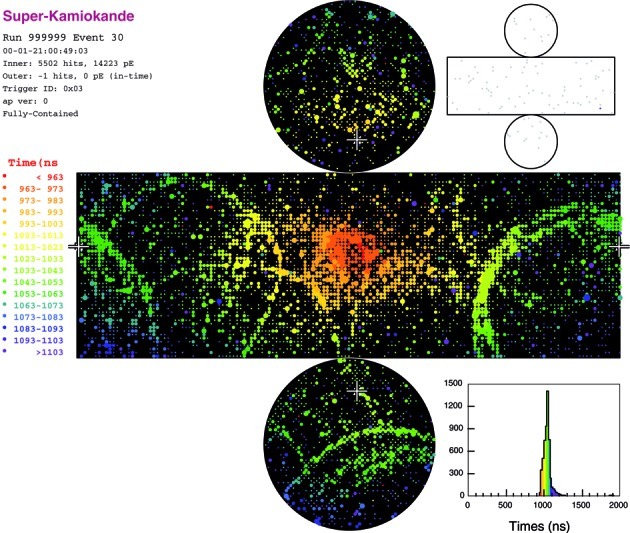
A simulated charged-current ντ interaction in the Super-Kamiokande detector.
Super-Kamiokande has searched for charged-current ντ interactions in the detector. The search was carried out using various kinematical variables with advanced statistical methods such as the maximum likelihood and artificial neural network methods. Figure 20 shows the zenith angle distribution for candidate ντ events from SK-I.36) Even with the advanced methods, there are still many background events. However, one notices that there are excess of upward going events that cannot be explained by the background events. The significance of the excess, taking various systematic uncertainties into account, is 2.4 standard deviations. The data are indeed consistent with the tau appearance due to νμ → ντ oscillations.
Fig. 20.
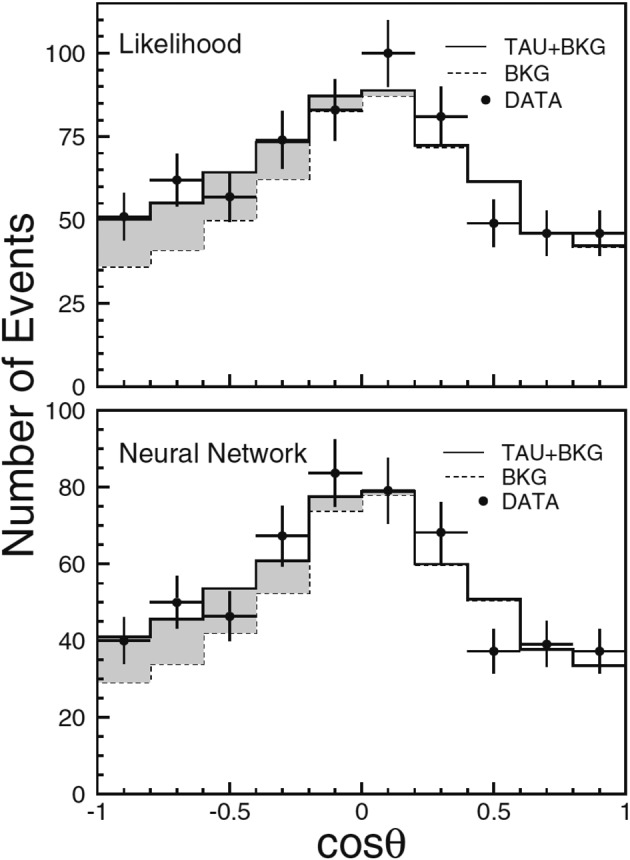
Zenith-angle distributions for the candidate ντ events selected from the data observed in SK-I.36) The upper and lower panels show the results based on the maximum likelihood and neural network methods. Circles with error bars show the data. Solid histograms show the Monte Carlo prediction with νμ → ντ oscillations but without the charged current ντ interactions. The dotted histograms show the fit result with the ντ interactions included.
6.4. Long-baseline neutrino oscillation experiments
The atmospheric neutrino beam has a wide energy spectrum and a wide path length distribution. This feature made it possible to discover neutrino oscillations. However, it is sometimes possible to carry out accurate measurements by fixing one of the experimental parameters. In a long-baseline neutrino oscillation experiment, the neutrino flight length is fixed to a single value, since the neutrino beam is produced by an accelerator and it is observed in a detector, which is located at a fixed distance from the accelerator.
K2K was the first long-baseline neutrino oscillation experiment. The neutrino beam was produced by a 12 GeV proton synchrotron at KEK, Japan. The neutrino detector, Super-Kamiokande, was located 250 km away from the target. The beam was almost a pure νμ beam, the contamination of νe being about 1%. The νμ beam had the mean neutrino energy of about 1.3 GeV. This experiment started in 1999 and continued until 2004.37) The number of predicted neutrino events to be observed in Super-Kamiokande with the K2K beam was 151−10+12 for no oscillations. The uncertainties in the predicted number show the systematic uncertainties. The observed number of neutrino events was 107 ± 10.3 (statistical error). The number of observed neutrino events showed a significant deficit compared with the prediction. Furthermore, K2K studied the neutrino energy spectrum based on the observed 58 single-ring μ-like events. The observed and un-oscillated spectra did not agree well. On the other hand, the predicted spectrum with oscillation showed much better agreement with the observation.
Another long-baseline experiment with a higher event statistics has been carried out in the United States. This experiment is called MINOS. The experiment started in 2005 and is still continuing. Neutrinos are produced by the 120 GeV Main Injector at Fermilab. The MINOS far detector is a 5.4 kton magnetized tracking detector, which is located 735 km away from the neutrino production point. The peak neutrino energy of the MINOS neutrino beam is 3 to 4 GeV. The MINOS results have been reported using data until May 2007.38) The number of observed events was 730 to be compared with the non-oscillation expectation of 936 ± 53 (systematic error). A clear deficit of events was observed with the dip position at around 1.5 to 2.0 GeV. The observed dip position made it possible to measure Δm2 accurately. The observed energy spectrum also indicated that the neutrino disappearance probability obeys sinusoidal function as predicted by neutrino oscillations.
Figure 17 shows the allowed regions of 2-flavor νμ → ντ oscillation parameters from the atmospheric and long-baseline neutrino oscillation experiments. We find that the allowed regions overlap well, suggesting further that the neutrino oscillation interpretation is valid.
After the Neutrino’98 conference, detailed studies of atmospheric neutrinos and neutrino oscillations have been carried out. These studies have established νμ → ντ neutrino oscillations generated by the neutrino masses and mixing angle.
The observation of non-zero neutrino masses was the first evidence for physics beyond the standard model of elementary particle physics. The standard model of particle physics assumes that the neutrinos have zero-mass. According to the See-Saw model2)–4) of the small neutrino masses, the masses of neutrinos and the masses of quark and charged-leptons are related simply by;
| [2] |
where mν, mq, and mN are the masses of neutrinos, quarks and yet-unknown super-heavy neutral-particles, respectively. If we assume that the observed neutrino mass squared (Δm2) is approximately equal to the square of the heaviest neutrino mass (i.e., approximately 0.05 eV/c2), one can estimate the mass of the super-heavy neutral-particle. One finds that the mass could be as heavy as 1014 to 1015 GeV/c2. Therefore, it is commonly believed that the studies of small neutrino masses are the indirect studies of physics at the very high energies. We also note that the currently estimated energy scale of the Grand Unification is 1016 GeV/c2. It is discussed seriously that the two numbers, 1014 to 1015 GeV/c2 from the neutrino mass and 1016 GeV/c2 from the estimated energy scale of the Grand Unification, are rather close and might be related. Namely, the studies of neutrino masses and related physics could be the window to study the physics at the energy scale of Grand Unification.
7. Summary
In this article, the discovery of the neutrino oscillations in atmospheric neutrino experiments is described. The L/E range in atmospheric neutrinos is very wide, corresponding to the wide neutrino mass range to be studied by oscillation experiments. Therefore, in a sense, atmospheric neutrino was a natural source to discover neutrino oscillations when the neutrino masses were unknown. It took about 10 years from the discovery of the atmospheric neutrino anomaly to the conclusion of neutrino oscillations in 1998. In the subsequent 10 year period, the data and the understanding of the neutrino oscillations were improved substantially.
It is widely believed that the discovery of the neutrino masses opened a window to new physics beyond the standard model of particle physics. In fact, the observed Δm2 suggests that the physics involved in the masses and mixing angles of neutrinos could be related to the Grand Unification of elementary particles. In particular, large mixing angle seems to be giving us some hint for our profound understanding in the relation between quarks and leptons. The small but finite neutrino masses could also be the key to the understanding of the baryon and anti-baryon asymmetry in the Universe.39) Largely motivated by these physics, various new experiments are going to start soon. Furthermore, new proposals and ideas for the future neutrino oscillation experiments have been discussed extensively. The study of neutrino oscillations will continue to be an important and exciting field.
Acknowledgements
The author would like to thank the colleagues in Kamiokande and Super-Kamiokande. In particular, the author acknowledges Prof. M. Koshiba, m.j.a., and late Prof. Y. Totsuka for many years of stimulating collaborative work. This work was partly supported by the Japanese Ministry of Education, Culture, Sports, Science and Technology, and Grant-in Aid in Scientific Research supported by the Japan Society for the Promotion of Science.
Profile
Takaaki Kajita was born in 1959. In 1981, he started his scientific career at the graduate course in the University of Tokyo under the supervision of Professor Masatoshi Koshiba. He joined the Kamiokande experiment during its construction stage. He received his Ph.D in physics from University of Tokyo in 1986. The thesis topic was a search for proton decay with the Kamiokande detector. After getting his Ph.D, he got a job at ICEPP, University of Tokyo, still continuing his research in Kamiokande. During this period, he started to concentrate on the studies of atmospheric neutrinos. In 1988, he moved to the Institute for Cosmic Ray Research (ICRR), University of Tokyo as a group member to realize the Super-Kamiokande experiment. He has been working in the Kamiokande and Super-Kamiokande experiments. Since 2008, he has been serving as director of the Institute for Cosmic Ray Research. For the studies of atmospheric neutrinos and neutrino oscillations, he received the 1999 Asahi Prize (as a member of Super-Kamiokande), the 1999 Nishina Memorial Prize, the 2002 Panofsky Prize and the 2010 Yoji Totsuka Prize.

References
- 1).Pauli W. (1930) A letter to L. Meitner and her colleagues (Open letter to the participants of the conference at Tubingen).
- 2).Minkowski P. (1977) μ → eγ at a rate of one out of 10 9 muon decays? Phys. Lett. B 67, 421–428 [Google Scholar]
- 3).Yanagida T. (1979) Horizontal gauge symmetry and masses of neutrinos. InProceedings of the Workshop on the Unified Theory and Baryon Number in the Universe (eds. Sawada O., Sugamoto A.). KEK Report No. 79–18, pp. 95–98 [Google Scholar]
- 4).Gell-mann M., Ramond P, Slansky R. (1979) Complex spinors and unified theories. InSuper-gravity (ed. van Nieuwenhuizen P., Freedman D.Z.). North-Holland, Amsterdam, pp. 315–321 [Google Scholar]
- 5).Maki Z., Nakagawa M., Sakata S. (1962) Remarks on the unified model of elementary particles. Prog. Theor. Phys. 28, 870–880 [Google Scholar]
- 6).Pontecorvo B. (1967) Neutrino experiments and the problem of conservation of leptonic charge. Zh. Eksp. Teor. Fiz. 53, 1717–1725 [(1968) Sov. Phys. JETP 26, 984–988]. [Google Scholar]
- 7).Kajita T.or the Kamiokande Super-Kamiokande collaborations (1998) talk presented at the 18th International Conference in Neutrino Physics and Astrophysics (Neutrino’98), Takayama, Japan, June 1998; Kajita, T. (for the Kamiokande and Super-Kamiokande collaborations) (1999) Atmospheric neutrino results from Super-Kamiokande and Kamiokande – Evidence for νμ oscillations. Nucl. Phys. Proc. Suppl. 77, 123–132 [Google Scholar]
- 8).Fukuda Y., Hayakawa T., Ichihara E., Inoue K., Ishihara K., Ishino H, et al. (Super-Kamiokande collaboration) (1998) Evidence for oscillation of atmospheric neutrinos. Phys. Rev. Lett. 81, 1562–1567 [Google Scholar]
- 9).Honda M., Kajita T., Kasahara K, Midorikawa S. (2004) New calculation of the atmospheric neutrino flux in a three-dimensional scheme. Phys. Rev. D 70, 043008-1-043008-17 [Google Scholar]
- 10).Barr G.D., Gaisser T.K., Lipari P., Robbins S, Stanev T. (2004) Three-dimensional calculation of atmospheric neutrinos. Phys. Rev. D 70, 023006-1-023006-13 [Google Scholar]
- 11).Battistoni G., Ferrari A., Montaruli T., Sala P.R. (2003) The FLUKA atmospheric neutrino flux calculation. Astropart. Phys. 19, 269–290 [Google Scholar]
- 12).Honda M., Kajita T., Kasahara K., Midorikawa S. (1995) Calculation of the flux of atmospheric neutrinos. Phys. Rev. D 52, 4985–5005 [DOI] [PubMed] [Google Scholar]
- 13).Smith R.A., Moniz E.J. (1972) Neutrino reactions on nuclear targets. Nucl. Phys. B43, 605–622 [Google Scholar]
- 14).Rein D., Sehgal L.M. (1981) Neutrino-excitation of baryon resonances and single pion production. Ann. Phys. 133, 79–153 [Google Scholar]
- 15).Ashie Y., Hosaka J., Ishihara K., Itow Y., Kameda J., Koshio Y, et al. (Super-Kamiokande collaboration) (2005) Measurement of atmospheric neutrino oscillation parameters by Super-Kamiokande I. Phys. Rev. D 71, 112005-1-112005-35 [Google Scholar]
- 16).Achar C.V., Menon M.G.K., Narasimhan V.S., Ramana Murthy P.V., Sreekantan B.V., Hinotani K., et al. (1965) Detection of muons produced by cosmic ray neutrinos deep underground. Phys. Lett. 18, 196–199 [Google Scholar]
- 17).Reines F., Crouch M.F., Jenkins T.L., Kropp W.R., Gurr H.S., Smith G.R. (1965) Evidence for high-energy cosmic-ray neutrino interactions. Phys. Rev. Lett. 15, 429–433 [Google Scholar]
- 18).Crouch M.F., Landecker P.B., Lathrop J.F., Reines F., Sandie W.G., Sobel H.W., et al. (1978) Cosmic-ray muon fluxes deep underground: Intensity vs depth, and the neutrino-induced component. Phys. Rev. D 18, 2239–2252 [Google Scholar]
- 19).Pati J.C., Salam A. (1973) Unified lepton-hadron symmetry and a gauge theory of the basic interactions. Phys. Rev. D 8, 1240–1251 [Google Scholar]
- 20).Georgi H., Glashow S.L. (1974) Unity of all elementary-particle forces. Phys. Rev. Lett. 32, 438–441 [Google Scholar]
- 21).Haines T.J., Bionta R.M., Blewitt G., Bratton C.B., Casper D., Claus R., et al. (1986) Calculation of atmospheric neutrino-induced backgrounds in a nucleon-decay search. Phys. Rev. Lett. 57, 1986–1989 [DOI] [PubMed] [Google Scholar]
- 22).Nakahata M., Arisaka K., Kajita T., Koshiba M., Oyama Y., Suzuki A., et al. (1986) Atmospheric neutrino background and pion nuclear effect for KAMIOKA nucleon decay experiment. J. Phys. Soc. Jpn. 55, 3786–3805 [Google Scholar]
- 23).Hirata K.S., Kajita T., Koshiba M., Nakahata M., Ohara S., Oyama Y., et al. (1988) Experimental study of the atmospheric neutrino flux. Phys. Lett. B 205, 416–420 [Google Scholar]
- 24).Aglietta M., Battistoni G., Bellotti E., Bloise C., Bologna G., Broggini C., et al. (1989) Experimental study of atmospheric neutrino flux in the NUSEX experiment. Europhys. Lett. 8, 611–614 [Google Scholar]
- 25).Berger Ch., Fröhlich M., Mönch H., Nisius R., Raupach F., Schleper P., et al. (1989) Study of atmospheric neutrino interactions with the Fréjus detector. Phys. Lett. B 227, 489–494 [Google Scholar]
- 26).Kajita T.for the Kamiokande collaboration (1990) Results from Kamiokande on solar and atmospheric neutrinos. Inthe Proceedings of the 25th International Conference on High Energy Physics, Singapore, Aug. 1990, Vol. 1, pp. 685–688 [Google Scholar]
- 27).Casper D., Becker-Szendy R., Bratton C.B., Cady D.R., Claus R., Dye S.T., et al. (1991) Measurement of atmospheric neutrino composition with the IMB-3 detector. Phys. Rev. Lett. 66, 2561–2564 [DOI] [PubMed] [Google Scholar]
- 28).Becker-Szendy R., Bratton C.B., Casper D., Dye S.T., Gajewski W., Goldhaber M., et al. (1992) Electron- and muon-neutrino content of the atmospheric flux. Phys. Rev. D 46, 3720–3724 [DOI] [PubMed] [Google Scholar]
- 29).Hirata K.S., Inoue K., Ishida T., Kajita T., Kihara K., Nakahata M., et al. (1992) Observation of a small atmospheric vμ=ve ratio in Kamiokande. Phys. Lett. B 280, 146–152 [Google Scholar]
- 30).Allison W.W.M., Alner G.J., Ayres D.S., Barrett W.L., Bode C., Border P.M., et al. (Soudan-2 collaboration) (1997) Measurement of the atmospheric neutrino flavour composition in Soudan 2. Phys. Lett. B 391, 491–500 [Google Scholar]
- 31).Fukuda Y., Hayakawa T., Inoue K., Ishida T., Joukou S., Kajita T., et al. (1994) Atmospheric vμ/ve ratio in the multi-GeV energy range. Phys. Lett. B 335, 237–245 [Google Scholar]
- 32).Allison W.W.M., Alner G.J., Ayres D.S., Barr G., Barrett W.L., Bode C, et al. (Soudan-2 collaboration) (1999) The atmospheric neutrino flavor ratio from a 3.9 fiducial kiloton-year exposure of Soudan 2. Phys. Lett. B 449, 137–144 [Google Scholar]
- 33).Ambrosio M., Antolini R., Aramo C., Auriemma G., Baldini A., Barbarino G.C., et al. (MACRO collaboration) (1998) Measurement of the atmospheric neutrino-induced upgoing muon flux using MACRO. Phys. Lett. B 434, 451–457 [Google Scholar]
- 34).Ambrosio M., Antolini R., Auriemma G., Bakari D., Baldini A., Barbarino G.C., et al. (MACRO collaboration) (2000) Low energy atmospheric muon neutrinos in MACRO. Phys. Lett. B 478, 5–13 [Google Scholar]
- 35).Ashie Y., Hosaka J., Ishihara K., Itow Y., Kameda J., Koshio Y, et al. (Super-Kamiokande collaboration) (2004) Evidence for an oscillatory signature in atmospheric neutrino oscillations. Phys. Rev. Lett. 93, 101801-1-101801-6 [DOI] [PubMed] [Google Scholar]
- 36).Abe K., Hayato Y., Iida T., Ishihara K., Kameda J., Koshio Y, et al. (Super-Kamiokande collaboration) (2006) Measurement of atmospheric neutrino flux consistent with tau neutrino appearance. Phys. Rev. Lett. 97, 171801-1-171801-6 [DOI] [PubMed] [Google Scholar]
- 37).Ahn M.H., Aliu E., Andringa S., Aoki S., Aoyama Y., Argyriades J, et al. (K2K collaboration) (2006) Measurement of neutrino oscillation by the K2K experiment. Phys. Rev. D 74, 072003-1-072003-39 [Google Scholar]
- 38).Adamson P., Andreopoulos C., Arms K.E., Armstrong R., Auty D.J., Ayres D.S., et al. (MINOS collaboration) (2008) Measurement of neutrino oscillations with the MINOS detectors in the NuMI beam. Phys. Rev. Lett. 101, 131802-1-131802-5 [DOI] [PubMed] [Google Scholar]
- 39).Fukugita M., Yanagida T. (1986) Barygenesis without grand unification. Phys. Lett. B 174, 45–47 [Google Scholar]


