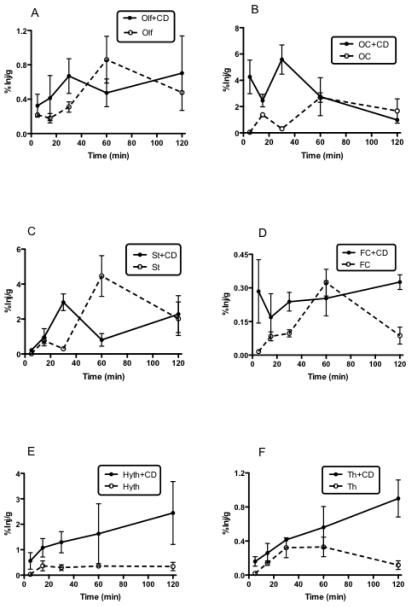
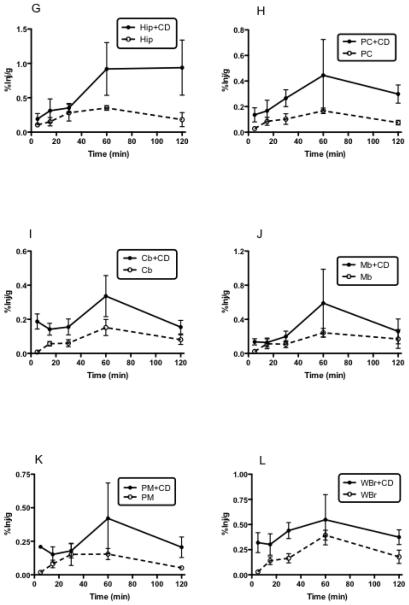
Fig. 1.
A-L. Appearance of I-PACAP in olfactory bulb (A: Olf), occipital cortex (B: OC), striatum (C: St), frontal cortex (D: FC), hypothalamus (E: Hyth), thalamus (F: Th), hippocampus (G: Hip), parietal cortex (H: PC), cerebellum (I: Cb), midbrain (J: Mb), pons-medulla (K: PM) and whole brain (L: WBr) at 5, 15, 30, 60, and 120 min after i.n. administration of I-PACAP with or without CD. The peak value without CD was at 60 min and with CD at 30 min in Olf (A), OC (B), and St (C). The peak value without CD was at 60 min and without CD at 120 min in FC (D) and Th (F). The peak value without CD was at 15 min and with CD at 120 min in Hyth (E). The peak value without CD was at 60 min and with CD at 60 min in Hip (G), PC (H), Cb (I), Mb (J), PM (K), and WBr (L).


