Abstract
Purpose:
Detonation nanodiamonds (NDs) are carbon-based nanomaterials that, because of their size (4–5 nm), stable inert core, alterable surface chemistry, fluorescence, and biocompatibility, are emerging as bioimaging agents and promising tools for the delivery of biochemical molecules into cellular systems. However, diamond particles possess a strong propensity to aggregate in liquid formulation media, restricting their applicability in biomedical sciences. Here, the authors describe the covalent functionalization of NDs with lysine in an attempt to develop nanoparticles able to act as suitable nonviral vectors for transferring genetic materials across cellular membranes.
Methods:
NDs were oxidized and functionalized by binding lysine moieties attached to a three-carbon-length linker (1,3-diaminopropane) to their surfaces through amide bonds. Raman and Fourier transform infrared spectroscopy, zeta potential measurement, dynamic light scattering, atomic force microscopic imaging, and thermogravimetric analysis were used to characterize the lysine-functionalized NDs. Finally, the ability of the functionalized diamonds to bind plasmid DNA and small interfering RNA was investigated by gel electrophoresis assay and through size and zeta potential measurements.
Results:
NDs were successfully functionalized with the lysine linker, producing surface loading of 1.7 mmol g−1 of ND. These modified NDs formed highly stable aqueous dispersions with a zeta potential of 49 mV and particle size of approximately 20 nm. The functionalized NDs were found to be able to bind plasmid DNA and small interfering RNA by forming nanosized “diamoplexes”.
Conclusion:
The lysine-substituted ND particles generated in this study exhibit stable aqueous formulations and show potential for use as carriers for genetic materials.
Keywords: disaggregation, spectroscopy, dispersion, electrophoresis, size, zeta potential
Introduction
In recent years, the scientific community has become increasingly interested in detonation nanodiamonds (NDs) because of their unique structural, chemical, optical, and biological characteristics.1 NDs were first produced in Russia in the 1960s through the incomplete combustion of carbon-containing explosives.2 While these diamond nanoparticles initially attracted the attention of the industrial world and have been utilized to improve the physical properties of polymers, the shelf life of mechanical tools, and in the electrochemical coating of metals,3 investigations into their nanoscale properties have recently placed significance on their biological applications.4–6
The most attractive feature of NDs is their uniform nanoscale size distribution. The primary particle size of a ND ranges from 4 to 5 nm,1,7,8 with a chemically inert diamond core and a shell comprising sp2-hydridized carbon structures.9 Various oxygen-containing functional groups are found on the surface of NDs,8,10,11 opening the potential for their conjugation with biochemical moieties. Surface modifications of NDs can be achieved through either a physical or a covalent (amide or ester bonding) interaction. Physical adsorption of NDs has been widely accomplished using toxins,12 proteins,13,14 chemotherapeutic drugs,5,6,15 and nucleic acids.16,17 Carboxylic18,19 and nitrogen-containing20 functional groups have been successfully grafted onto NDs using a radical generation mechanism, while alkyl-, amino-, and amino acid-functionalized diamonds have been created through the chemical modification of fluorinated NDs with alkyl lithium, ethylenediamine, or glycine ethyl ester hydrochloride, respectively.21 Moreover, NDs have also been functionalized with amino acids22 and alkyl chains23 via covalent bonding.
NDs have been found to be biocompatible with various cell lines,15,24,25 and they exhibit lower cytotoxicity than other carbon-based nanomaterials such as single- and multiwalled carbon nanotubes and carbon black.24,25 As such, they have been assessed for their ability to act as vectors for the intra-cellular delivery of drugs and biochemical molecules. It has been shown that the hydrophilic nature of NDs is responsible for improving the aqueous solubility of chemotherapeutic and anti-inflammatory drugs that have initially showed poor solubility in water.26 Indeed, chemotherapeutic drugs such as doxorubicin5 and 10-hydroxycamptothecin6 have been successfully delivered into cancer cells after being bound to NDs. This carbon nanomaterial has also been envisioned as a suitable vector for gene therapy, and polymer-coated NDs have been shown to improve the delivery of plasmid DNA (pDNA)16 and small interfering RNA (siRNA)17 into cellular systems. Contrary to self-assembling nanoparticles, NDs are attractive for use in these applications because of their ability to resist biological environmental changes, which could improve the overall delivery of the attached biomolecules.
Despite the promise NDs show as vectors for delivering small chemical drugs and large biotechnology products, it remains a challenge to obtain nanosized ND particles in laboratory and industrial settings owing to their strong tendency to assemble into micron-sized aggregates when dispersed in a polar liquid medium. As these aggregates have the potential to block capillaries, which could lead to toxic effects in the body,27 the maintenance of dispersion stability of NDs is a key requirement when developing drug delivery formulations. One way in which dispersion stability can be improved is through the use of chemical modifications such as fluorination21 and biotinylation.28 These methods have been shown to reduce the size of ND aggregates from micrometer sizes to 16021 and 170 nm,28 respectively. While a variety of mechanical disaggregation approaches have also been explored, stirred media milling and bead-assisted probe sonication were the most successful in achieving high dispersion stability and producing single-digit nanometer particle sizes.29 However, while primary-sized NDs may be attained by high-energy bead-assisted probe sonication, the potential for the contamination of samples with sonotrode material when using this technique29 is unacceptable in life science applications. To the authors’ knowledge, no previous studies have examined the disaggregation of NDs to particles less than 50 nm in size using a simple mechanochemical technique that can be applied at a laboratory level. Therefore, the purpose of this study was to generate nanosized, amino acid–functionalized particles through the covalent modification of NDs with lysine using conventional bath sonication. These functionalized NDs were found to have the ability to bind nucleic acids through electrostatic interactions and the potential to act as vectors for carrying genetic materials into cellular systems, using aqueous medium.
Material and methods
Chemicals
Pharmaceutical-grade (ND98) carboxylic acid–functionalized NDs with an average particle size of 5 nm were purchased from Dynalene Inc (Whitehall, PA). Tosoh Corporation (Grove City, OH) graciously provided YTZ® grinding media (0.05 mm). Dry dimethylformamide (DMF), 4M hydrochloric acid (HCl) (in dioxane) and ethidium bromide solution (∼1% in water) were obtained from Sigma-Aldrich (Oakville, ON, Canada). Boc-lysine(Boc)-OH, Fmoc-NH(CH2)3NH2 ·HCl, diisopropylethylamine (DIPEA), piperidine, and HATU [N,N,N′,N′-tetramethyl-O-(7-azabenzotriazol-1-yl)uronium hexafluorophosphate] were obtained from Chem-Impex International, Inc (Wood Dale, IL). Dichloromethane (DCM) (high-performance liquid chromatography grade) was purchased from Thermo Fisher Scientific (Waltham, MA) and was dried using a solvent purification system (MBraun Incorporated, Stratham, NH). Thionyl chloride was acquired from Alfa Aesar (Ward Hill, MA). The pGTCMV.IFN-GFP plasmid (encoding for interferon gamma and green fluorescent protein genes)30 was used as a model plasmid for examining the binding properties of NDs. Anti-GFP siRNA was purchased from Ambion® (Life Technologies Inc, Burlington, ON, Canada). Gibco® UltraPure DNase/RNase-free water was obtained from Invitrogen (Life Technologies Inc, Burlington, ON, Canada). All chemicals were at ≥99% purity.
Preparation and functionalization of NDs with lysine
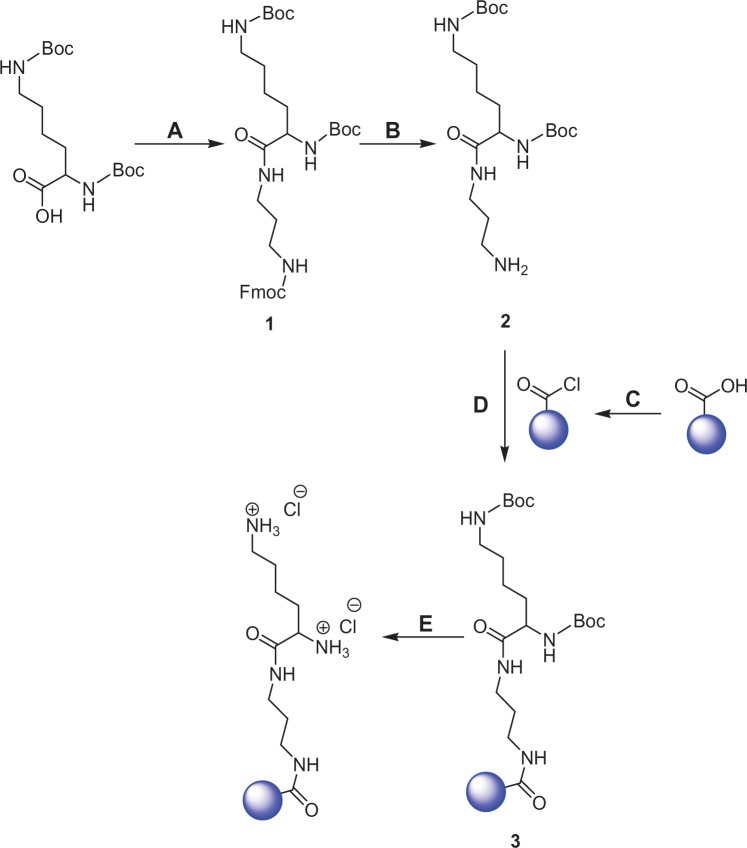
Unless otherwise stated, all reactions (Figure 1) were carried out under a nitrogen atmosphere using standard Schlenk techniques. Ultrasonication was performed using a bath sonicator in some steps of the reaction scheme in order to improve the accessibility of chemical reagents to the surfaces of the nanosized particles.
Figure 1.
Preparation and functionalization of nanodiamonds (NDs) with lysine in the presence of a three-carbon-length linker: (A) synthesis of compound 1 [N′-(Nα,Nε-bis-Boc-lysyl),N″-(Fmoc)-diaminopropane], reagents, and solvents – Fmoc-NH(CH2)3NH2 · HCl, HATU [N,N,N′,N′-tetramethyl-O-(7-azabenzotriazol-1-yl) uronium hexafluorophosphate], diisopropylethylamine, and dimethylformamide (DMF); (B) Fmoc deprotection, reagents, and solvents – 50% (v/v) piperidine-DMF; (C) reoxidation of pristine carboxylated NDs, reagents – concentrated sulfuric acid and concentrated nitric acid, and preparation of acid chloride–functionalized NDs, reagents – thionyl chloride; (D) synthesis of Boc-protected lysine-functionalized NDs, solvent – DMF; (E) deprotection of Boc on lysine-functionalized NDs, reagents, and solvents – hydrochloric acid and dichloromethane.
Step A: synthesis of N′-(Nα,Nε-bis-Boc-lysyl),N″-(Fmoc)-diaminopropane
In a dry Schlenk flask, Boc-lysine(Boc)-OH (8.661 mmol) was dissolved in dry DMF (15 mL), followed by the addition of HATU (10.82 mmol) and DIPEA (17.97 mmol). The reaction mixture was then stirred for 15 minutes before the addition of a 10 mL solution of Fmoc-NH(CH2)3NH2 ·HCl (9.925 mmol) and DIPEA (10.92 mmol) in DMF. After 18 hours, DMF was removed from the reaction mixture under high vacuum, and the sample was dissolved in DCM (100 mL) and extracted with a saturated aqueous solution of sodium bicarbonate (4 × 100 mL). The organic phase was dried with sodium sulfate before removing the DCM under vacuum. Upon further purification by column chromatography (Silica Gel 60, EMD Inc, Mississauga, ON, Canada) using a methanol-chloroform (1:9, v/v) solvent system, a pale yellow solid compound, N′-(Nα,Nε-bis-Boc-lysyl),N″-(Fmoc)-diaminopropane (hereafter called compound 1), was obtained with a yield of 79%.
Step B: Fmoc deprotection of compound 1
The removal of Fmoc from compound 1 was carried out using 300 mg of the compound and 10 mL of a 50% (v/v) piperidine-DMF mixture. The recovered compound (hereafter called compound 2) was used in step D without further purification.
Step C: reoxidation of NDs and preparation of acid chloride–functionalized NDs
In order to optimize the surface functionalization of the pristine carboxylated NDs (pNDs), they were reoxidized in a mixture of concentrated nitric and sulfuric acids (1:3, v/v) with overnight ultrasonication.31–33 The reoxidized NDs (rNDs) were subsequently dialyzed with water using a cellulose membrane with an average pore radius of 2.4 nm until neutral pH was achieved, and then they were freeze-dried. To promote amide bond formation between the NDs and compound 2, the surface carboxylic acid groups of the rNDs were converted into more reactive acyl chloride functional groups using an excess of thionyl chloride34–36 in the presence of YTZ grinding media. This mixture was ultrasonicated at a frequency of 25 kHz in a bath sonicator (Transsonic TI-H-5 Ultrasonicator; Elma Hans Schmidbauer GmbH and Co KG, Singen, Germany) for 22 hours, refluxed for 5 hours at 70°C, and ultrasonicated for 48 hours. Finally, the sample was dried overnight under high vacuum.
Steps D and E: preparation of lysine-functionalized NDs
Compound 2 was dissolved in 10 mL of DMF and added to the acid chloride–functionalized NDs (100 mg) suspended in 5 mL of DMF. The heterogeneous mixture was refluxed for 45 minutes at 75°C, ultrasonicated for 72 hours, and lyophilized. Boc removal (step E, Figure 1) was achieved by suspending the Boc-protected lysine-functionalized NDs (fNDs) in 10 mL of DCM and 10 equivalents of HCl (4 M in dioxane)37 for 90 minutes. This produced positively charged fNDs capable of electrostatic interactions with the negatively charged phosphate groups of DNA. The fNDs were dialyzed with ethanol followed by water, using a cellulose membrane with an average pore radius of 2.4 nm, before being freeze-dried.
Nuclear magnetic resonance and mass spectroscopic characterization of compound 1
Proton nuclear magnetic resonance (1H NMR) spectra were recorded on a Bruker 500 MHz Avance spectrometer (Bruker BioSpin, Milton, ON, Canada). Chemical shifts for 1H NMR are reported in ppm in reference to the residual 1H resonances of deuterated chloroform at δ 7.26. Mass spectrum was obtained using the QSTAR® XL MS/MS System (ESI-Q-TOF) (Applied Biosystems, Toronto, ON, Canada).
ND dispersions
NDs (2 mg/mL) in reverse osmosis-purified water (Millipore, Milford, MA) were ultrasonicated at a frequency of 25 kHz for 4 hours and centrifuged at 5200 g for 6 minutes. The resulting dispersions were used for Raman spectroscopy, atomic force microscopy (AFM), gel electrophoresis, and zeta potential and size distribution measurements. For the dispersion stability experiment, the ND samples were sonicated for 20 minutes and allowed to settle for 3 days at room temperature without centrifugation.
Raman spectroscopic measurements
Raman spectroscopic measurements were carried out using a Renishaw Invia Reflex microscope (Renishaw Inc, Chicago, IL) fitted with a 514.5 nm argon ion laser (Spectra-Physics® 163-M42-010 Spectra Physics®, Santa Clara, CA) and 1800 line/mm grating. Aqueous dispersions of NDs were dropped onto a gold-coated silicon wafer (Platypus Technologies, Madison, WI) and allowed to dry. A Leica N PLAN Objective (Leica Microsystems, Buffalo Grove, IL) 50× with a numerical aperture of 0.75 was used to focus the sample, and backscattered Raman signals were detected using a Peltier-cooled charge-coupled device. Instrument calibration was verified using an internal silicon wafer, measured at 520 cm−1. The Raman spectra of NDs and compound 1 were acquired in the static scanning mode. Baseline correction was performed using Renishaw WiRE software (v3.2; Renishaw Inc).
Infrared spectroscopy
Infrared (IR) spectra of all materials were recorded on a Bruker IFS 66v/S Fourier transform spectrometer (Bruker Optics, Billerica, MA) in the mid-IR range using a liquid nitrogen–cooled mercury cadmium telluride detector at the Canadian Light Source, University of Saskatchewan, Saskatoon, SK, Canada. All sample measurements were carried out in the solid state using pelletized, homogeneous powder dispersions of the materials in a potassium bromide matrix. For compound 1, a PIKE MIRacle™ Single Reflection ATR (PIKE Technologies, Madison, WI) accessory was used in order to avoid potential pressure-induced changes. In all cases, 512 individual interferograms were averaged for both the background and the sample measurements from which the absorbance spectra were calculated.
Data analysis was performed with the Bruker OPUS software package (v6.5; Bruker Optics). Baseline correction was performed on all raw absorbance spectra using the built-in concave rubber band correction routine (number of baseline points: 32; number of iterations: 2) to strictly avoid the introduction of any artificial features into the spectra.
Size and zeta potential measurements
Particle size and zeta potential measurements were obtained using a Malvern Zetasizer Nano ZS instrument (Malvern Instruments Ltd, Malvern, Worcestershire, UK). The size distribution of NDs in water was obtained by measuring the light scattered (θ = 173°) by particles (dynamic light scattering, DLS) illuminated with a laser beam, using the CONTIN algorithm to analyze the decay rates that are a function of the translational diffusion coefficients of the particles, D. The measured data are reported in volume distribution. The hydrodynamic radius, RH, of the particles was estimated using the Stokes-Einstein equation (RH = kT/6πηD), where k is the Boltzmann constant, T is the temperature, and η is the viscosity of the solution. This analysis gives an estimate of size based upon the hydrodynamic radius of spherical particles having a translational diffusion coefficient equivalent to the actual particles. Size distribution values were derived from three measurements, each consisting of a minimum of ten individual runs.
Zeta potential measurements were based upon laser Doppler electrophoresis and phase analysis light scattering analysis. The reported zeta potentials are the average of three measurements, each derived from a minimum of ten individual runs.
AFM
AFM images were obtained in intermittent contact mode using an atomic force microscope (Agilent 4500; Agilent Technologies, Inc, Chandler, AZ) equipped with a silicon cantilever (T190R; Nanoscience Instruments, Inc, Phoenix, AZ). The specifications of the silicon cantilever include a force constant of approximately 45 N/m and a resonant frequency of approximately 190 kHz. A small volume (25 μL) of ND dispersion samples was dropped onto a freshly prepared poly-L-lysine-coated mica substrate and allowed to incubate for 1 minute. The substrate was then rinsed with purified water and dried gently using a stream of nitrogen gas. The amplitude range was between 1 and 1.5 V for all measurements, while the amplitude ratio for set point to free air oscillation was 0.80. Ambient conditions were maintained throughout the experimental procedure, and the scan rate used for image acquisition ranged from 0.5 to 1 lines per second (512 pixels per line). Line scan profiles were obtained for three particles from each sample, and the reported particle sizes were determined from the particle height (SPIP, v5.1.6; Image Metrology A/S, Lyngby, Denmark).
Thermogravimetric analysis
Thermogravimetric analysis was carried out using a TGA Q50 (TA Instruments-Waters LLC, New Castle, DE). The furnace tube carrying the sample was heated to 450°C, and the percentage weight loss was obtained as a function of the temperature. The surfaces of the pNDs and rNDs were considered dominated by carboxylic acid functional groups, and surface loading was calculated using the following equation:
Any loss in weight that occurred below 115°C was attributed to water and was excluded from estimates of surface loading.
Agarose gel electrophoresis
Electrophoresis was performed in 1% (for pDNA) or 2% (for siRNA) agarose gels prepared with tris-acetate ethylenediaminetetraacetic acid buffer and ethidium bromide at a final concentration of 1 μg/mL. The amounts of pDNA and siRNA in each sample were 500 and 400 ng, respectively. Complexes of fNDs-pDNA and fNDs-siRNA with different weight ratios (fNDs:nucleic acid component ranging from 1:1 to 50:1) were prepared in ultrapure water and incubated for 30 minutes at room temperature. Uncomplexed pDNA and siRNA were used as standards. All samples were loaded into the gel using 30% glycerol and were subjected to electrophoresis at 100 V using a Bio-Rad PowerPac HC electrophoresis apparatus (Bio-Rad Laboratories, Inc, Mississauga, ON, Canada) for 1 hour for pDNA or 45 minutes for siRNA. The gels were then imaged using an AlphaImager® imaging system (Alpha Innotech Corporation, San Leandro, CA) to detect ultraviolet fluorescence.
Size and zeta potential measurements of fND-pDNA and fND-siRNA complexes
Size and zeta potential measurements of fND-genetic material complexes formed at weight ratios in the range between 1:1 and 50:1 were performed using the Zetasizer Nano ZS (Malvern Instruments Ltd). Different sets of samples were prepared for analysis of size and zeta potential using the same sample preparation technique as described for agarose gel electrophoresis assay. Each reported value was obtained from the Z-average size, and each value is the average of four measurements, each consisting of a minimum of ten individual runs.
Results and discussion
Synthesis of fNDs
The synthesis of the lysine linker intermediate (compound 1) and its subsequent covalent functionalization with NDs was performed (Figure 1). The 1H NMR spectrum of compound 1 was used to established its structure: 1H NMR (500 MHz, deuterated chloroform) δ7.76(d, J = 7.5, 2H, fluorenyl), 7.61 (d, J = 7.4, 2H, fluorenyl), 7.39 (t, J = 7.5, 2H, fluorenyl), 7.31 (t, J = 7.4, 2H, fluorenyl), 6.67(s, 1H, NH), 5.48(s, 1H, NH), 5.23(s, 1H, NH), 4.67(s, 1H, NH), 4.38(d, J = 7.0, 2H, fluorenyl-CH2), 4.21(t, J = 7.0, 1H, fluorenyl-CH), 4.04(s, 1H), 3.28 (m, 2H), 3.20(m, 2H), 3.10(m, 2H), 1.63–1.82(m, 4H), 1.48 (m, 2H), 1.43(s, 18H, Boc-(CH3)6), 1.37(m, 2H) (Figure S1). The successful synthesis of compound 1 was also confirmed by mass spectroscopic measurements: electrospray ionization mass spectrometry mass-to-charge ratio calculated for C34H48 N4O7: 624.3523 [M], found 625.3603 [M+1]+ (Figure S2).
Surface functionalization assessed by Raman spectroscopy, IR spectroscopy, zeta potential, and thermogravimetric measurements
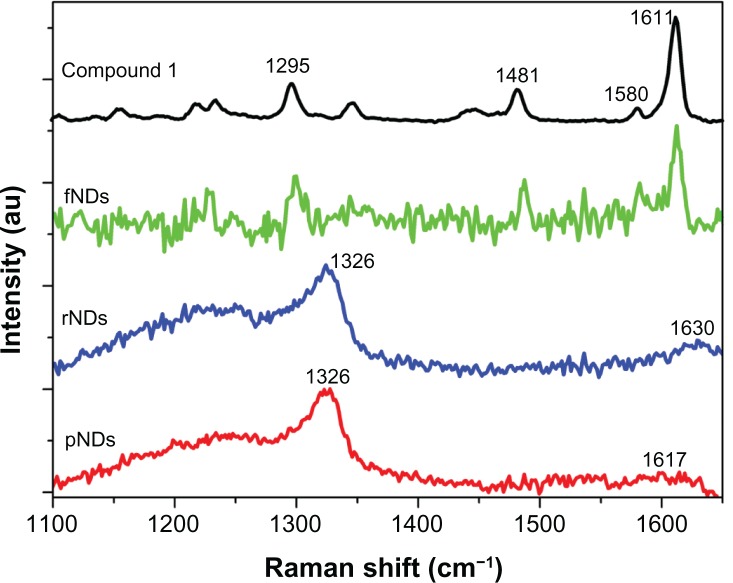
To provide evidence of functionalization of NDs with the lysine linker, Raman spectroscopy of pNDs, rNDs, fNDs, and compound 1 was performed (Figure 2). The pNDs showed the signature peak of diamond at 1326 cm−1, which is downshifted in frequency compared with the 1332 cm−1 Raman peak assigned to bulk diamond.38 This frequency shift could be attributed to the smaller size of NDs, as explained by the phonon confinement model.39,40 Furthermore, the existence of the diamond peak at ∼1326 cm−1 after the reoxidation process suggests that the intrinsic diamond structure was unaltered by the harsh acidic oxidation conditions. A broad peak was also observed at 1617 cm−1 on the pND spectra, which could have arisen because of overlapping signals from the in-plane stretching of the sp2 carbon (G-mode) at ∼1590 cm−1, oxygen-hydrogen (O-H) bending at ∼1635 cm−1, and carbon-oxygen double bond stretching of the carboxylic acid group at ∼1740 cm−1.41 The suppression of the D-band of graphitic carbon (∼1410 cm−1) in the Raman spectra of pristine and reoxidized NDs supports the existence of high ratios of sp3/sp2 carbon in NDs.42 After reoxidation, the emergence of a prominent band at ∼1630 cm−1 was accompanied by a decrease in the 1590 cm−1 band of graphitic carbon, supporting the use of mineral acids in the oxidation of graphitic carbon. Raman spectroscopy was not used to monitor carboxylic acid vibrations in any of the samples.
Figure 2.
Baseline-corrected static scan Raman spectra of the pristine carboxylated nanodiamonds (pNDs), reoxidized nanodiamonds (rNDs), lysine-functionalized nanodiamonds (fNDs), and compound 1 [N′-(Nα,Nε-bis-Boc-lysyl),N″-(Fmoc)-diaminopropane] using a 514.5 nm excitation source. A total of 128 accumulations were collected for pNDs and rNDs, while the spectrum of fNDs was obtained from a single acquisition.
The Raman spectrum of compound 1 revealed noticeable peaks of carbon-hydrogen (C-H) deformation at ∼1481 cm−1, amide III at ∼1295 cm−1, and amide I at ∼1611 cm−1, with a weak shoulder representing amide II observed at ∼1580 cm−1. It is important to note that the fND spectrum was acquired by a single scan, as additional laser scanning resulted in burning of the fNDs. In comparison with the Raman spectrum of compound 1, the Raman spectrum of the fNDs exhibited amide I (∼1612 cm−1), amide II (∼1582 cm−1), amide III (∼1299 cm−1), and C-H deformation (∼1482 cm−1) peaks, indicating that the functionalization had been successful. The Raman peak of fNDs at 1299 cm−1 is very broad in comparison with the corresponding peak of compound 1 because of interference from the diamond signal. Furthermore, the covalent modification of the NDs with the lysine linker, which has a much higher mass than carbon, caused a further downshift in the frequency of the diamond signal in fNDs.
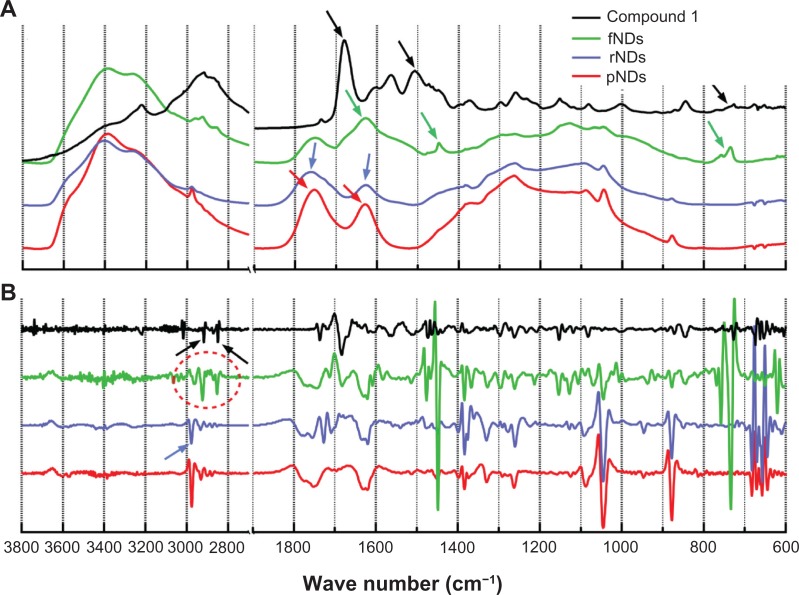
Overall, the Raman spectra obtained in this study support the successful formation of fNDs; however, as the Raman cross section is smaller than the fluorescence cross section, it is likely that fluorescence swamps the Raman signals. Hence, to strengthen the evidence of successful functionalization, IR spectroscopy, a complementary technique to Raman spectroscopy, was performed at various stages of functionalization, including on compound 1 (Figure 3A). Band positions are indicated by the second derivative curves (Figure 3B). The ND spectra showed that characteristic bands at ∼1045 cm−1 and ∼1262 cm−1 due to vibrations of ether-like groups43 might arise from the covalent bonding of inter-particular carboxylic and/or hydroxyl groups, as well as bands in the C-H stretching region at ∼2900 cm−1 due to vibrations arising from the C-H bonds present on the surface of the NDs. In fact, a very broad IR spectrum ranging from 1000 to 1500 cm−1 is identified as the “fingerprint region” of NDs in the literature.42 It is important to note that all ND spectra were found to have features in the carbonyl region (∼1760 cm−1), suggesting that the raw material was already somewhat oxidized. The peaks at ∼1630 cm−1 (O-H bending) and ∼3400 cm−1 (O-H stretching) may have originated because of either the water adsorbed onto the NDs/potassium bromide or the presence of covalently bonded hydroxyl functional groups on the surface of the NDs.
Figure 3.
Baseline-corrected absorbance and attenuated total reflectance: (A) infrared spectra of the pristine carboxylated nanodiamonds (pNDs), reoxidized nanodiamonds (rNDs), lysine-functionalized nanodiamonds (fNDs), and compound 1 [N′-(Nα,Nε-bis-Boc-lysyl),N″-(Fmoc)-diaminopropane]; (B) second derivatives of all spectra.
Notes: A total of 512 individual interferograms were collected and averaged for each sample. The featureless region between wave numbers of 2700 and 1900 cm−1 is not shown.
Comparing the spectra of fNDs with those of pNDs and rNDs, it is evident from both the peak height and shape of the band located at ∼1630 cm−1 that the functionalization reaction was successful. The presence of an amide I band from ∼1640 to 1690 cm−1 and an amide II shoulder from ∼1510 to 1580 cm−1 in the fND spectrum provide further evidence of functionalization. These bands were also observed in the compound 1 spectrum at a slightly higher frequency. The peak at ∼730 cm−1 in the spectra of both fNDs and compound 1 is associated with the rocking mode of hydrocarbons with more than four methylene groups,44 while a methylene deformation band can be observed at ∼1465 cm−1. A combination of the spectra of the two starting materials (rNDs and compound 1) was recognizable in the C-H stretching region of the second derivative spectra (Figure 3B, red oval shape), further verifying the lysine functionalization of NDs.
The successful functionalization of NDs with lysine was also confirmed by the zeta potential measurements (Table 1). The pNDs showed a negative zeta potential of −21.1 mV, suggesting that negatively charged surface functional groups such as carboxylate were present. After reoxidation, the mean zeta potential shifted to −23.7 mV, indicating a slight increase in the density of negatively charged surface groups. As expected, the lysine-modified NDs showed a positive zeta potential of +48.9 mV, demonstrating the predominance of a large number of positively charged (amine) groups on their surfaces.
Table 1.
Zeta potential measurements of nanodiamonds (NDs)
| Sample | Zeta potential (mV) in reverse osmosis-purified water |
|---|---|
| pNDs | −21.1 ± 0.2 |
| rNDs | −23.7 ± 0.5 |
| fNDs | 48.9 ± 0.1 |
Note: Each value represents the mean plus or minus standard deviation of three measurements (n ≥ 10).
Abbreviations: pNDs, pristine carboxylated nanodiamonds; rNDs, reoxidized nanodiamonds; fNDs, lysine-functionalized nanodiamonds.
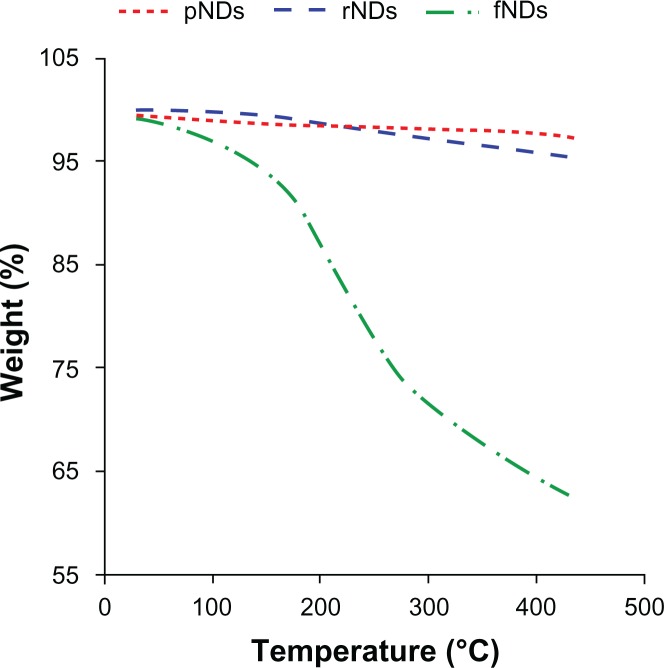
Thermogravimetric analyses were performed to provide quantitative estimates of the surface loading of functional groups attached to the NDs. The thermograms of the pNDs and rNDs did not show any considerable weight loss in the temperature range of 30°C–440°C, indicating that NDs are thermally stable in this range (Figure 4). The surface loading of the pNDs, rNDs, and fNDs was calculated (Table 2) from their respective thermograms. Providing that the surfaces of pNDs and rNDs are dominated by carboxylate groups, the estimated surface coverage was 0.35 mmol g−1 for the pNDs and 1.0 mmol g−1 for the rNDs, while the fNDs demonstrated surface loading of 1.7 mmol g−1 of ND. This coverage is greater than was found in a previously reported study of the covalent functionalization of long-chain alkyl groups on the surface of NDs (0.3–0.4 mmol g−1).23 The high surface functionalization confers high nucleic acid–binding capacity to the nanomaterial.
Figure 4.
Thermograms of pristine carboxylated nanodiamonds (pNDs), reoxidized nanodiamonds (rNDs), and lysine-functionalized nanodiamonds (fNDs).
Table 2.
Surface loading of nanodiamonds (NDs), as calculated from their respective thermograms
| Sample | Surface loading (mmol/g) |
|---|---|
| pNDs | 0.35 |
| rNDs | 1.00 |
| fNDs | 1.70 |
Note: Weight loss below 115°C is excluded.
Abbreviations: pNDs, pristine carboxylated nanodiamonds; rNDs, reoxidized nanodiamonds; fNDs, lysine-functionalized nanodiamonds.
Dispersion of NDs in aqueous medium and AFM imaging
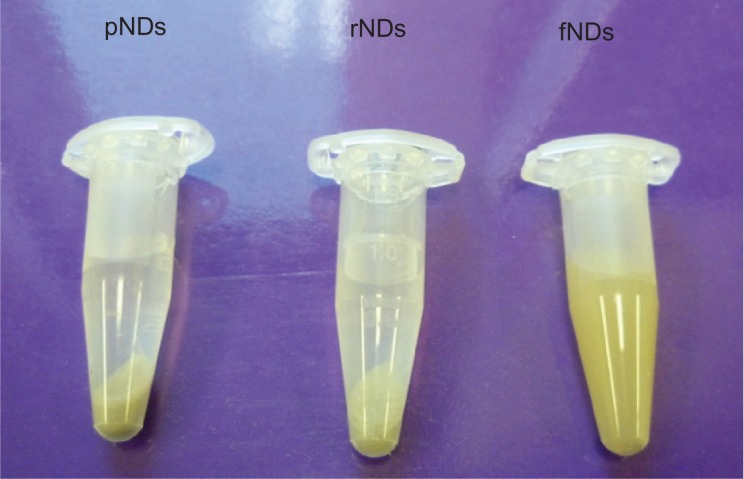
For biomedical applications, the stability of the biomaterial in aqueous medium is of paramount importance, as aggregation can lead to toxic effects in biological systems. In this study, the pND, rND, and fND samples were dispersed in water and the stability of the resultant hydrosols was monitored for 3 days. While sedimentation of the pND and rND hydrosols was observed to occur within the first 5 minutes of incubation, fNDs remained stable even after 3 days (Figure 5). This was in agreement with the results of the authors’ zeta potential measurements, which also indicated that fNDs have colloidal stability in water. According to the DLVO theory (Derjaguin-Landau-Verwey-Overbeek), repulsive forces dominate among particles in systems with a zeta potential higher than 30 mV (49 mV for the fNDs), which prevents aggregation and flocculation of the colloidal system.45 The high aqueous dispersibility of fNDs may be explained by the greater hydrophilicity of the lysine hydrochloride functional groups found on their surfaces,46 as well as inter-particle repulsion due to the positively charged amine groups of lysine. On the other hand, the sedimentation of pNDs and rNDs is most likely due to van der Waals’ forces, dipole-dipole interactions, and/or hydrogen bonding between the surface functional groups. A similar dispersion behavior has been shown to occur with adenosine-functionalized multiwalled carbon nanotubes, which exhibit greater aqueous solubility than pristine, reoxidized forms.32
Figure 5.
Dispersion of 2 mg/mL nanodiamonds (NDs) in water after 20 minutes of conventional bath sonication and 3-day incubation.
Abbreviations: pNDs, pristine carboxylated nanodiamonds; rNDs, re-oxidized nanodiamonds; fNDs, lysine-functionalized nanodiamonds.
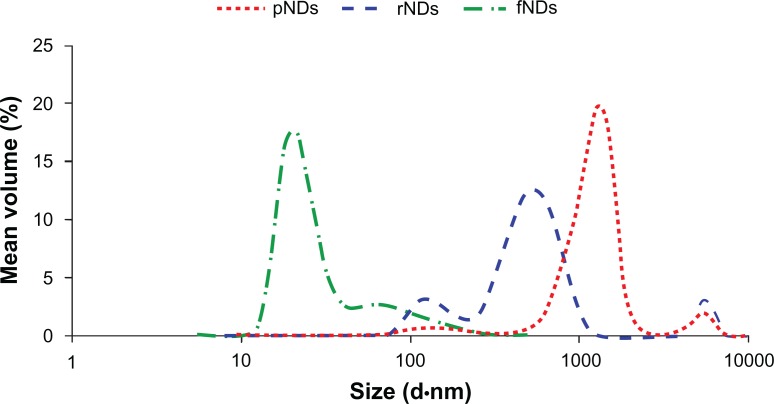
Particle size is also considered to be an important parameter in the development of bionanomaterials. Therefore, hydrodynamic particle size measurements were carried out in this study to gain more insight into the suitability of fNDs for use in gene delivery applications (Figure 6). The pNDs were found to have a very wide size distribution (polydispersity index [PDI] = 0.56) when dispersed in aqueous medium, with a major fraction of the particles having size distributions centered at 1281 nm. Reoxidation did not improve the particle dispersibility considerably; while a shift towards smaller size with a peak at 531 nm was observed, the broadness in the size distribution was maintained (PDI = 0.59). No NDs smaller than 50 nm in diameter were detected in either pND or rND samples. In addition to the physical inter-particle interactions that cause agglomeration of pristine and reoxidized NDs, the surface carboxylate groups can also result in the formation of tightly bound aggregates via anhydride bond formation.22 In contrast, when the size of the fNDs was examined, the surface functionalization was found to result in a remarkable reduction in aggregate size, with the majority of particles centering at 21 nm. A narrower size distribution (PDI = 0.25) was also observed when compared with the pND and rND particle distributions. The fNDs in this study were also found to have considerably smaller hydrodynamic radii than those obtained in a previous study that functionalized NDs with glycine through a silane linker (peak at >350 nm).22 The disaggregation of fNDs also contributes to their dispersion stability in aqueous media.
Figure 6.
Size distributions of pristine carboxylated nanodiamonds (pNDs), reoxidized nanodiamonds (rNDs), and lysine-functionalized nanodiamonds (fNDs) in water, as measured by dynamic light scattering.
Note: Each curve is derived from three measurements (n ≥ 10).
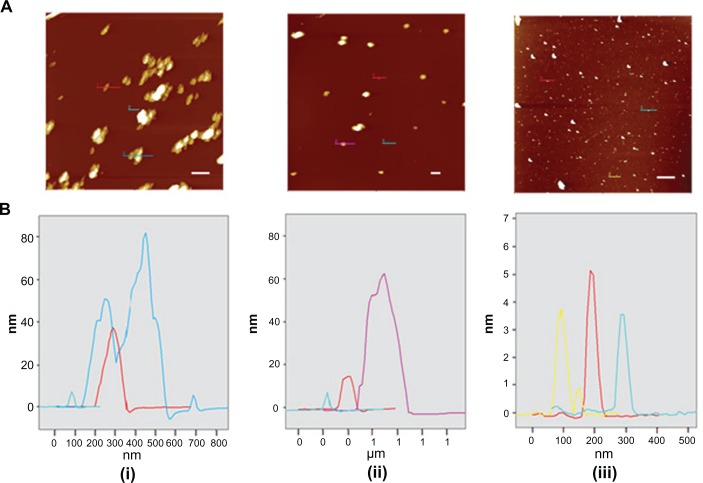
AFM was used to determine the topographic features (Figure 7A) and size (Figure 7B) of pNDs (i), rNDs (ii), and fNDs (iii). Since substrate surface features and drying could cause aggregation of the particles, the height rather than the diameter is reported for particle size. The pNDs formed irregularly shaped aggregates of 40–80 nm, while the rNDs appeared to be round with a comparatively smaller aggregate size of 20–60 nm. In agreement with the DLS measurements, AFM images provided visual evidence for the disaggregation of NDs after their functionalization with the lysine linker (Figure 7A, iii). The particles of fNDs were found to be 3–5 nm in size. Besides aggregation on a solid mica surface, the environment of the sample and the principle of the measurement technique can also influence the size determination of particles, as can be observed in the differences in particle sizes determined by DLS and AFM. DLS measures the average hydrodynamic radius of nanoparticles in liquid medium under the assumption that they are spherical in shape, while AFM measures the height and diameter of individual particles devoid of their native environment. The different principles utilized by these two techniques for size determination have also been considered to be a cause of size variation in an earlier study.47
Figure 7.
(A) Intermittent contact mode atomic force microscopy topographic images of nanodiamond samples and (B) line-scan profiles of the particles indicated in each image. From left to right: (i) pristine carboxylated, (ii) reoxidized, and (iii) lysine-functionalized nanodiamonds.
Note: The bar (solid white line) represents 500 nm.
Binding of fNDs to nucleic acids
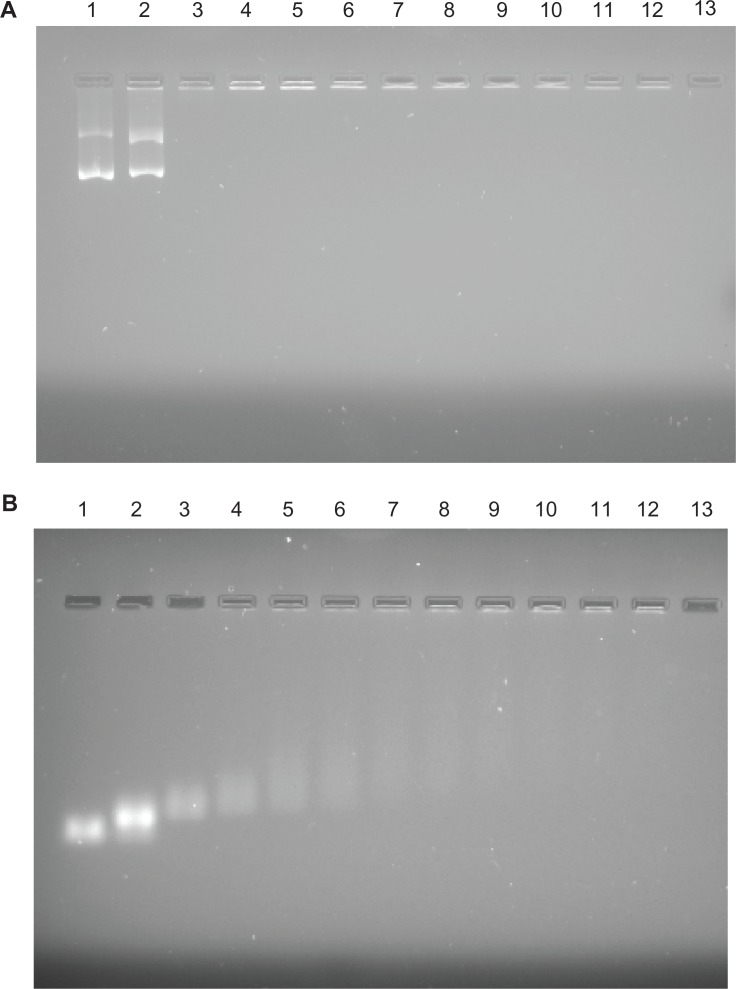
As the nanosize, positive zeta potential, and hydrophilic properties of fNDs suggest that they may be suitable for use in biomedical applications, the applicability of fNDs as nonviral vectors was evaluated by examining their ability to bind and protect pDNA and siRNA. Weak binding can lead to the disruption of vector–nucleic acid complexes by negatively charged protein molecules, leading to inefficient gene delivery.48 Therefore, the binding stability of complexes is essential for the protection of genetic material against enzymatic degradation and the production of high levels of gene expression in cellular systems.30 In this study, the binding efficacy of the fNDs for genetic material was examined by carrying out gel electrophoresis assays on a series of fNDs:pDNA (Figure 8A) and fNDs:siRNA (Figure 8B) weight ratios. The naked pDNA revealed two major bands (Figure 8A, lane 1), corresponding to the two different forms of pDNA: a highly mobile supercoiled form and a lesser mobile band representing the circular form. The complexes obtained by using equal weight ratios of fNDs and pDNA were not stable, as the migration of pDNA was not hindered (Figure 8A, lane 2). However, no pDNA bands were detected at fNDs:pDNA weight ratios of 5:1 and above (lanes 3–12), indicating that the formation of a complex between the pDNA and the fNDs hampered its migration towards the anode. For siRNA (Figure 8B), the trend of binding was found to be similar; however, complex formation was comparatively less efficient than that observed with pDNA, as siRNA was detected in its free form at weight ratios of 5:1 (Figure 8B, lane 3) and 10:1 (lane 4). The band intensity gradually decreased with an increase in the amount of fNDs, and only a negligible amount of siRNA was detected in its free form at weight ratios of 20:1 and higher (lanes 6–12).
Figure 8.
Results of agarose gel electrophoresis of (A) lysine-functionalized nanodiamond (fND)–plasmid DNA and (B) fND–small interfering RNA complexes (“diamoplexes”) with increasing weight ratios of fNDs to nucleic acid: 1:1 (lane 2), 5:1 (lane 3), 10:1 (lane 4), 15:1 (lane 5), 20:1 (lane 6), 25:1 (lane 7), 30:1 (lane 8), 35:1 (lane 9), 40:1 (lane 10), 45:1 (lane 11), and 50:1 (lane 12). Lane 1 consists of standard nucleic acid only, and lane 13 is empty.
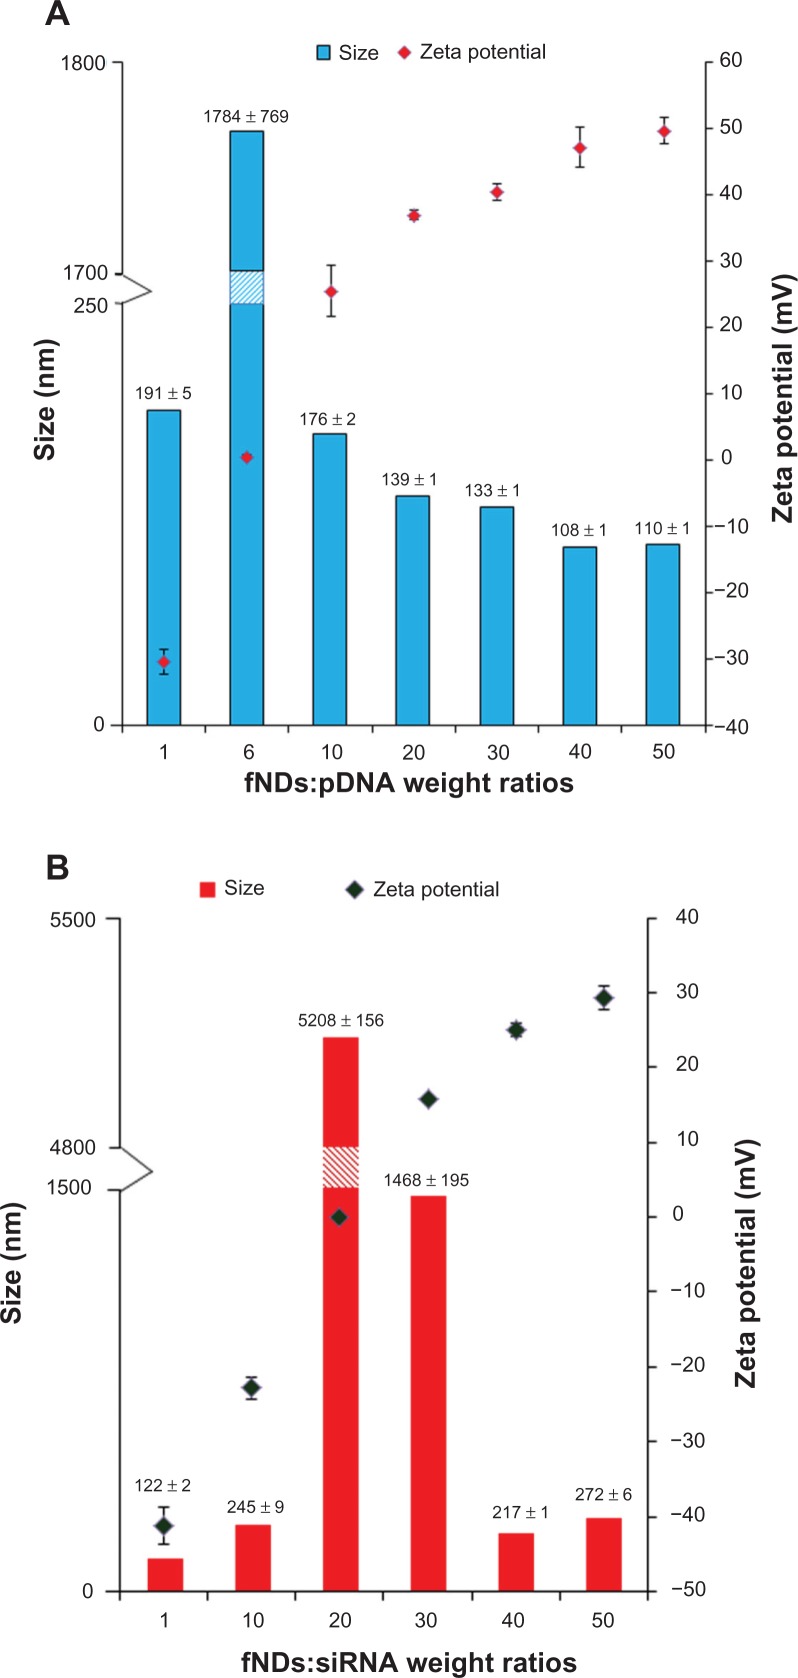
As the size of a nanomaterial–nucleic acid complex can also have a pronounced impact on transfection efficacy, a delivery agent should condense genetic material to prevent its degradation by nucleases and promote cellular internalization. A size in the range of 100–300 nm is considered optimal for producing efficient transfection.49 In addition to appropriate size, the surface charge of transfection complexes also governs the intracellular delivery of transgenes, and an overall positive charge is desired in order to promote internalization across the negatively charged cell surface by means of favorable electrostatic interactions.50 In order to optimize these parameters, the size and zeta potential of particles formed at various weight ratios of fNDs:pDNA and fNDs:siRNA were measured. An increase in the weight proportion of fNDs to genetic material from 1:1 to 50:1 resulted in a shift in zeta potential from negative to positive, indicating that no free genetic material was available at higher weight ratios. The fND:pDNA particles exhibited considerable aggregation (precipitate) at a 6:1 weight ratio because of neutral zeta potential (Figure 9A), while this neutral zeta potential was reached at a much higher weight ratio (20:1) in the fND-siRNA system (Figure 9B). With an increase in ratio from 10:1 to 50:1, particle size was found to stabilize around 110 nm for fND-pDNA complexes (Figure 9A) and was less than 280 nm for the fND-siRNA complexes (Figure 9B). In the case of the fND-pDNA complexes, the zeta potential reached 40–50 mV at ratios of 30:1 and beyond, while a positive zeta potential of nearly 30 mV was attained at a ratio of 50:1 in fND-siRNA complexes. These results demonstrate the ability of fNDs to condense pDNA and form complexes with pDNA and siRNA within the size range suitable for producing efficient transfection. These size and zeta measurements correlate well with those from the gel electrophoresis assay, indicating that the retardation of nucleic acid material coincides with the electroneutrality of the “diamoplexes.”
Figure 9.
Size and zeta potential measurements using various weight ratios of (A) lysine-functionalized nanodiamonds and plasmid DNA (fNDs:pDNA) and (B) fNDs and small interfering RNA (fNDs:siRNA).
Notes: Each value represents mean plus or minus standard deviation of four measurements (n ≥ 10).
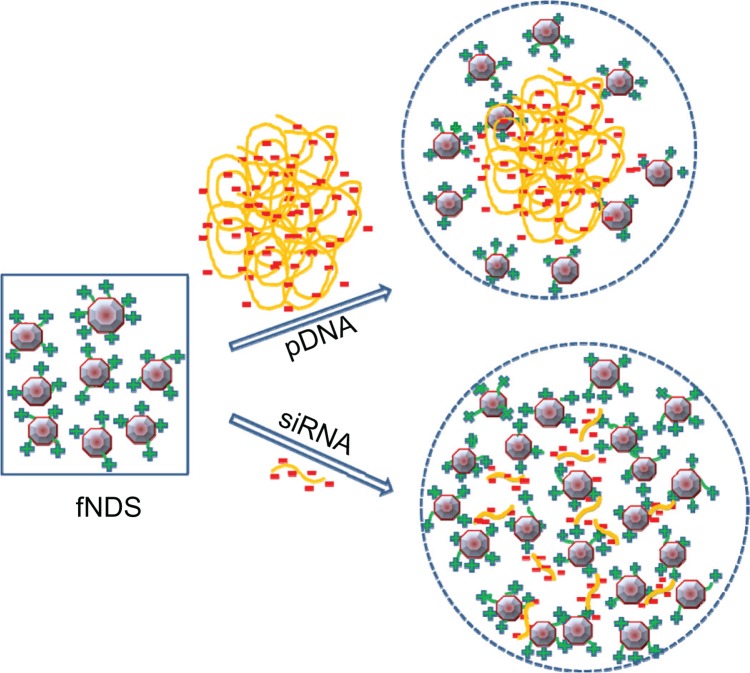
In this study, the ratio of lysine linker present per base pair of pDNA and siRNA was also calculated based on the surface loading of the fNDs and the number of base pairs of nucleic acids (Table 3). The differences in the binding behavior of these two genetic materials to the fNDs can be attributed to structural differences of the circular pDNA having 5805 base pairs and linear siRNA having only 21 base pairs. The formation of complexes between nanoparticles and siRNA has also been observed to occur at a higher weight ratio than nanoparticles and pDNA in previous studies involving chitosan nanoparticles.51,52 A suggested model for the formation of complexes between fNDs and pDNA or siRNA, taking into account the binding behavior, size, and zeta potential measurements of the complexes, as well as the structural peculiarities of the genetic materials themselves, is shown in Figure 10. In this model, the pDNA is thought to form a spherical nanostructure with positively charged fNDs, while the structural configuration of linear siRNA with fNDs is rather complex, involving several linear siRNA sequences.
Table 3.
Ratios of lysine linker residues on the nanodiamonds (NDs) per base pair of genetic material, as calculated from surface loading measurements
| Weight ratio of fNDs:genetic material | Calculated lysine linker per pDNA base pair ratio | Calculated lysine linker per siRNA base pair ratio |
|---|---|---|
| 1:1 | 1.1 | 1.1 |
| 5:1 | NR | 5.4 |
| 6:1 | 6.6 | NR |
| 10:1 | 11 | 11 |
| 20:1 | 22 | 22 |
| 30:1 | 33 | 32 |
| 40:1 | 44 | 43 |
| 50:1 | 55 | 54 |
Abbreviations: fNDs, lysine-functionalized nanodiamonds; pDNA, plasmid DNA; siRNA, small interfering RNA; NR, not reported.
Figure 10.
Schematic representation of the different binding behavior of plasmid DNA (pDNA) and small interfering RNA (siRNA) to positively charged lysine-functionalized nanodiamonds (fNDs).
Conclusion
In this study, the surfaces of NDs were covalently functionalized with lysine attached to a three-carbon-length linker. These modified NDs exhibited surface loading of 1.7 mmol g−1 and excellent dispersibility in water, as well as showing a considerable reduction in the aggregate size of the particles (21 nm), as measured by DLS. AFM images confirmed the disaggregation of the fNDs in comparison with the carboxylated NDs. The hydrophilicity exhibited by the functionalized NDs in this study also provides an advantage for their use in animal and human systems, as water can be used as a dispersion medium. Finally, the fNDs exhibited an ability to bind pDNA and siRNA by forming nanosized “diamoplexes.” This property should be explored further to determine the applicability of fNDs as vectors for the delivery of genetic materials in gene therapy.
Acknowledgments
The authors gratefully acknowledge the Natural Sciences and Engineering Research Council of Canada for funding this project. Author R Kaur would also like to thank Apotex Inc for supporting her graduate studies. The authors thank Tosoh Corporation, USA, for the kind donation of the YTZ grinding media used in these studies. The authors gratefully acknowledge the Saskatchewan Structural Sciences Centre, University of Saskatchewan – in particular, Ken Thoms for performing the mass spectrometry measurements. The authors are also thankful to Dr Lee Wilson for the use of the thermogravimetric analyzer in this study and Dr Ramaswami Sammynaiken for discussions about the manuscript. The IR spectroscopy data described in this paper were collected at the Mid-IR beamline of the Canadian Light Source, which is supported by the Natural Sciences and Engineering Research Council of Canada, the National Research Council Canada, the Canadian Institutes of Health Research, the Province of Saskatchewan, Western Economic Diversification Canada, and the University of Saskatchewan.
Footnotes
Disclosure
The authors report no conflicts of interest in this work.
Supplementary figures
Proton nuclear magnetic resonance spectra of compound 1 [N′-(Nα,Nε-bis-Boc-lysyl),N″-(Fmoc)-diaminopropane] at 500 MHz.
Mass spectrum of compound 1 [N′-(Nα,Nε-bis-Boc-lysyl),N″-(Fmoc)-diaminopropane].
Abbreviations: max, maximum; m/z, mass-to-charge ratio.
References
- 1.Schrand A, Hens SAC, Shenderova O. Nanodiamond particles: properties and perspectives for bioapplications. Crit Rev Solid State Mater Sci. 2009;34(1–2):18–74. [Google Scholar]
- 2.Danilenko VV. On the history of the discovery of nanodiamond synthesis. Phys Solid State. 2004;46(4):595–599. [Google Scholar]
- 3.Dolmatov VY. Application of detonation nanodiamond. In: Shenderova OA, Gruen DM, editors. Ultrananocrystalline Diamond: Synthesis, Properties, and Applications. New York: William Andrew Publishing; 2006. pp. 477–528. [Google Scholar]
- 4.Bondar’ VS, Pozdnyakova IO, Puzyr’ AP. Applications of nanodiamonds for separation and purification of proteins. Phys Solid State. 2004;46(4):758–760. [Google Scholar]
- 5.Chow EK, Zhang XQ, Chen M, et al. Nanodiamond therapeutic delivery agents mediate enhanced chemoresistant tumor treatment. Sci Transl Med. 2011;3(73):73ra21. doi: 10.1126/scitranslmed.3001713. [DOI] [PubMed] [Google Scholar]
- 6.Li J, Zhu Y, Li W, Zhang X, Peng Y, Huang Q. Nanodiamonds as intracellular transporters of chemotherapeutic drug. Biomaterials. 2010;31(32):8410–8418. doi: 10.1016/j.biomaterials.2010.07.058. [DOI] [PubMed] [Google Scholar]
- 7.Dolmatov VY. Detonation synthesis ultradispersed diamonds: properties and applications. Russ Chem Rev. 2001;70(7):607–626. [Google Scholar]
- 8.Shenderova OA, Hens SAC. Detonation nanodiamond particles processing, modification and bioapplications. In: Ho D, editor. Nanodiamonds: Applications in Biology and Nanoscale Medicine. New York: Springer; 2010. pp. 79–116. [Google Scholar]
- 9.Aleksenskiiĭ AE, Baiĭdakova MV, Vul’ AY, Siklitskiiĭ VI. The structure of diamond nanoclusters. Phys Solid State. 1999;41(4):668–671. [Google Scholar]
- 10.Jiang T, Xu K. FTIR study of ultradispersed diamond powder synthesized by explosive detonation. Carbon. 1995;33(12):1663–1671. [Google Scholar]
- 11.Krueger A. New carbon materials: biological applications of functionalized nanodiamond materials. Chemistry. 2008;14(5):1382–1390. doi: 10.1002/chem.200700987. [DOI] [PubMed] [Google Scholar]
- 12.Puzyr AP, Purtov KV, Shenderova OA, Luo M, Brenner DW, Bondar VS. The adsorption of aflatoxin B1 by detonation-synthesis nanodiamonds. Dokl Biochem Biophys. 2007;417(1):299–301. doi: 10.1134/s1607672907060026. [DOI] [PubMed] [Google Scholar]
- 13.Shimkunas RA, Robinson E, Lam R, et al. Nanodiamond-insulin complexes as pH-dependent protein delivery vehicles. Biomaterials. 2009;30(29):5720–5728. doi: 10.1016/j.biomaterials.2009.07.004. [DOI] [PubMed] [Google Scholar]
- 14.Wang HD, Niu CH, Yang Q, Badea I. Study on protein conformation and adsorption behaviors in nanodiamond particle-protein complexes. Nanotechnology. 2011;22(14):145703. doi: 10.1088/0957-4484/22/14/145703. [DOI] [PubMed] [Google Scholar]
- 15.Huang H, Pierstorff E, Osawa E, Ho D. Active nanodiamond hydrogels for chemotherapeutic delivery. Nano Lett. 2007;7(11):3305–3314. doi: 10.1021/nl071521o. [DOI] [PubMed] [Google Scholar]
- 16.Zhang XQ, Chen M, Lam R, Xu X, Osawa E, Ho D. Polymer-functionalized nanodiamond platforms as vehicles for gene delivery. ACS Nano. 2009;3(9):2609–2616. doi: 10.1021/nn900865g. [DOI] [PubMed] [Google Scholar]
- 17.Chen M, Zhang XQ, Man HB, Lam R, Chow EK, Ho D. Nanodiamond vectors functionalized with polyethylenimine for siRNA delivery. J Phys Chem Lett. 2010;1(21):3167–3171. [Google Scholar]
- 18.Ida S, Tsubota T, Tanii S, Nagata M, Matsumoto Y. Chemical modification of the diamond surface using benzoyl peroxide and dicarboxylic acids. Langmuir. 2003;19(23):9693–9698. [Google Scholar]
- 19.Tsubota T, Tanii S, Ida S, Nagata M, Matsumoto Y. Chemical modification of diamond surface with various carboxylic acids by radical reaction in liquid phase. Diam Relat Mater. 2004;13(4–8):1093–1097. [Google Scholar]
- 20.Tsubota T, Ohno T, Yoshida H, Kusakabe K. Introduction of molecules containing a NO2 group on diamond surface by using radical reaction in liquid phase. Diam Relat Mater. 2006;15(4–8):668–672. [Google Scholar]
- 21.Liu Y, Gu Z, Margrave JL, Khabashesku VN. Functionalization of nanoscale diamond powder: fluoro-, alkyl-, amino-, and amino acid-nanodiamond derivatives. Chem Mater. 2004;16(20):3924–3930. [Google Scholar]
- 22.Krüger A, Liang Y, Jarre G, Stegk J. Surface functionalisation of detonation diamond suitable for biological applications. J Mater Chem. 2006;16(24):2322–2328. [Google Scholar]
- 23.Krueger A, Boedeker T. Deagglomeration and functionalisation of detonation nanodiamond with long alkyl chains. Diam Relat Mater. 2008;17(7–10):1367–1370. [Google Scholar]
- 24.Schrand AM, Huang H, Carlson C, et al. Are diamond nanoparticles cytotoxic? J Phys Chem B. 2007;111(1):2–7. doi: 10.1021/jp066387v. [DOI] [PubMed] [Google Scholar]
- 25.Schrand AM, Dai L, Schlager JJ, Hussain SM, Osawa E. Differential biocompatibility of carbon nanotubes and nanodiamonds. Diam Relat Mater. 2007;16(12):2118–2123. [Google Scholar]
- 26.Chen M, Pierstorff ED, Lam R, et al. Nanodiamond-mediated delivery of water-insoluble therapeutics. ACS Nano. 2009;3(7):2016–2022. doi: 10.1021/nn900480m. [DOI] [PubMed] [Google Scholar]
- 27.Faraji AH, Wipf P. Nanoparticles in cellular drug delivery. Bioorg Med Chem. 2009;17(8):2950–2962. doi: 10.1016/j.bmc.2009.02.043. [DOI] [PubMed] [Google Scholar]
- 28.Krueger A, Stegk J, Liang Y, Lu L, Jarre G. Biotinylated nanodiamond: simple and efficient functionalization of detonation diamond. Langmuir. 2008;24(8):4200–4204. doi: 10.1021/la703482v. [DOI] [PubMed] [Google Scholar]
- 29.Ozawa M, Inaguma M, Takahashi M, Kataoka F, Krüger A, Osawa E. Preparation and behavior of brownish, clear nanodiamond colloids. Adv Mater. 2007;19(9):1201–1206. [Google Scholar]
- 30.Singh J, Yang P, Michel D, Verrall RE, Foldvari M, Badea I. Amino acid-substituted gemini surfactant-based nanoparticles as safe and versatile gene delivery agents. Curr Drug Deliv. 2011;8(3):299–306. doi: 10.2174/156720111795256200. [DOI] [PubMed] [Google Scholar]
- 31.Kim B, Sigmund WM. Functionalized multiwall carbon nanotube/gold nanoparticle composites. Langmuir. 2004;20(19):8239–8242. doi: 10.1021/la049424n. [DOI] [PubMed] [Google Scholar]
- 32.Pham TA, Son SM, Jeong YT. Water-dispersible multi-walled carbon nanotubes and novel hybrid nanostructures. Synth React Inorg Met-Org Nano-Metal Chem. 2010;40(4):216–224. [Google Scholar]
- 33.Liu J, Rinzler AG, Dai H, et al. Fullerene pipes. Science. 1998;280(5367):1253–1256. doi: 10.1126/science.280.5367.1253. [DOI] [PubMed] [Google Scholar]
- 34.Kong H, Gao C, Yan D. Functionalization of multiwalled carbon nanotubes by atom transfer radical polymerization and defunctionalization of the products. Macromolecules. 2004;37(11):4022–4030. [Google Scholar]
- 35.Philip B, Xie J, Abraham JK, Varadan VK. Polyaniline/carbon nanotube composites: starting with phenylamino functionalized carbon nanotubes. Polym Bull. 2005;53(2):127–138. [Google Scholar]
- 36.Sainsbury T, Erickson K, Okawa D, Zonte CS, Fréchet JMJ, Zettl A. Kevlar functionalized carbon nanotubes for next-generation composites. Chem Mater. 2010;22(6):2164–2171. [Google Scholar]
- 37.Han G, Tamaki M, Hruby VJ. Fast, efficient and selective deprotection of the tert-butoxycarbonyl (Boc) group using HCl/dioxane (4 M) J Pept Res. 2001;58(4):338–341. doi: 10.1034/j.1399-3011.2001.00935.x. [DOI] [PubMed] [Google Scholar]
- 38.Solin SA, Ramdas AK. Raman spectrum of diamond. Phys Rev B. 1970;1(4):1687–1698. [Google Scholar]
- 39.Ager JW, 3rd, Veirs DK, Rosenblatt GM. Spatially resolved Raman studies of diamond films grown by chemical vapor deposition. Phys Rev B Condens Matter. 1991;43(8):6491–6499. doi: 10.1103/physrevb.43.6491. [DOI] [PubMed] [Google Scholar]
- 40.Ganesan S, Maradudin AA, Oitmaa J. A lattice theory of morphic effects in crystals of the diamond structure. Ann Phys. 1970;56(2):556–594. [Google Scholar]
- 41.Mochalin V, Osswald S, Gogotsi Y. Contribution of functional groups to the Raman spectrum of nanodiamond powders. Chem Mater. 2009;21(2):273–279. [Google Scholar]
- 42.Mochalin VN, Shenderova O, Ho D, Gogotsi Y. The properties and applications of nanodiamonds. Nat Nanotechnol. 2012;7(1):11–23. doi: 10.1038/nnano.2011.209. [DOI] [PubMed] [Google Scholar]
- 43.Osipov VY, Aleksenskiy AE, Shames AI, Panich AM, Shestakov MS, Vul AY. Infrared absorption study of surface functional groups providing chemical modification of nanodiamonds by divalent copper ion complexes. Diam Relat Mater. 2011;20(8):1234–1238. [Google Scholar]
- 44.Bellamy LJ. Alkanes. In: Bellamy LJ, editor. Advances in Infrared Group Frequencies. 1st ed. London: Methuen; 1968. pp. 1–20. [Google Scholar]
- 45.Kim T, Lee K, Gong MS, Joo SW. Control of gold nanoparticle aggregates by manipulation of interparticle interaction. Langmuir. 2005;21(21):9524–9528. doi: 10.1021/la0504560. [DOI] [PubMed] [Google Scholar]
- 46.Zhao D, Li Q, Duan E, Li H, Shen X. Solubility of L-lysine hydrochloride in dimethyl sulfoxide, methanol, ethanol, water, and glycol between (283 and 323) K. J Chem Eng Data. 2009;54(7):2126–2127. [Google Scholar]
- 47.Zanetti-Ramos BG, Fritzen-Garcia MB, Creczynski-Pasa TB, et al. Characterization of polymeric particles with electron microscopy, dynamic light scattering, and atomic force microscopy. Particul Sci Technol. 2010;28(5):472–484. [Google Scholar]
- 48.Singh J, Michel D, Chitanda JM, Verrall RE, Badea I. Evaluation of cellular uptake and intracellular trafficking as determining factors of gene expression for amino acid-substituted gemini surfactant-based DNA nanoparticles. J Nanobiotechnology. 2012;10:7. doi: 10.1186/1477-3155-10-7. [DOI] [PMC free article] [PubMed] [Google Scholar]
- 49.Donkuru M, Badea I, Wettig S, Verrall R, Elsabahy M, Foldvari M. Advancing nonviral gene delivery: lipid- and surfactant-based nanoparticle design strategies. Nanomedicine (Lond) 2010;5(7):1103–1127. doi: 10.2217/nnm.10.80. [DOI] [PubMed] [Google Scholar]
- 50.Akinc A, Lynn DM, Anderson DG, Langer R. Parallel synthesis and biophysical characterization of a degradable polymer library for gene delivery. J Am Chem Soc. 2003;125(18):5316–5323. doi: 10.1021/ja034429c. [DOI] [PubMed] [Google Scholar]
- 51.Katas H, Alpar HO. Development and characterisation of chitosan nanoparticles for siRNA delivery. J Control Release. 2006;115(2):216–225. doi: 10.1016/j.jconrel.2006.07.021. [DOI] [PubMed] [Google Scholar]
- 52.Lee DW, Yun KS, Ban HS, Choe W, Lee SK, Lee KY. Preparation and characterization of chitosan/polyguluronate nanoparticles for siRNA delivery. J Control Release. 2009;139(2):146–152. doi: 10.1016/j.jconrel.2009.06.018. [DOI] [PubMed] [Google Scholar]
Associated Data
This section collects any data citations, data availability statements, or supplementary materials included in this article.
Supplementary Materials
Proton nuclear magnetic resonance spectra of compound 1 [N′-(Nα,Nε-bis-Boc-lysyl),N″-(Fmoc)-diaminopropane] at 500 MHz.
Mass spectrum of compound 1 [N′-(Nα,Nε-bis-Boc-lysyl),N″-(Fmoc)-diaminopropane].
Abbreviations: max, maximum; m/z, mass-to-charge ratio.


