

A periodic luciferase reporter system from cell cycle–regulated promoters in synchronous U2OS cells measures periodic, cell cycle–regulated gene expression in live cells. This assay is used to identify Forkhead transcription factors that control periodic gene expression, and it identifies FOXK1 as an activator of key cell cycle genes.
Abstract
We developed a system to monitor periodic luciferase activity from cell cycle–regulated promoters in synchronous cells. Reporters were driven by a minimal human E2F1 promoter with peak expression in G1/S or a basal promoter with six Forkhead DNA-binding sites with peak expression at G2/M. After cell cycle synchronization, luciferase activity was measured in live cells at 10-min intervals across three to four synchronous cell cycles, allowing unprecedented resolution of cell cycle–regulated gene expression. We used this assay to screen Forkhead transcription factors for control of periodic gene expression. We confirmed a role for FOXM1 and identified two novel cell cycle regulators, FOXJ3 and FOXK1. Knockdown of FOXJ3 and FOXK1 eliminated cell cycle–dependent oscillations and resulted in decreased cell proliferation rates. Analysis of genes regulated by FOXJ3 and FOXK1 showed that FOXJ3 may regulate a network of zinc finger proteins and that FOXK1 binds to the promoter and regulates DHFR, TYMS, GSDMD, and the E2F binding partner TFDP1. Chromatin immunoprecipitation followed by high-throughput sequencing analysis identified 4329 genomic loci bound by FOXK1, 83% of which contained a FOXK1-binding motif. We verified that a subset of these loci are activated by wild-type FOXK1 but not by a FOXK1 (H355A) DNA-binding mutant.
INTRODUCTION
The cell cycle, which governs the timing and progression of DNA replication (S phase) and mitosis (M phase), is one of the most tightly regulated cellular processes. Because misregulation can lead to catastrophic cellular events such as programmed cell death or cancer, determining the key regulators and pathways controlling periodic, cell cycle–dependent gene expression is critical. Cell cycle–regulated gene expression has been studied extensively by DNA microarray (Cho et al., 2001; Whitfield et al., 2002; Bar-Joseph et al., 2008), luciferase reporter assays (Hwang et al., 1995), and both time-lapse and still-image microscopy (Stacey and Hitomi, 2008; Kaida et al., 2011). Although these assays can provide extraordinary levels of detail with regard to the number of genes measured, they are too costly and time-consuming to use as a screening strategy for genes that affect the regulation of periodic gene expression. To study genetic interactions between regulators and periodic gene expression, we developed a system to measure cell cycle–driven luciferase expression in living cells over multiple synchronous cell cycles in real time. We then used this system in conjunction with RNA interference (RNAi) to identify novel regulators of cell cycle progression.
The ability to follow promoter-regulated luciferase activity in live cells has been used successfully to probe the molecular nature of both circadian rhythms (Welsh et al., 2004) and cell division in yeast (Robertson et al., 2008). Recently a similar system has been used to show that progression through mitosis is independent of the circadian rhythm in Rat-1 fibroblasts (Yeom et al., 2010). In the case of mammalian circadian rhythms, cells transfected with a circadian-regulated promoter driving luciferase are synchronized, and luciferase activity is followed over time in a luminometer (Gamsby et al., 2009). In addition, circadian rhythms can be followed with this method in cells or tissue isolated from transgenic mice containing clock genes fused to luciferase at their endogenous loci (Yoo et al., 2004). Furthermore, RNAi has been used with this system to uncover novel components of the mammalian molecular clock (Zhang et al., 2009).
Measurement of luciferase activity in real time allows for simpler data collection and for greater accuracy, as the sampling intervals are more frequent than with other methods. Furthermore, since the measurements are nondestructive, the readings are from the same cells throughout the experiment, thus removing the variability of sample-to-sample comparison and greatly reducing the number of replicates needed. Because the cells are viable during data collection, drug treatments with agents such as DNA-damage inducers are possible throughout the experiment, allowing for great flexibility in experimental design (Gamsby et al., 2009). In addition, since luciferase remains bound to oxyluciferin after the light-emitting reaction (Lemasters and Hackenbrock, 1977) and the media contains an excess of luciferin, the readings obtained report the activity of newly synthesized luciferase, giving a clearer snapshot of reporter activity.
Forkhead Box (FOX) genes form a family of transcription factors found in species from yeast to human and are involved in a number of different cellular processes, including cell cycle progression, organ development, and oxidative stress responses (Huang and Tindall, 2007). The FOX family of transcription factors comprises >30 genes in humans, all of which contain a monomeric DNA-binding domain (Kaestner et al., 2000).
The transcription factor FOXM1 is known to regulate gene transcription during the transition from G2 to M phase of the cell cycle and to be overexpressed in cancer cells (Wierstra and Alves, 2007). RNAi-mediated knockdown in U2OS or BT-20 human cells results in decreased mitotic indexes and a concomitant increase in the number of cells in G2 (Laoukili et al., 2005; Wonsey and Follettie, 2005). In G2, FOXM1 up-regulates the expression of Cdc25B, cyclin B1, Aurora B kinase, Plk1, CENPA, CENPB, and survivin. In addition, FOXM1 is progressively phosphorylated by a number of kinases, including PLK1 and cyclin B/cdk1 complexes (Fu et al., 2008), as well as by cyclin A/CDK2 or cyclin E/CDK2 complexes (Wierstra and Alves, 2007), which then leads to its degradation by the APC/C after targeting by CDH1 at the end of mitosis (Laoukili et al., 2008). These phosphorylation events restrict the period of FOXM1 DNA-binding activity to the G2 and M phases of the cell cycle. Given this, a reporter driven by a synthetic promoter that is responsive to FOXM1 activity will accurately report the G2/M-specific activity of FOXM1.
E2F1 is a member of the E2F family of transcription factors, which control the expression of genes involved in apoptosis, differentiation, DNA synthesis, and mitosis (Shibutani et al., 2008). E2F1 is specifically involved in the transition from G1 to S phase of the cell cycle (Johnson et al., 1994). Of the many regulatory mechanisms that control E2F1 activity during the cell cycle, two of the best characterized are the binding of E2Fs to the retinoblastoma family of proteins and cell cycle phase–specific degradation (Marti et al., 1999). In addition, cell cycle regulation of the E2F1 promoter restricts expression to the correct cell cycle phase. The E2F1 promoter is autoregulated by active E2F1 during G1/S (Johnson et al., 1994), driving a rapid increase of active E2F1. After the period of E2F1 activity is complete, E2F7 and E2F8 bind to and repress the E2F1 promoter (Li et al., 2008; Zalmas et al., 2008). The combination of E2F1 promoter autoregulation and E2F7 and E2F8 repression restricts the promoter activity to G1/S.
To exploit the well-characterized, cell cycle–controlled oscillatory behavior of E2F1 at G1/S and FOXM1 at G2/M, we used constructs with either a minimal E2F1 promoter or FOX DNA consensus binding sites (Furuyama et al., 2000) driving luciferase expression. Using cell cycle synchronization protocols combined with selective small interfering RNA (siRNA) knockdowns, we followed the G1/S or G2/M reporters and identified two genes necessary for proper oscillation of cell cycle–regulated gene expression in human cells, FOXJ3 and FOXK1 (myocyte nuclear factor). We identified target genes regulated by FOXJ3 and FOXK1. We also identified the genomic loci bound by FOXK1 with chromatin immunoprecipitation followed by short read sequencing (ChIP-seq), which showed that FOXK1 might have a direct role in regulating the transcription of key cell cycle effectors. We identified a FOXK1 DNA motif present in 81.6% of the intersecting ChIP-seq peaks identified by MACS, and we show that select ChIP-seq peaks are responsive to FOXK1 in the live-cell luciferase reporter assay. These results show that FOXK1 regulates an expansive network of genes, including many that are critical for cell cycle progression, most notably DHFR, TYMS, GSDMD, and TFDP1.
Results
We designed experiments to identify Forkhead transcription factors that contribute to the periodic oscillation of cell cycle–regulated genes. We optimized thymidine-thymidine (thy-thy) and thymidine-nocodazole (thy-noc) cell cycle synchronizations (Whitfield et al., 2002) in U2OS cells, a human osteosarcoma line widely used for cell cycle studies (Fu et al., 2008; Laoukili et al., 2008). To easily and inexpensively monitor cell cycle progression in living cells across multiple, synchronous cell cycles, we developed stable cell lines that expressed cell cycle–regulated luciferase reporters with peak activity in either G1/S or G2/M.
Development of real-time cell cycle reporter assay for periodic gene expression
Previous studies reported that FOXM1 activity oscillates in a cell cycle–dependent manner (Laoukili et al., 2005, 2008; Fu et al., 2008). To report FOXM1 activity, we used a construct that has six Forkhead DNA-binding domains (6xDB) that drive expression of luciferase. Because estrogen receptors (ERs) localize to the nucleus upon ligand binding and this property can be exploited to artificially shuttle proteins to the nucleus (Chandriani et al., 2009), we designed a construct that expresses a fusion of FOXM1 and ER (FOXM1-ER). We then transiently transfected U2OS cells with both the 6xDB and FOXM1-ER constructs and confirmed by chromatin immunoprecipitation that FOXM1 is bound to the FOX-specific consensus sequences after addition of 4-hydroxytamoxifen (4OHT; Supplemental Figure S1D, inset). Addition of ER ligand 4OHT induced nuclear translocation of the FOXM1-ER fusion protein, which elicited an increase of luciferase activity beginning between 7.5 and 9 h, with peak luciferase expression around 34 h (Supplemental Figure S1D). Luciferase activity increased approximately eightfold in the 4OHT-treated cells compared with the vehicle-only negative control cells. Thus FOXM1 binds directly to FOX-specific DNA-binding sites and activates the 6xDB construct in our U2OS system.
After synchronization of U2OS cells stably expressing the 6xDB reporter at G1/S by thy-thy synchronization, FOXM1 displays peak levels and increased phosphorylation in late G2 (Figure 1A, top), and luciferase activity peaks concomitantly (Figure 1B). As expected, FOXM1 phosphorylation peaks during G2 before FOXM1 is degraded after mitosis (Figure 1A, hours 18 and 34). Given that phosphorylation of FOXM1 is required for its activity, these data also suggest that active FOXM1 is driving FOX DNA consensus site expression peaks, since the phosphorylation profile of FOXM1 is in phase with peak activity of 6xDB. Furthermore, the luciferase reporter shows minimal activity in late G1 and early to mid S phase, which is consistent with previously reported findings (Luscher-Firzlaff et al., 2006). The two peaks of luciferase activity correspond to G2/M phase of sequential cell cycles as determined by fluorescence-activated cell sorting (FACS) analysis (Figure 1C). A gradual dampening of the rhythm occurs over time as the cell population loses synchrony, as evidenced by increased standard error of the mean (SE; Figure 1B) and a decrease in the maximal percentage of G2/M cells in the second cell cycle (Figure 1C). These data show that peak expression of the 6xDB reporter faithfully reports late G2 and M phase in the U2OS cell cycle.
FIGURE 1:

Synchronous U2OS cells show periodic oscillation of G1/S and G2/M luciferase reporters. (A) Anti-FOXM1 Western blot in synchronous 6xDB U2OS cells shows periodic expression and phosphorylation of FOXM1 protein. Samples were taken every 2 h after release from the second thymidine block. Peak FOXM1 phosphorylation occurs at 12–14 and 30–32 h after release. GAPDH is shown as a loading control. (B) Baseline-subtracted luciferase activity in cells expressing 6xDB peaks at 12–14 and 30–32 h. Luciferase activity was read every 10 min from each of four replicate plates. Error bars represent the SE of the quadruplicate samples. (C) The percentage of cells in G1 and G2/M based on PI staining. FlowJo was used to calculate the percentage of cells in each phase. (D) Western blot showing E2F1 levels in synchronous hE2F1 U2OS cells. Samples were taken every 2 h after release from the second thymidine block. GAPDH is shown as a loading control. Arrow indicates the E2F1 band. (E) Baseline-subtracted luciferase activity in cells expressing hE2F1-luciferase (hE2F1-luc) peaks at 20–24 h postrelease. Error bars represent the SE of quadruplicate samples. (F) The percentage of cells in G1 or G2/M based on PI staining. Cells were plated and treated in parallel for A–C and D–F.
Precise analysis of cell cycle progression requires markers at more than one phase, so we also generated cells that stably express luciferase under the control of a minimal human E2F1 promoter (hE2F1) to report the G1/S transition. Cells were analyzed by Western blot and luciferase activity in a manner similar to FOXM1. Peak expression of E2F1 occurs at 2 and 22 h after release from a thy-thy block as seen via Western blot (Figure 1D), which corresponds to peak luciferase activity (Figure 1E) and with the G1 phase of the cell cycle, as determined by FACS profiling (Figure 1F).
To confirm the cell cycle dependence of the oscillations in E2F1 and FOXM1, we used a thy-noc synchronization method to arrest the cells in M phase instead of G1/S (Figure 2). As expected, the two synchronization methods yield peak luciferase activity that is antiphasic, a result of the two synchronization methods blocking at two opposing points in the cell cycle. Both synchronization methods yield cell cycle periods between 18 and 22 h. These data indicate that the oscillations in the hE2F1 cell line are reporting late G1 and early S phase in U2OS cells.
FIGURE 2:
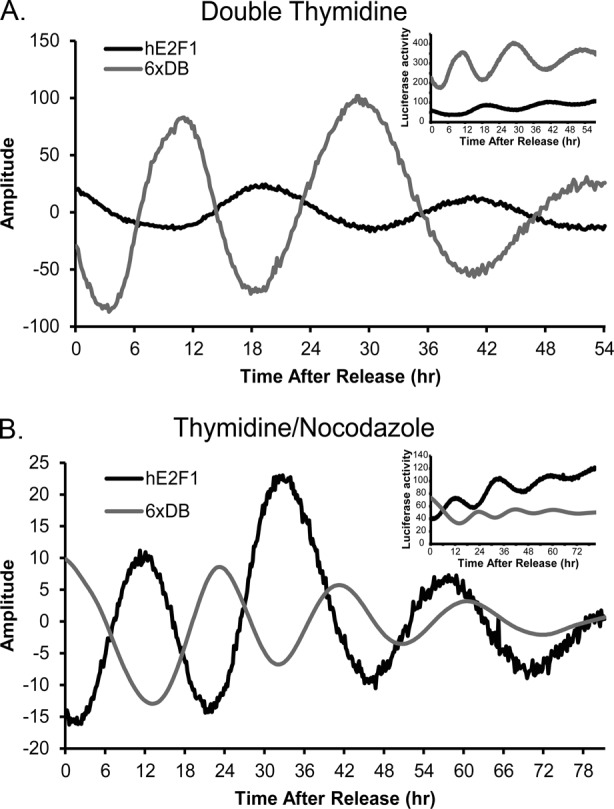
Luciferase activity from hE2F1-Luc and 6xDB-Luc reporters are antiphasic after thy-thy and thy-noc synchronizations. (A) Baseline-subtracted luciferase activity over 54 h after thy-thy synchronization in cells expressing 6xDB-Luc and hE2F1-Luc. Raw data are shown as an inset at the upper right. (B) Baseline-subtracted luciferase activity in cells expressing hE2F1-Luc and 6xDB-Luc over 78 h after a thy-noc synchronization. Mean values of quadruplicate samples are shown. Raw data are shown as an inset at the upper right.
As a negative control for the luciferase reporters, we generated stably transfected U2OS cells with either no promoter (pGL3-Basic with no insertions) or a constitutive promoter (pGL3-Control; Supplemental Figure S2). No pGL3-Basic or pGL3-Control cell lines showed significant oscillations with periods close to that of the cell cycle, confirming that the oscillations in 6xDB and hE2F1 cell lines are not caused by cell line production or synchronization method.
Numerous Forkhead genes are involved in proper cell cycle regulation
The ability to monitor simultaneously and with precision the different cell cycle stages suggested to us that this system would be useful in screening potential cell cycle regulators. As a proof of principle, we treated 6xDB and hE2F1 cells with siRNAs specific to FOXM1 and then synchronized the treated cells in G1/S with a thy-thy block (Supplemental Figure S1). Knowing that cells treated with siRNAs targeting FOXM1 have aberrant mitosis and undergo mitotic catastrophe (Wierstra and Alves, 2007), we anticipated dampened or lost oscillations in both markers, assuming the degree of knockdown was sufficient; this was observed (Figure 3, A and B). Empowered by these positive controls and the lack of cell cycle effects in negative controls (see Supplemental Figure S2, A and B), we screened siRNAs against five FOX genes. Four were implicated in cell cycle control in one of four genome-wide RNAi screens for cell cycle defects (FOXA2, FOXJ3, FOXK1, and FOXL2; Mukherji et al., 2006; Root et al., 2006; Kittler et al., 2007; Rines et al., 2008), and one showed periodic mRNA expression during the cell cycle in one of three genome-wide mRNA profiling experiments for cell cycle-regulated genes (FOXP1; G.D.G., L.K.G., and M.L.W., unpublished data). Overlap between the different RNAi screens and mRNA expression data was minimal, resulting in each gene being identified in only a single screen. FOXM1, a known regulator of cell cycle gene expression, was only identified in Whitfield et al. (2002).
FIGURE 3:

FOXM1, FOXJ3, and FOXK1 are necessary for periodic gene expression in synchronous U2OS cells. (A–L) Raw luciferase activity levels for cells expressing hE2F1-Luc (A, C, E, G, I, K) or 6xDB-Luc (B, D, F, H, J, L) treated with the indicated siRNAs and then synchronized by a thy-thy arrest (diagramed in Supplemental Figure S1B). Luciferase activity was measured every 10 min over 72 h after release from the second thymidine arrest. Cells treated with siRNAs against FOXJ3, FOXK1, or FOXM1 show decreased cell cycle–dependent oscillation of luciferase activity relative to control siRNA treatment. All graphs are the mean of a minimum of three samples; error bars are SE. The y-axes have been set to the same value based on luciferase levels in C (hE2F1) and D (6xDB). (M) Relative mRNA expression levels for siRNAs to FOXJ3 and FOXK1. Control siRNA (Dharmacon siControl #2) expression levels have been set to 100%. Expression levels are normalized to GAPDH RNA levels.
In independent experiments, knockdown of FOXJ3 and FOXK1 greatly decreased the cell cycle–dependent oscillations in both 6xDB and hE2F1 cell lines (Figure 3, E–L). FOXL2 was found not to be expressed in U2OS cells and, consistent with this finding, had no cell cycle phenotype (unpublished data). Quantitative PCR demonstrated knockdown efficiencies of 90 and 60% of wild-type gene expression levels for FOXJ3 and FOXK1, respectively, showing that even a partial loss of function significantly affected periodic gene expression (Figure 3M). Knockdown of the remaining Forkhead proteins gave intermediate phenotypes; detailed characterization will be reported elsewhere.
We then used a human PLK1 promoter luciferase reporter construct to show that loss of G2/M oscillations also occurred with an endogenous human G2/M promoter. U2OS cells stably expressing this reporter faithfully reproduced the same periodic, G2/M-specific oscillation and phasing of luciferase activity as the synthetic 6xDB Forkhead Box promoter construct (Figure 4A). RNAi knockdown with the two independent siRNAs against FOXJ3 (Figure 4, B and C) and FOXK1 (Figure 4, D and E) shows a loss of cell cycle phase–specific luciferase activity. This suggests that loss of G2/M oscillations is due to cell cycle arrest and not to a direct interaction between the reporter and FOXK1 proteins, since FOXK1 does not appear to target PLK1 directly (see ChIP-seq data presented later).
FIGURE 4:

The cell cycle–dependent oscillations of the human PLK1 gene promoter are ablated after the knockdown of FOXK1 or FOXJ3. Luciferase activity was measured every 10 min over 72 h after release from the second thymidine arrest, concomitant with siRNA knockdowns as indicated. (A) The cell cycle–associated oscillations of luciferase activity driven by the human PLK1 gene promoter after transfection with a control siRNA. (B–E) U2OS cells treated with two independent siRNAs against FOXJ3 (B, C) or FOXK1 (D, E) showed decreased cell cycle–dependent oscillation of luciferase activity. All graphs are the mean of at least three samples; error bars are SE. The y-axes have been set to the same value based on luciferase levels in A.
Consistent with this, all siRNAs against FOXJ3, FOXK1, or FOXM1 resulted in significantly reduced proliferation rates compared with controls (Figure 5). A cell viability assay revealed no noticeable increases in dead cells between the control and the siRNA-treated cells, indicating that the decrease in cell numbers reflects a decrease in proliferation rate. Disruption of cell cycle progression by these FOX-specific siRNAs was further confirmed by FACS analysis of propidium iodide (PI)–stained cells, which revealed an increase in the number of cells in G1 (Figure 5A). These data indicate that in addition to FOXM1, the Forkhead Box transcription factors FOXJ3 and FOXK1 have important roles in regulating cell proliferation. This also suggests that an extensive network of Forkhead transcription factors regulates cell cycle progression.
FIGURE 5:
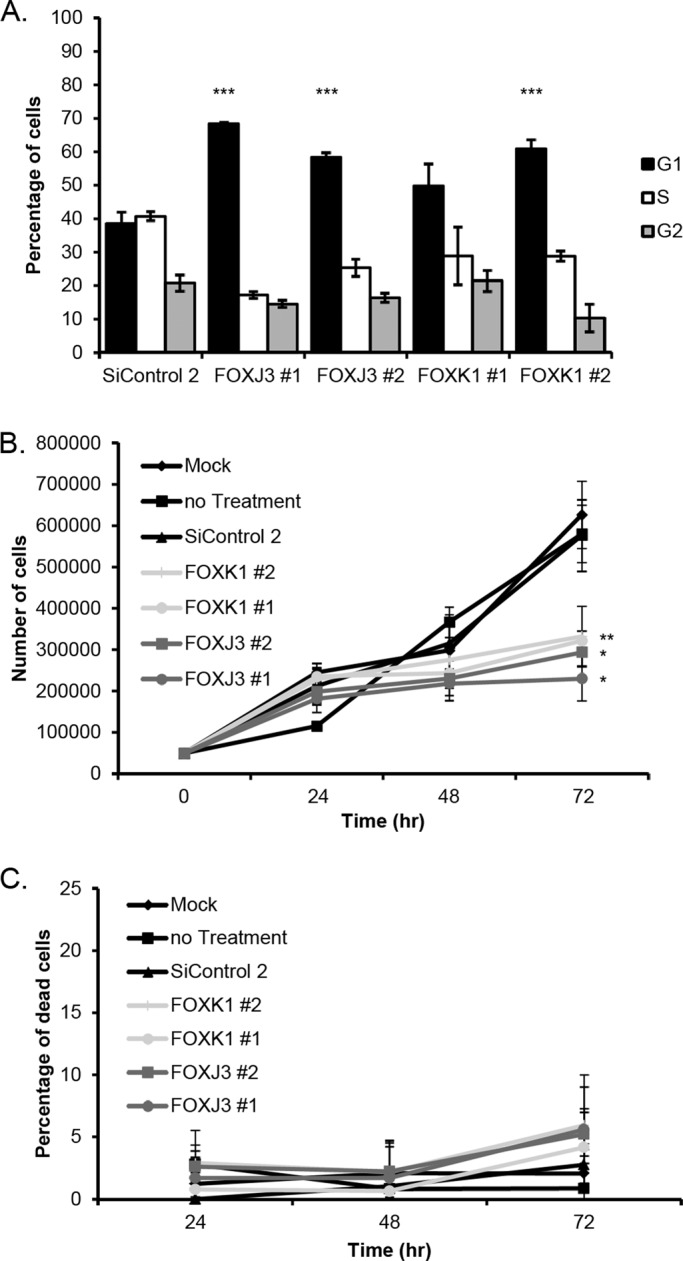
FOXJ3 and FOXK1 knockdown results in accumulation of G1 cells and impaired proliferation. (A) Percentages of cells in each cell cycle phase as determined by PI staining. Cells were assayed 72 h after siRNA transfection. Both FOXJ3 and FOXK1 cells show an increase in the percentage of cells in G1. Error bars are SE from triplicate samples. All p values of treated cells compared with siControl #2 are <0.05 except FOXK1-1 (p = 0.0538). FlowJo was used to calculate the percentages of cells in each phase. (B) A 72-h proliferation curve shows a proliferation defect in U2OS cells treated with siRNAs targeting FOXJ3 or FOXK1. Error bars are SE of triplicate samples. Indicated p values are <0.05 (*), 0.01 (*), or 0.005 (***) when compared with the percentage of cells in G1 of the SiControl #2–treated cells. (C) Percentage of dead cells, as determined by trypan blue staining, from the proliferation curve in B.
Transcriptional targets of FOXJ3 and FOXK1
To identify potential gene targets of FOXJ3 and FOXK1, we performed three independent siRNA knockdowns for these two genes in asynchronous U2OS cells. As a negative control, we used an siRNA that does not target any known cellular mRNAs (siGENOME Non-Targeting siRNA #2). We collected time points before siRNA treatment (0 h) and at 12, 24, 48, and 72 h after knockdown. We prepared RNA from each time point and analyzed it using DNA microarray hybridization. We selected 1651 genes that changed at least 2.14-fold from the 0 time point in at least three samples and clustered them hierarchically (Figure 6A).
FIGURE 6:

Expression profiling of FOXJ3 and FOXK1 siRNA knockdowns in asynchronous U2OS cells. (A) Hierarchical clustering of the 1651 genes that changed at least 2.14-fold on three arrays relative to time zero. The first three columns are zero time points (blue line), the fourth is the zero average, and each time point for the indicated siRNA is indicated by the blue triangle (12, 24, 48, and 72 h). All three experiments were performed in parallel, and therefore the same zero time points are used for each siRNA knockdown. (B) Secreted extracellular matrix gene cluster that shows increased expression after FOXJ3 knockdown and decreased expression after FOXK1 knockdown. (C) The immediate early genes (Iyer et al., 1999; Chang et al., 2004). (D) FOXJ3 cluster shows a decrease in FOXJ3 mRNA, specifically in cells treated with the FOXJ3 siRNA, and includes a large number of zinc finger proteins. (E) Cell cycle cluster that shows decreased expression in both FOXJ3 and FOXK1 knockdowns. We find that 67.3% of the genes in this cluster are cell cycle regulated in HeLa cells.
Multiple clusters of coordinately regulated genes were evident after siRNA knockdown. The genes showing the most consistent decrease in expression were those associated with cell division. As expected, these genes showed decreased expression in both FOXJ3 and FOXK1 treatments, and there is an enrichment of well-characterized cell cycle–regulated genes (Figure 6E). These include genes known to cause cell cycle defects after knockdown (Mukherji et al., 2006; Root et al., 2006; Kittler et al., 2007; Rines et al., 2008), as well as genes expressed in S (RRM2) and G2/M phases (CENPE, PLK1, and STK6; Whitfield et al., 2002). Of the 52 genes with decreased expression in this cluster, 35 (69%) were cell cycle regulated in HeLa cells (Whitfield et al., 2002). Analysis of the 52 genes in this cluster by the Database for Annotation, Visualization and Integrated Discovery (DAVID; Dennis et al., 2003; Huang da et al., 2009) showed enrichment for genes associated with cell cycle–specific processes (Supplemental Table S1). A second general group of genes included the immediate early genes that are increased by serum stimulation (Iyer et al., 1999; Figure 6C) and decrease with time after treatment in both the siRNA knockdowns and the mock treatment.
To identify genes that might be specifically regulated by either FOXJ3 or FOXK1, we examined the data for genes whose expression levels changed due to the knockdown of one Forkhead but not the other. As expected, FOXJ3 mRNA levels were decreased by the siRNA specific for FOXJ3 but not by the siRNA for FOXK1 or the control siRNA. Examination of genes that cluster with FOXJ3 shows that 9 of 32 genes are uncharacterized zinc finger proteins (Figure 6D), whereas others include a ring finger protein (RNF138) and a putative RNA-binding protein (RBM25). This suggests that FOXJ3 might have a role in regulating this subset of zinc finger DNA and/or RNA-binding proteins that might be involved in cell cycle progression (Supplemental Table S1). We also uncovered a group of genes (Figure 6B) that showed increased expression after FOXJ3 knockdown and decreased expression in the FOXK1 knockdown, indicating that these genes might be repressed by FOXJ3 activity and activated by FOXK1. This set of genes could represent indirect FOXK1 targets, although many of these genes do not have a clear role in cell cycle regulation. However, there is a significant enrichment for proteins involved in cell signaling (p = 1.02 × 10⁻⁴; Supplemental Table S1) as well as secreted, extracellular matrix proteins (p = 0.001).
FOXK1 binds to the promoter and regulates key cell cycle regulators
To understand how knockdown of FOXK1 results in cell cycle arrest, we sought to identify direct targets of FOXK1 by analyzing the DNA regions bound by endogenous FOXK1 by ChIP-seq using two independent antibodies against FOXK1 (adequate antibodies were not available for FOXJ3). The DNA fragments from each independent ChIP were sequenced independently. ChIP-seq of FOXK1 using the first antibody (AB G22; Santa Cruz Biotechnology) resulted in 58 million mapped sequence reads (2.1 million unmapped), and ChIP-seq using the second antibody (AB134550; Santa Cruz Biotechnology) resulted in 65 million mapped reads (2.2 million unmapped; Human Genome build 19). Enriched peaks were identified in each data set independently using MACS (Zhang et al., 2008; Liu et al., 2011; mfold 15, p < 0.001), which resulted in 7513 peaks in AB G22 and 6225 peaks in AB1344550. For a conservative estimate of FOXK1 binding, we focused our analysis on those sequences that were found in both experiments. Taking the intersection resulted in 4329 shared MACS peaks (Supplemental Table S2). Each includes the intersecting DNA region under the peaks, and we refer to these as “FOXK1 genomic loci.” We determined the distribution of these 4329 shared FOXK1 binding loci in the genome using the cis-regulatory element annotation system (CEAS; http://liulab.dfci.harvard.edu/CEAS; Zhang et al., 2008) implemented in Cistrome (www.cistrome.com). The 4329 genomic loci map to 2865 RefSeq mRNAs representing 1772 unique human genes. We found significant enrichment of genomic loci within 3 kb upstream of the transcriptional start site (6.1%, p = 1.7 × 10−53; Figure 7A), and 36.6% of the genomic loci were found in introns (p = 1.5 × 10⁻¹¹). We found 51.7% of the FOXK1 loci in distal intergenic regions (defined in this analysis as >3 kb from the transcription start site [TSS] or transcription termination site [TTS]), similar to what would be expected by chance (50%). The percentage of FOXK1 loci in 5′ untranslated regions (UTR), coding exons, or 3′ UTRs of genes was minimal (Figure 7A).
FIGURE 7:

FOXK1 binds to the promoters of an expansive set of genes critical for cell cycle progression. (A) CEAS analysis of the overlapping sequences found in the two antibody ChIP-seq analyses shows an enrichment in promoters (3000 base pairs upstream of the transcriptional start site) and a reduction of intronic FOXK1-binding loci relative to background. (B) Analysis of the 4329 overlapping FOXKI loci for overrepresented sequence elements identifies two significantly enriched FOXK1-like DNA-binding motifs. We find that 83.4% of the FOXK1 genomic loci contain at least one of the motifs; 51.3% of the FOXK1 loci contain both motifs. (C) Comparison of all cell cycle–regulated genes from Whitfield et al. (2002) with FOXK1 loci shows a higher percentage of occupancy of the promoters of genes with peak expression in G1/S and S phase. (D) Comparison of the genes that result in a cell cycle arrest in one of four genome-wide siRNA screens (Mukherji et al., 2006; Root et al., 2006; Kittler et al., 2007; Rines et al., 2008) linked to FOXK1 ChIP-seq loci shows higher percentage of occupancy in genes that result in an S or G2 phase arrest. (E) Multiple FOXK1-binding loci (thick black bars) are found in the promoter and introns of the TFDP1 gene. FOXK1-like DNA-binding motifs found in each locus are indicated (thin black bars). (F) A single intronic FOXK1 binding locus with multiple FOXK1-like DNA-binding motifs (thin black bars) is found in DHFR. Direction of transcription is indicated for each gene. (G) Change in gene expression for TFDP1 mRNA in the siRNA knockdown experiment (Figure 6) shows a 2.6-fold drop in TFDP1 mRNA levels after FOXK1 knockdown. (H) The gene expression data for FOXK1 target genes DHFR, TFDP1, TYMS, and GSDMD are shown from the mock and FOXK1 siRNA knockdown. Each is linked to the FOXK1 genomic loci found by ChIP-seq. CEAS was used to determine the percentage coverage for each region relative to the TSS of gene models, TTS, or within the gene (right). Those that have peak expression levels in G1 or S as determined in Whitfield et al. (2002) or that result in a G1- or S-phase arrest when knocked down in one of three genome-wide siRNA screens (Mukherji et al., 2006; Root et al., 2006; Kittler et al., 2007) are indicated (the full list is available in Supplemental Tables S3 and S4).
To determine whether the genomic loci bound by FOXK1 were enriched for the published FOXK1 consensus sequence motif TAAACA (Tsai et al., 2006), we analyzed all 4329 FOXK1 loci for enriched binding sites. We found that 83.4% of the FOXK1 loci contain a FOXK1-like consensus motif. Repeat sequences in the ChIP-seq intersecting sequences were masked using RepeatMasker Open-3.0. (www.repeatmasker.org), and significant motifs with high similarity to the FOXK1 motif were identified using the MEME Suite of programs (Bailey et al., 2009). The MEME-ChIP algorithm (Bailey, 2011; Machanick and Bailey, 2011) identified 15 motifs that were overrepresented in repeat masked FOXK1 genomic loci. These motifs were then compared with the FOXK1 consensus motif using STAMP (Mahony and Benos, 2007). A motif with consensus sequence AKAAACA was the best match to the FOXK1 motif (with an E value of 1.1 × 10−08) and found in 53% of the FOXK1 loci (Figure 7B). A second motif with consensus site ACAAAYAY was the second-best match (with an E value of 3.6 × 10−05) and was found in 81.6% of the loci (Figure 7B). When the two motifs are considered together, 51.3% of the loci contain both motifs, and 83.4% of the loci contain at least one of these two motifs.
Genes regulated by FOXK1 genomic loci
We sought to identify genes near FOXK1 genomic loci that are cell cycle regulated in HeLa cells (Whitfield et al., 2002) or show a cell cycle defect in a collation of genome-wide siRNA screens for cell cycle phenotypes (Mukherji et al., 2006; Root et al., 2006; Kittler et al., 2007; Rines et al., 2008). To determine whether there was an enrichment of FOXK1 loci near cell cycle–regulated genes, we compared the genes associated with FOXK1 loci as determined by Gene Centered Annotation (GCA) to the list of cell cycle–regulated genes in HeLa cells. We mapped the 1134 cell cycle–regulated clones of Whitfield et al. (2002) to 688 unique Entrez Gene IDs. Of these genes, 48 (7%) were linked to FOXK1 ChIP-seq loci by GCA (Supplemental Table S3). Analysis of the GCA gene models that have FOXK1 bound shows an increase in the percentage occupancy of promoters (a measure of how much of each promoter was recovered by ChIP-seq) for genes expressed in G1 and S phases (Figure 7C).
To determine whether there was a similar pattern in the siRNA screen data sets, we identified those genes linked to FOXK1 loci that also showed a cell cycle phenotype (arrest at a specific cell cycle phase or endoreduplication) after knockdown. Of the 2585 genes that showed a cell cycle arrest phenotype in at least one of the four genome-wide siRNA screens (Mukherji et al., 2006; Root et al., 2006; Kittler et al., 2007; Rines et al., 2008), 230 (9%) were linked by GCA to a FOXK1 ChIP-seq locus (Supplemental Table S4). Again, we found enrichment of genes that give an arrest in S phase but also for genes that resulted in an arrest in G2. Of interest, genes that arrest cells in G0/G1 have lower percentage occupancy than genes that give an arrest in S, G2, or M phase (Figure 7D).
Those genes associated with FOXK1 ChIP loci that have peak expression in G1/S include RUNX1, NPAT, C21orf90, and DDX12, and those with peak expression in S phase include TYMS, DHFR, ABCC5, EFHC1, MBD4, HIST1H2AC, and HIST1H4H, suggesting that FOXK1 contributes to G1- and S-phase gene expression. Genes with peak expression in G2 and M phases include TUBB, CDC27, GAS6, KIF23 and CEP70. Those associated with FOXK1 ChIP-seq loci whose genes gave S-phase arrest in genome-wide siRNA screens included HIST1H2B, NPAT, GSDMD, RPS3A, and the E2F binding partner TFDP1 (Figure 7E). Four of these genes (DHFR, TYMS, GSDMD, and TFDP1) also showed decreased mRNA expression upon FOXK1 siRNA knockdown (Figure 7G-H). The full data are available in Supplemental Tables S3 and S4.
TFDP1 shows a modest 2.6-fold decrease in mRNA expression levels after FOXK1 knockdown (Figure 7, G and H). Knockdown of TFDP1 by RNAi is known to result in cell cycle arrest (Masuhiro et al., 2008) and is embryonic lethal when it is knocked out in mice (Kohn et al., 2003). Consistent with this finding, our hE2F1 reporter failed to oscillate after FOXK1 knockdown. To better resolve the location of FOXK1 binding in the TFDP1 promoter, we examined the MACS peaks in the two independent ChIP-seq experiments (Figure 7E). We found FOXK1-binding loci in the TFDP1 promoter just upstream of the TSS and within the second, third, and fourth introns of the TFDP1 gene (Figure 7E and Supplemental Figure S4). Each of these loci contained multiple FOXK1 consensus motifs as determined by MEME. The FOXK1 ChIP-seq locus identified in the promoter by MACS is 621 base pairs upstream of its TSS (Figure 7E) and contains multiple FOXK1 motifs (Figure 7E).
In an attempt to phenocopy the FOXK1-knockdown phenotype with a FOXK1-regulated gene, we knocked down TFDP1 in cells expressing the PLK1-Luc reporter. As expected, the loss of TFDP1 expression ablates G2/M-specific luciferase activity driven by the human PLK1 promoter (Supplemental Figure S3). Therefore the loss of TFDP1, and potentially multiple other cell cycle–regulated genes bound by and responsive to FOXK1, can result in a similar cell cycle arrest upon siRNA knockdown.
We also examined DHFR, which shows peak expression in S phase and has decreased mRNA levels 72 h after FOXK1 siRNA knockdown (Figure 7H). We found a strong FOXK1 binding locus in the second intron of the gene (Figure 7F) but no evidence for binding in the DHFR promoter. Consistent with this result, we found that a DHFR promoter–luciferase reporter is not responsive to FOXK1 overexpression (see later discussion).
The 4329 FOXK1 genomic loci map to 1772 unique human genes (most genes were associated with multiple FOXK1 genomic loci), of which 1303 genes passed basic quality filtering in our FOXK1 siRNA–knockdown DNA microarray analysis. To identify genes linked to FOXK1 genomic loci that changed expression upon FOXK1 siRNA knockdown, we divided genes into groups using idealized expression vectors (see Materials and Methods) representing decreased or increased expression in the FOXK1 siRNA–knockdown time course (Supplemental Figure S5). Examination of the highest-confidence groups shows that 37% (494 genes) have a specific decrease in expression after FOXK1 knockdown relative to mock and 17.5% (228 genes) show an increase in expression (Supplemental Figures S5 and S6). Therefore FOXK1 likely acts as both an activator and a repressor of gene expression, depending on context.
Thus we propose that FOXK1 is a key regulator of an expansive set of critical cell cycle genes that includes TFDP1, DHFR, TYMS, GSDMD, and the replication-dependent histone mRNAs. The elimination of either TFDP1 or GSDMD results in a G1- or S-phase arrest, and loss of either could therefore result in the phenotype we initially identified in the LumiCycle assay.
FOXK1 can transcriptionally activate key cell cycle–regulated genes
To determine whether FOXK1 can activate target cell cycle promoters identified by ChIP-seq, we determined the ability of FOXK1 overexpression to affect luciferase activity from reporters driven by the GSDMD promoter (GSDMD-Luc, 1000 base pairs upstream of the TSS), which contains a FOXK1-binding locus and multiple FOXK1-binding motifs, or DHFR (DHFR-Luc, 1000 base pairs upstream of TSS), which does not have any FOXK1-binding loci in its promoter (a locus was detected in the second intron). Both genes are cell cycle regulated, and knockdown of GSDMD was shown to result in a cell cycle arrest at S phase in a genome-wide siRNA screen (Kittler et al., 2007 ). To test whether FOXK1 activates these promoters, we overexpressed wild-type (wt) FOXK1 or FOXK1 with a mutation in the DNA-binding domain (FOXK1 H355A), which served as a negative control (Freddie et al., 2007). Cotransfection of wt FOXK1 with GSDMD-Luc resulted in a significant increase in luciferase activity over time (Figure 8A; p < 0.05), whereas cotransfection of the DNA-binding-deficient mutant FOXK1 (H355A) showed no significant change (Table 1). In contrast, FOXK1 could not activate DHFR-Luc, which lacked a FOXK1 locus in the promoter, when cotransfected with either wt FOXK1 or FOXK1 (H355A; Figure 8B). This shows that FOXK1 can activate the transcription of one of its targets and demonstrates specificity by not activating the promoter of a target gene in which the FOXK1-binding locus identified was purely intronic. Finally, a small, 150–base pair intronic locus from DHFR containing multiple FOXK1 motifs placed in the promoter of pGL3-Basic failed to drive basal luciferase activity or show induction with expression of exogenous wt FOXK1 (unpublished data), suggesting that an intronic FOXK1-binding locus alone is not sufficient to drive transcription when placed upstream of the transcription start site.
FIGURE 8:
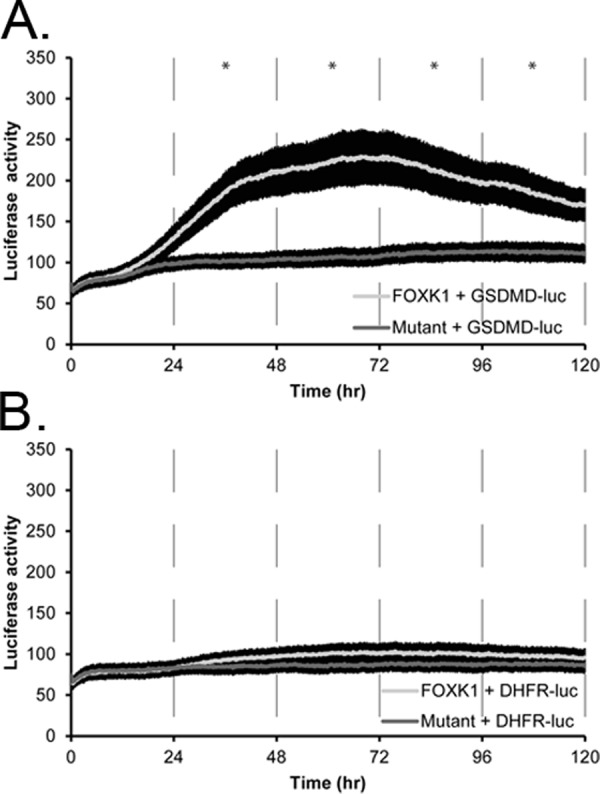
Wild-type FOXK1 activates the gasdermin D promoter (GSDMD-luc), whereas a mutant FOXK1 does not. (A) Wild-type FOXK1 (light line) activates a gasdermin D (GSDMD) promoter, whereas a DNA binding–domain mutant version of FOXK1 (dark line) does not activate transcription of luciferase. (B) Neither wild-type FOXK1 nor mutant FOXK1 (H355A) activates the promoter of DHFR that does not have any FOXK1-binding motifs and lacks any detectable FOXK1 loci in its promoter. Each line is a representative experiment with at least four replicates. Error bars are SE of the mean. Time points were binned and averaged in 24-h windows for a one-way ANOVA. *p < 0.05; all p values are given in Table 1.
TABLE 1:
Luciferase assay p values.
| Promoter construct | 0–24 h | 24–48 h | 48–72 h | 72–96 h | 96–120 h |
|---|---|---|---|---|---|
| GSDMD | 0.599 | 0.021 | 0.014 | 0.019 | 0.034 |
| DHFR | 0.919 | 0.638 | 0.400 | 0.432 | 0.527 |
| ACAP3 | 0.012 | 0.013 | 0.029 | 0.041 | 0.013 |
| Cep72a | 0.004 | 0.003 | 0.001 | 0.002 | 0.063 |
| RPS6KB1 | 0.645 | 0.002 | 0.007 | 0.016 | 0.026 |
| TFDP1 | 0.727 | 0.003 | 0.006 | 0.065 | 0.099 |
| Parp10 | 0.764 | 0.004 | 0.265 | 0.782 | 0.641 |
Readings were binned and averaged in 24-h windows. One-way ANOVAs were calculated for wild-type FOXK1 vs. DNA binding–domain mutant FOXK1 (H355A) for the quadruplicate samples that were averaged in Figures 8 and 9.
aDue to technical issues, Cep72 was performed in triplicate. Bold indicates p < 0.05.
FOXK1 genomic loci can drive luciferase activity and are activated by FOXK1 overexpression
To show that the FOXK1 genomic loci identified in our screen can drive transcription of a luciferase reporter and can be further activated by FOXK1 overexpression, we cloned five of our genomic loci that included only the DNA sequence from the intersection, upstream of luciferase in the absence of a basal promoter (pGL3-Basic). These five loci mapped within 3000 base pairs of the TSS for the genes TFDP1, RPS6KB1, ACAP3, Parp10, and Cep72. Loci ranged in size from 865 (Parp10) to 1097 base pairs (ACAP3) and contained one (RPS6KB1 and Parp10), two (TFDP1 and Cep72), or three (ACAP3) FOXK1-binding motifs as determined by MEME (Supplemental Figure S4). As previously mentioned, TFDP1 is an E2F binding partner required for the G1/S transition, RPS6KB1 encodes a member of the ribosomal S6 kinase family of serine/threonine kinases that increases protein synthesis and cell proliferation (Slattery et al., 2011), ACAP3 (also known as CENTB5) is a relatively uncharacterized GTPase regulator associated with neurodegenerative processes (Shubina et al., 2009), Parp10 is poly(ADP-ribose) polymerase that is phosphorylated by cdk2 in late G1 to S phase (Chou et al., 2006), and Cep72 is a centrosomal protein with a critical role in forming a bipolar spindle (Oshimori et al., 2009). Thus each of these proteins plays important functional roles in the cell division cycle.
To determine whether these putative regulatory loci could drive expression of luciferase in the absence of a basal promoter and whether expression of exogenous FOXK1 could activate or repress these reporter constructs, we cotransfected each into U2OS cells along with either wt FOXK1 or FOXK1 (H355A). All five of the reporters (TFDP1-Luc, RPS6KB1-Luc, ACAP3-Luc, Parp10-Luc, and Cep72-luc) resulted in expression of baseline luciferase activity in the absence of exogenous FOXK1. Four reporters (TFDP1-Luc, RPS6KB1-Luc, ACAP3-Luc, and Cep72-luc) showed a significant increase in luciferase activity over 120 h when cotransfected with wt FOXK1 but not with FOXK1 (H355A; Figure 9). The peak of induction occurred between 48 and 72 h posttransfection, and each of the four constructs showed a significant (p < 0.05) increase in luciferase activity between wt FOXK1 and FOXK1 (H355A; Table 1). The weakest induction was observed for Parp10-Luc, which showed a statistically significant difference in expression from 24 to 48 h (p = 0.004) but not from 48 to 72 h (p = 0.265).
FIGURE 9:

Wild-type FOXK1 but not mutant FOXK1 activates cell cycle promoters that contain FOXK1-binding motifs in live cells. FOXK1 (light line) activates the expression of luciferase from the ACAP3 (A), Cep72 (B), RPS6KB1 (C), or TFDP1 (D) promoter. Mutant FOXK1 (dark line) does not activate expression of luciferase from these promoters. (E) FOXK1 activates expression of the Parp10 promoter between 24 and 48 h posttransfection to a greater extent than mutant FOXK1. Each line is a representative experiment with at least three replicates. Error bars are SE of the mean. Time points were binned and averaged for every 24 h for a one-way ANOVA. *p < 0.05, **p < 0.01, ***p < 0.005. All p values are given in Table 1.
Therefore five of the FOXK1-binding loci, including parts of the promoter of TFDP1, are sufficient to drive basal expression of luciferase and can be further activated by overexpression of the wt FOXK1. We find no induction when we use the DNA-binding mutant FOXK1 (H355A). In addition, the full promoter of a sixth target, GSDMD, which contained a FOXK1 ChIP-seq locus, is also responsive to wt FOXK1 but not FOXK1 (H355A), whereas the promoter of DHFR that did not contain a ChIP-seq locus was not responsive to wt FOXK1, showing specificity of the effect.
DISCUSSION
Here we described a novel method to follow cell cycle progression in live human cells with far greater precision than was previously possible and used this to identify novel cell cycle regulators. Three luciferase reporter constructs were used—one that monitors endogenous FOXM1 activity, a second driven by the human PLK1 promoter to report the G2/M phase of the cell cycle, and a third that reports G1/S through the human E2F1 promoter. These cell cycle–controlled DNA elements faithfully report each respective phase of the cell cycle in synchronized U2OS cells based on the phasing of the luciferase rhythms in relation to the synchronization method, protein profiles, and FACS profiles after synchronization. In addition, the Forkhead DNA-binding sites in the 6xDB reporter can be bound by FOXM1. We used these novel reporters to show that targeted reduction of FOXJ3 and FOXK1 expression by siRNA in synchronous U2OS cells ablates cell cycle–dependent luciferase activity in both reporter cell lines and confirmed the cell cycle phenotype by FACS analysis and growth curves.
In U2OS cells, FOXK1 is not cell cycle regulated at the protein level (unpublished data). This is not unprecedented, as cyclin-dependent kinases are not cell cycle regulated at the mRNA level (Whitfield et al., 2002), but instead their activity is regulated by their well-characterized interactions with cyclins (Sherr, 2000). Therefore it is entirely plausible that there is a cell cycle phase–specific activation of FOXJ3 or FOXK1 due to other posttranslational modifications such as phosphorylation or cell cycle–regulated binding partners. Pointing to a possible role of FOXK1 in the cell cycle, mouse Mnf−/− (FoxK1) cells have dysregulated expression of cell cycle genes, and Mnf−/− mice are ∼40% smaller than wild-type littermates and have impaired muscle repair (Garry et al., 2000).
The ChIP-seq and gene expression data for FOXK1 allow us to propose a mechanism for its role in the cell cycle. Our data show that FOXK1 is required for the activation of an expansive set of cell cycle–regulated genes, many of which, when knocked out in published siRNA screens, result in a cell cycle arrest; these include TFDP1 and GSDMD. Thus there are numerous FOXK1 targets, any one of which might result in a cell cycle arrest when knocked out. Consistent with this, our attempts to rescue the FOXK1 cell cycle arrest phenotype by overexpressing TFDP1 failed to restore cell cycle–regulated gene expression (unpublished data). This result supports the idea that a combinatorial effect resulting from the loss of FOXK1 that includes multiple cell cycle genes results in the cell cycle arrest we observe in our screen.
Earlier publications in different model systems showed that FOXK1, when in a complex with the MADS-box SRF transcription factor or Sin3B, functions as a repressor of promoter activity (Yang et al., 2000; Freddie et al., 2007). Of interest, SRF contains a FOXK1-binding locus downstream of the TTS and shows decreased expression upon FOXK1 siRNA knockdown (Supplemental Figure S6). The repressive activity of FOXK1 when complexed with SRF is in contrast with the data presented here, which demonstrate that in the subset of genes analyzed, FOXK1 is an activator of transcriptional activity (Figures 8 and 9). It is likely that FOXK1 can be either an activator or a repressor, depending on promoter context and cell type (U2OS vs. RD18 or 293), and this is supported by our analysis of genes associated with FOXK1 genomic loci in the FOXK1 siRNA–knockdown time course, which shows genes with increased expression (e.g., are likely repressed by FOXK1) and decreased expression (e.g., FOXK1 activated as shown here). A simple mechanism for this duality may lie in the FOXK1 cofactors such as SRF, which impart a repressive function to the complex, whereas others result in activation. Of interest, FOXK1 does not appear to function as a pioneer factor, as it requires SRF for efficient recruitment to the α-actin promoter or the synthetic CArG construct (Freddie et al., 2007). This would imply that FOXK1 is more dependent on cofactors than other FOX genes, and its roles in gene expression may be much more varied, depending on complex composition.
Proposing a mechanism for the FOXJ3 cell cycle defect is more challenging, as there are no ChIP-seq data available, and current antibodies against FOXJ3 were insufficient for this purpose. The genes that cluster with FOXJ3 suggest that it may be involved in regulating a network of zinc finger–binding proteins that may affect gene expression themselves. What role these may have in cell cycle progression is unclear.
These results demonstrate that real-time luciferase assays can greatly enhance the precision and reduce the cost associated with the evaluation of potential novel regulators of cell cycle gene expression. This methodology will also facilitate development of synchronization protocols, as the need for sample collections at regular intervals over multiple cell cycles is not required. Luciferase monitoring is more cost-effective than traditional time-course experiments, fewer samples are required to achieve statistically significant data, and multiple conditions can be tested with replicates at a single time. With further refining, this technology may also prove to be a powerful tool in cancer drug assays. As a result of the assay's nondestructive nature, using real-time luciferase assays will allow screening of compounds having a limited availability due to cost or origin and will also allow for multiple treatments of the same cell population in one experiment.
MATERIALS AND METHODS
Cell lines
U2OS cells were passaged at 37°C in a humidity-controlled, CO2-equilibrated incubator in DMEM (Life Technologies, Grand Island, NY) culture medium (CM) containing 10% fetal bovine serum (FBS) and 1% penicillin/streptomycin (Pen Strep). All stable lines were passaged in a selection medium (SM) of CM and 1.5 μg/ml puromycin.
Stable U2OS hE2F1, 6xDB, and PLK1 luciferase lines were generated by cotransfection of a minimal E2F1 promoter driving luciferase (Johnson et al., 1994), a construct containing the 6xDB Forkhead consensus site (Laoukili et al., 2005), or the human PLK1 promoter (S119035, Switchgear Genomics, Menlo Park, CA), using 8 μg of plasmid with 2 μg of puromycin-resistant pBABE-puro with FuGENE 6 (Roche, Indianapolis, IN). Negative control cell lines were produced with the same protocol and plasmid insertion confirmed via PCR of the luciferase open reading frame (5′ATCCAGATCCACAACCTTCG3′; 5′AGAACTGCCTGCGTGAGATT3′).
Cell line synchronization
Thymidine-thymidine synchronizations were performed with U2OS cells in 35-mm dishes (Corning, Lowell, MA) at 2 × 10⁴ to 8 × 10⁴ cells/plate. After 24 h, thymidine was added to a final concentration of 2.5 mM. Cells were held in thymidine for 18 h, washed with 1.0 ml of prewarmed, CO2-equilibrated, 1× phosphate-buffered saline (PBS), followed by the addition of fresh selection media. After growth for 8 h, 2.5 mM thymidine was added for 18 h, and cells were again washed and released into fresh selection media. Thymidine/nocodazole synchronizations were performed with U2OS cells at 4 × 10⁴ cells/plate. After 24 h, cells were treated with 2.5 mM thymidine for 18 h, washed with 1× PBS once, and released into fresh medium with 100 ng/ml nocodazole. After 12 h, medium was removed, and floating mitotic cells were collected by centrifugation. The remaining cells were washed once with 1× PBS, and floating cells were resuspended in fresh medium and replated with the adherent population.
Real-time bioluminescence monitoring
Synchronous U2OS cells were washed with PBS and the SM replaced with 2 ml of assay medium (phenol red–free L15 [Life Technologies], 10% FBS, 1% Pen Strep, 10 mM 4-(2-hydroxyethyl)-1-piperazineethanesulfonic acid, and 0.1 mM luciferin). Tissue culture dishes were sealed with 38 circle #1 glass coverslips and silicone grease and transferred to the LumiCycle (Actimetrics, Wilmette, IL) at 36°C. Data analysis was performed with the LumiCycle Analysis software (Actimetrics). Where indicated, data were baseline subtracted using a 24-h running average. Time zero (t = 0) indicates time of release from cell cycle synchronization.
Promoter assays were performed by transfecting U2OS cells with 250 ng of each plasmid (see later description) using FuGENE 6 (Life Technologies) immediately before sealing the dishes and transferring them to the LumiCycle. Where possible, each promoter construct was placed in the LumiCycle so it would use the same photomultiplier tube. The p values were calculated using SPSS Statistics 19 (IBM, Armonk, NY) by performing a one-way analysis of variance (ANOVA) comparing the replicate wt FOXK1 transfections with the mutant FOXK1 (H355A) transfections. Luciferase readings were binned and averaged over each 24-h period.
Plasmids
DHFR (S101166), PLK1 (S119035), and GSDMD (S112693) were purchased from Switchgear Genomics. The FOXK1 (2256) and DNA-binding mutant FOXK1 (2265) (Freddie et al., 2007) constructs were gifts from A. Sharrocks. 6xDB (Furuyama et al., 2000; Laoukili et al., 2005) was a gift from R. Medema, and the minimal hE2F promoter construct (Johnson et al., 1994) was a gift from W. D. Cress. FOXM1-ER was subcloned from an ER fragment (gift from M. Cole) and FOXM1-pBABE-puro, which was cloned from human cDNA. All plasmids were sequenced to confirm that there were no errors (Molecular Biology and Proteomics Core Facility, Dartmouth College).
FOXK1 target promoters were cloned based on the ChIP-seq loci as determined by MACS. Primers were designed to flank any FOXK1 motifs and to provide an amplicon between 800 and 1000 base pairs long (Primer 3; Rozen and Skaletsky, 2000). DNA fragments were amplified by PCR and cloned into Zero Blunt TOPO (Life Technologies), and then they were subcloned into the MCS of pGL3-basic (Promega, Madison, WI) using standard methods. All inserts were sequenced to confirm their identity (Molecular Biology and Proteomics Core Facility, Dartmouth College).
siRNA transfections
Cells were transfected with siRNA (100 nM) using Oligofectamine (Life Technologies). Bioluminescence assays were performed as described, except that siRNA transfection began 24 h before the first thymidine arrest (Supplemental Figure S1B). RNA was collected 48 h after transfection to measure knockdown efficiency of each siRNA by Taqman quantitative RT-PCR. All siRNAs were obtained from Dharmacon/Thermo Fisher Scientific (Lafayette, CO): FOXJ3 (#1, GGGAAAGGUUUAAGAGAAUUU; #2, GUAGGAAACUGAAAGGAAAUU); FOXK1 (#1, GAGCAGUGGUUCUUGGAAAUU; #2, AGAACAAUGCCAAGUGAAAUU); FOXM1 (GGACCACUUUCCCUACUUU; Wang et al., 2005); and siGENOME SMARTpool, human TFDP1 (7027). Human siGENOME Non-Targeting siRNA #2 was used as a negative control.
Western blot analysis
Antibodies to FoxM1 C-20 (1:500), cyclin B1 (H-433; 1:2000), and E2F1 (C-20; 1:500) were purchased from Santa Cruz Biotechnology (Santa Cruz, CA), anti–glyceraldehyde-3-phosphate dehydrogenase (GAPDH) was purchased from American Research Products (Belmont, MA), and anti-FOXK1 (ab18196) was purchased from Abcam (Cambridge, MA). Protein was collected from each plate in SDS–PAGE sample buffer. Western blots were run following standard protocols.
Real-time PCR
All real-time PCRs were performed with an Applied Biosystems (Foster City, CA) 7500 Fast Real Time PCR system using TaqMan Fast Universal PCR Master Mix (Applied Biosystems), TaqMan Gene Expression Assays, and 5 ng of cDNA template according to manufacturer's instructions in triplicate, except that all reaction volumes were reduced by one-half. Primers used were as follows: FOXM1, Hs00153543_m1; FOXJ3, Hs00208978_m1; FOXK1, Hs01595620_m1; and GAPDH, 4352934E. All primers were purchased from Applied Biosystems. Real-time data were analyzed using the 2−ΔΔCT method (Livak and Schmittgen 2001), using GAPDH as a control.
ChIP-seq
FOXM1 chromatin immunoprecipitations were performed with Upstate Biotechnology/Millipore (Billerica, MA) ChIP assay kit protocol. Primers were obtained from Life Technologies and were as follows: 6xDB primer 1 (forward, ACGCTGTTGACGCTGTTAAG; reverse, CGAATTCGAACACGCAGAT), 6Xdb primer 2 (forward, CCACACGCGTCACCTTAATA; reverse, GCCCAGCGTCTTGTCATT), and GAPDH (forward, CAATTCCCCATCTCAGTCGT; reverse, TAGTAGCCGGGCCCTACTTT).
FOXK1 ChIP-seq was carried out as previously described (Lupien et al., 2008) using antibodies sc-133592 (G22) and sc-134550 (H140) against FOXK1 (Santa Cruz Biotechnology). Briefly, HeLa cells were fixed with 1% formaldehyde before the DNA was sonicated to a fragment length of 200–600 base pairs with a Bioruptor (Diagenode, Sparta, NJ). Antibodies were bound to a mix of protein A and protein G Dynabeads (Life Technologies) before an 18-h incubation at 4°C with the fragmented DNA. DNA was washed and cross-links reversed before purification with a QIAquick PCR purification kit (Qiagen, Valencia, CA). DNA concentrations were measured using Quant-iT PicoGreen (Life Technologies). A library was constructed from the bound fragments per manufacturer's protocols, and the DNA fragments from each independent ChIP were sequenced independently at the High Throughput Sequencing Facility, University of North Carolina at Chapel Hill (UNC; Chapel Hill, NC), using an Illumina Genome Analyzer II. Fastq files obtained from the Genome Analyzer for each run were mapped to human genome using Bowtie software (version 0.12.5), using the “best” flag to constrain reported alignments to those with the fewest mismatches and best read quality. ChIP-seq of FOXK1 using AB G22 resulted in 58 million mapped sequence reads (2.1 million unmapped), and ChIP-seq using AB134550 resulted in 65 million mapped reads (2.2 million unmapped, Human Genome build Hg19). Enriched peaks were identified independently in each data set using MACS version 1.3.7 (Zhang et al., 2008; mfold 15, p < 0.001), which resulted in 7513 peaks in AB G22 and 6225 peaks in AB1344550. As a conservative estimate of FOXK1 binding, we analyzed the intersection of the sequences under the peaks found in both experiments, resulting in 4329 shared FOXK1-binding loci. We determined the distribution of these 4329 shared FOXK1-binding loci in the genome using the Cis-regulatory Element Annotation System (CEAS; http://liulab.dfci.harvard.edu/CEAS; Zhang et al., 2008) implemented in Cistrome (www.cistrome.com). The full data are available from the Gene Expression Omnibus (GEO) repository GSE39138.
Identification of cis-acting regulatory elements
The 4329 shared loci were analyzed for cis-acting regulatory motifs. RepeatMasker Open-3.0. (www.repeatmasker.org) was used to screen input DNA for repeats and generate a modified version of the query sequence with masked repeats (replaced with N's). Sequence comparisons in RepeatMasker were performed by default search engine “cross_match” and were run with “–nolow” parameter. To analyze masked ChIPseq data and discover significant motifs with high similarity to FOXK1 site and their potential partners, we used MEME Suite (Bailey et al., 2009). Specifically, we analyzed sequences resulting from the intersection of the MACS peaks from the two experiments by MEME-ChIP (Machanick and Bailey, 2011), which is designed specifically for motif analysis in large ChIP-seq data sets. MEME-ChIP was run via Web server with default settings except for the following: motif distribution, any number of repetitions; optimum motif width, 6–10 base pairs; maximum number of motifs to find, 10.
To identify the best matches to known FOXK1 sites among motifs predicted by MEME-ChIP, we used STAMP (Mahony and Benos, 2007). We compared the output from MEME-ChIP to a manually constructed database that contained a position-weight matrix that represented the published FOXK1 motif (TAAACA; Tsai et al., 2006). A motif was considered to be a match to a FOXK1 site if STAMP E value was <1 × 10⁻⁴. STAMP was run with default settings. To find significant spacing patterns between FOXK1 matches and other motifs predicted by MEME-ChIP, we used SpaMo (Whitington et al., 2011). SpaMo was run in command line mode with the following parameters: “-margin 100 -shared 1.” Motifs that formed significant spacing patterns with FOXK1 matches were run via STAMP against TRANSFAC, version 11.3 (Matys et al., 2003), to identify potential FOXK1 cofactors. To extract all instances of each individual motif, we used FIMO in command line mode with the modified p value output threshold of 1 × 10⁻³.
RNA isolation and microarray hybridization
Asynchronous U2OS cells were transfected with siRNAs targeting FOXJ3 or FOXK1 with Oligofectamine, following the manufacturer's protocols. Experiments were performed in a time-course design. Three time-zero points were collected from untransfected cells. Time points were then harvested in parallel from the mock-transfected and the FOXJ3 and FOXK1 siRNA–transfected cells at 12, 24, 48, and 72 h after transfection. Cellular RNA was isolated using the RNeasy Plus Kit (Qiagen). Total RNA (200 ng) was amplified using the Quick-Amp Labeling Kit (Agilent Technologies, Santa Clara, CA) and hybridized to Agilent Technologies Whole Human Genome Oligonucleotide arrays (4 × 44k) following the manufacturer's protocol, except for the labeling reaction, for which volumes were reduced by half. Microarrays were scanned using a GenePix 4000B scanner (Molecular Devices, Sunnyvale, CA). Spot pixel intensities were determined by the GenePix Pro 5.1 software. Poor-quality spots were manually flagged and excluded from further analysis. Arrays were stored in the UNC Microarray Database.
Gene expression data were retrieved for each microarray from the UNC microarray database. Only spots with intensity over background of >1.5 were used for further analysis. Genes missing >20% of their data were excluded from further analysis; only genes with three observations with a log2 absolute value of ≥1.1 (a 2.14-fold change) across all three time-course experiments were selected. Gene selection and hierarchical clustering were performed using Cluster 3.0 (Eisen et al., 1998). The 24-h time point for the FOXK1 siRNA was excluded from the analysis due to a technical failure. Data were zero transformed by normalizing each time course to the average of the three zero time points. Data were visualized using Java TreeView software (Saldanha, 2004).
Functional annotation of gene clusters was performed using DAVID (Dennis et al., 2003; Huang da et al., 2009) with the following categories: cog_ontology, sp_pir_keywords, up_seq_feature, goterm_bp_fat, BBID, Biocarta, KEGG_pathway. Only categories with p < 0.05 are shown in Supplemental Table S1. The p values corrected for multiple hypothesis testing are also provided.
To identify genes associated with FOXK1 ChIP-seq loci that also showed a change in expression upon FOXK1 knockdown, we normalized the expression values of genes associated with FOXK1 loci (as determined by CEAS) to a maximum value between −1 and 1. We then constructed “ideal patterns” of expression, where perfect induction would have a 1 for each time point, perfect repression would be signified by −1, and unregulated would be indicated by 0. Because there are three expression categories and two treatment conditions, we set up 23 = 8 bins, one per pattern. For example, the “ideal pattern” for a gene that is repressed after FOXK1 siRNA treatment and unregulated after mock treatment is four zeros followed by four ones (00001111). We then normalized the ideal patterns in the same way as the gene expression data. To assign each gene to a bin, we computed the dot product of the normalized expression data for each gene to each of the eight possible ideal patterns to generate an “ideal pattern” score. We ordered each bin by the “ideal pattern” score and displayed the data using Java TreeView (Supplemental Figure S5).
FACS determination of cell cycle phase
Cell synchrony was monitored by flow cytometry of propidium iodide–stained cells (Whitfield et al., 2002). Percentage of cells in each cell cycle phase was determined with FlowJo, version 7.5 (Tree Star, Ashland, OR).
Growth curve
U2OS cells expressing the E2F1 construct were plated at a density of 6 × 10⁶ cells/well in 12-well dishes. After 24 h of growth, 100 nM siRNA was transfected with Oligofectamine, and three wells were counted using trypan blue for each time point.
The full data figures in both red/green and blue/yellow formats are available from a website maintained by the authors at http://whitfieldlab.dartmouth.edu/lumicycle.
Supplementary Material
Acknowledgments
This work supported by the V Foundation for Cancer Research, ACS-IRG 82-003-17, and National Institutes of Health Grants R01 CA130795, R01 HG004499, RO1 GM 083336, and RO1 GM 34985. We thank René Medema for providing the six–Forkhead DNA binding-site luciferase reporter, W. Douglas Cress for the hE2F1 reporter, Michael Cole for the pBABE-puro plasmid, Andrew Sharrocks for the FOXK1 expression constructs, and Tammara Wood for assistance with microarray hybridizations.
Abbreviations used:
- CEAS
cis-regulatory element annotation system
- ChIP-seq
chromatin immunoprecipitation followed by short read sequencing
- CM
culture media
- DAVID
Database for Annotation, Visualization, and Integrated Discovery
- ER
estrogen receptor
- FACS
fluorescence-activated cell sorting
- FOX
Forkhead Box
- GCA
Gene Centered Annotation
- MACS
model-based analysis of chip-seq
- MEME
multiple em for motif elicitation
- 4OHT
4-hydroxytamoxifen
- PI
propidium iodide
- SE
standard error of the mean
- siRNA
small interfering RNA
- SM
selection media
- thy-thy
thymidine-thymidine
- thy-noc
thymidine-nocodazole
- TSS
transcription start site
- TTS
transcription termination site
- UTR
untranslated region
Footnotes
This article was published online ahead of print in MBoC in Press (http://www.molbiolcell.org/cgi/doi/10.1091/mbc.E11-02-0170) on June 27, 2012.
REFERENCES
- Bailey TL. DREME: motif discovery in transcription factor ChIP-seq data. Bioinformatics. 2011;27(12):1653–1659. doi: 10.1093/bioinformatics/btr261. [DOI] [PMC free article] [PubMed] [Google Scholar]
- Bailey TL, Boden M, Buske FA, Frith M, Grant CE, Clementi L, Ren J, Li WW, Noble WS. MEME SUITE: tools for motif discovery and searching. Nucleic Acids Res. 2009;37((Web Server issue)):W202–W208. doi: 10.1093/nar/gkp335. [DOI] [PMC free article] [PubMed] [Google Scholar]
- Bar-Joseph Z, Siegfried Z, Brandeis M, Brors B, Lu Y, Eils R, Dynlacht BD, Simon I. Genome-wide transcriptional analysis of the human cell cycle identifies genes differentially regulated in normal and cancer cells. Proc Natl Acad Sci USA. 2008;105(3):955–960. doi: 10.1073/pnas.0704723105. [DOI] [PMC free article] [PubMed] [Google Scholar]
- Chandriani S, Frengen E, Cowling VH, Pendergrass SA, Perou CM, Whitfield ML, Cole MD. A core MYC gene expression signature is prominent in basal-like breast cancer but only partially overlaps the core serum response. PLoS One. 2009;4:e6693. doi: 10.1371/journal.pone.0006693. [DOI] [PMC free article] [PubMed] [Google Scholar]
- Chang HY, Sneddon JB, Alizadeh AA, Sood R, West RB, Montgomery K, Chi JT, van de Rijn M, Botstein D, Brown PO. Gene expression signature of fibroblast serum response predicts human cancer progression: similarities between tumors and wounds. PLoS Biol. 2004;2:E7. doi: 10.1371/journal.pbio.0020007. [DOI] [PMC free article] [PubMed] [Google Scholar]
- Cho RJ, Huang M, Campbell MJ, Dong H, Steinmetz L, Sapinoso L, Hampton G, Elledge SJ, Davis RW, Lockhart DJ. Transcriptional regulation and function during the human cell cycle. Nat Genet. 2001;27:48–54. doi: 10.1038/83751. [DOI] [PubMed] [Google Scholar]
- Chou HY, Chou HT, Lee SC. CDK-dependent activation of poly(ADP-ribose) polymerase member 10 (PARP10) J Biol Chem. 2006;281:15201–15207. doi: 10.1074/jbc.M506745200. [DOI] [PubMed] [Google Scholar]
- Dennis G, Jr, Sherman BT, Hosack DA, Yang J, Gao W, Lane HC, Lempicki RA. DAVID: Database for Annotation, Visualization, and Integrated Discovery. Genome Biol. 2003;4:P3. [PubMed] [Google Scholar]
- Eisen MB, Spellman PT, Brown PO, Botstein D. Cluster analysis and display of genome-wide expression patterns. Proc Natl Acad Sci USA. 1998;95:14863–14868. doi: 10.1073/pnas.95.25.14863. [DOI] [PMC free article] [PubMed] [Google Scholar]
- Freddie CT, Ji Z, Marais A, Sharrocks AD. Functional interactions between the Forkhead transcription factor FOXK1 and the MADS-box protein SRF. Nucleic Acids Res. 2007;35:5203–5212. doi: 10.1093/nar/gkm528. [DOI] [PMC free article] [PubMed] [Google Scholar]
- Fu Z, Malureanu L, Huang J, Wang W, Li H, van Deursen JM, Tindal DJ, Chen J. Plk1-dependent phosphorylation of FoxM1 regulates a transcriptional programme required for mitotic progression. Nat Cell Biol. 2008;10:1076–1082. doi: 10.1038/ncb1767. [DOI] [PMC free article] [PubMed] [Google Scholar]
- Furuyama T, Nakazawa T, Nakano I, Mori N. Identification of the differential distribution patterns of mRNAs and consensus binding sequences for mouse DAF-16 homologues. Biochem J. 2000;349:629–634. doi: 10.1042/0264-6021:3490629. [DOI] [PMC free article] [PubMed] [Google Scholar]
- Gamsby JJ, Loros JJ, Dunlap JC. A phylogenetically conserved DNA damage response resets the circadian clock. J Biol Rhythms. 2009;24:193–202. doi: 10.1177/0748730409334748. [DOI] [PMC free article] [PubMed] [Google Scholar]
- Garry DJ, Meeson A, Elterman J, Zhao Y, Yang P, Bassel-Duby R, Williams RS. Myogenic stem cell function is impaired in mice lacking the forkhead/winged helix protein MNF. Proc Natl Acad Sci USA. 2000;97:5416–5421. doi: 10.1073/pnas.100501197. [DOI] [PMC free article] [PubMed] [Google Scholar]
- Huang da W, Sherman BT, Lempicki RA. Systematic and integrative analysis of large gene lists using DAVID bioinformatics resources. Nat Protoc. 2009;4:44–57. doi: 10.1038/nprot.2008.211. [DOI] [PubMed] [Google Scholar]
- Huang H, Tindall DJ. Dynamic FoxO transcription factors. J Cell Sci. 2007;120:2479–2487. doi: 10.1242/jcs.001222. [DOI] [PubMed] [Google Scholar]
- Hwang A, Maity A, McKenna WG, Muschel RJ. Cell cycle-dependent regulation of the cyclin B1 promoter. J Biol Chem. 1995;270:28419–28424. doi: 10.1074/jbc.270.47.28419. [DOI] [PubMed] [Google Scholar]
- Iyer VR, et al. The transcriptional program in the response of human fibroblasts to serum. Science. 1999;283:83–87. doi: 10.1126/science.283.5398.83. [DOI] [PubMed] [Google Scholar]
- Johnson DG, Ohtani K, Nevins JR. Autoregulatory control of E2F1 expression in response to positive and negative regulators of cell cycle progression. Genes Dev. 1994;8:1514–1525. doi: 10.1101/gad.8.13.1514. [DOI] [PubMed] [Google Scholar]
- Kaestner KH, Knochel W, Martinez DE. Unified nomenclature for the winged helix/forkhead transcription factors. Genes Dev. 2000;14:142–146. [PubMed] [Google Scholar]
- Kaida A, Sawai N, Sakaguchi K, Miura M. Fluorescence kinetics in HeLa cells after treatment with cell cycle arrest inducers visualized with Fucci (fluorescent ubiquitination-based cell cycle indicator) Cell Biol Int. 2011;35:359–363. doi: 10.1042/CBI20100643. [DOI] [PubMed] [Google Scholar]
- Kittler R, et al. Genome-scale RNAi profiling of cell division in human tissue culture cells. Nat Cell Biol. 2007;9:1401–1412. doi: 10.1038/ncb1659. [DOI] [PubMed] [Google Scholar]
- Kohn MJ, Bronson RT, Harlow E, Dyson NJ, Yamasaki L. Dp1 is required for extra-embryonic development. Development. 2003;130:1295–1305. doi: 10.1242/dev.00355. [DOI] [PubMed] [Google Scholar]
- Laoukili J, Alvarez-Fernandez M, Stahl M, Medema RH. FoxM1 is degraded at mitotic exit in a Cdh1-dependent manner. Cell Cycle. 2008;7:2720–2726. doi: 10.4161/cc.7.17.6580. [DOI] [PubMed] [Google Scholar]
- Laoukili J, Kooistra MR, Bras A, Kauw J, Kerkhoven RM, Morrison A, Clevers H, Medema RH. FoxM1 is required for execution of the mitotic programme and chromosome stability. Nat Cell Biol. 2005;7:126–136. doi: 10.1038/ncb1217. [DOI] [PubMed] [Google Scholar]
- Lemasters JJ, Hackenbrock CR. Kinetics of product inhibition during firefly luciferase luminescence. Biochemistry. 1977;16:445–447. doi: 10.1021/bi00622a016. [DOI] [PubMed] [Google Scholar]
- Li J, et al. Synergistic function of E2F7 and E2F8 is essential for cell survival and embryonic development. Dev Cell. 2008;14:62–75. doi: 10.1016/j.devcel.2007.10.017. [DOI] [PMC free article] [PubMed] [Google Scholar]
- Liu T, et al. Cistrome: an integrative platform for transcriptional regulation studies. Genome Biol. 2011;12:R83. doi: 10.1186/gb-2011-12-8-r83. [DOI] [PMC free article] [PubMed] [Google Scholar]
- Livak KJ, Schmittgen TD. Analysis of relative gene expression data using real-time quantitative PCR and the 2(-Delta Delta C(T)) method. Methods. 2001;25:402–408. doi: 10.1006/meth.2001.1262. [DOI] [PubMed] [Google Scholar]
- Lupien M, Eeckhoute J, Meyer CA, Wang Q, Zhang Y, Li W, Carroll JS, Liu XS, Brown M. FoxA1 translates epigenetic signatures into enhancer-driven lineage-specific transcription. Cell. 2008;132:958–970. doi: 10.1016/j.cell.2008.01.018. [DOI] [PMC free article] [PubMed] [Google Scholar]
- Luscher-Firzlaff JM, Lilischkis R, Luscher B. Regulation of the transcription factor FOXM1c by cyclin E/CDK2. FEBS Lett. 2006;580:1716–1722. doi: 10.1016/j.febslet.2006.02.021. [DOI] [PubMed] [Google Scholar]
- Machanick P, Bailey TL. MEME-ChIP: motif analysis of large DNA datasets. Bioinformatics. 2011;27:1696–1697. doi: 10.1093/bioinformatics/btr189. [DOI] [PMC free article] [PubMed] [Google Scholar]
- Mahony S, Benos PV. STAMP: a web tool for exploring DNA-binding motif similarities. Nucleic Acids Res. 2007;35((Web Server issue)):W253–W258. doi: 10.1093/nar/gkm272. [DOI] [PMC free article] [PubMed] [Google Scholar]
- Marti A, Wirbelauer C, Scheffner M, Krek W. Interaction between ubiquitin-protein ligase SCFSKP2 and E2F-1 underlies the regulation of E2F-1 degradation. Nat Cell Biol. 1999;1:14–19. doi: 10.1038/8984. [DOI] [PubMed] [Google Scholar]
- Masuhiro Y, Kayama K, Fukushima A, Baba K, Soutsu M, Kamiya Y, Gotoh M, Yamaguchi N, Hanazawa S. SOCS-3 inhibits E2F/DP-1 transcriptional activity and cell cycle progression via interaction with DP-1. J Biol Chem. 2008;283:31575–31583. doi: 10.1074/jbc.M800328200. [DOI] [PMC free article] [PubMed] [Google Scholar]
- Matys V, et al. TRANSFAC: transcriptional regulation, from patterns to profiles. Nucleic Acids Res. 2003;31:374–378. doi: 10.1093/nar/gkg108. [DOI] [PMC free article] [PubMed] [Google Scholar]
- Mukherji M, et al. Genome-wide functional analysis of human cell-cycle regulators. Proc Natl Acad Sci USA. 2006;103:14819–14824. doi: 10.1073/pnas.0604320103. [DOI] [PMC free article] [PubMed] [Google Scholar]
- Oshimori N, Li X, Ohsugi M, Yamamoto T. Cep72 regulates the localization of key centrosomal proteins and proper bipolar spindle formation. EMBO J. 2009;28:2066–2076. doi: 10.1038/emboj.2009.161. [DOI] [PMC free article] [PubMed] [Google Scholar]
- Rines DR, et al. Whole genome functional analysis identifies novel components required for mitotic spindle integrity in human cells. Genome Biol. 2008;9:R44. doi: 10.1186/gb-2008-9-2-r44. [DOI] [PMC free article] [PubMed] [Google Scholar]
- Robertson JB, Stowers CC, Boczko E, Johnson CH. Real-time luminescence monitoring of cell-cycle and respiratory oscillations in yeast. Proc Natl Acad Sci USA. 2008;105:17988–17993. doi: 10.1073/pnas.0809482105. [DOI] [PMC free article] [PubMed] [Google Scholar]
- Root DE, Hacohen N, Hahn WC, Lander ES, Sabatini DM. Genome-scale loss-of-function screening with a lentiviral RNAi library. Nat Methods. 2006;3:715–719. doi: 10.1038/nmeth924. [DOI] [PubMed] [Google Scholar]
- Rozen S, Skaletsky H. Primer3 on the WWW for general users and for biologist programmers. Methods Mol Biol. 2000;132:365–386. doi: 10.1385/1-59259-192-2:365. [DOI] [PubMed] [Google Scholar]
- Saldanha AJ. Java TreeView—extensible visualization of microarray data. Bioinformatics. 2004;20:3246–3248. doi: 10.1093/bioinformatics/bth349. [DOI] [PubMed] [Google Scholar]
- Sherr CJ. The Pezcoller Lecture: cancer cell cycles revisited. Cancer Res. 2000;60:3689–3695. [PubMed] [Google Scholar]
- Shibutani ST, de la Cruz AF, Tran V, Turbyfill WJ, 3rd, Reis T, Edgar BA, Duronio RJ. Intrinsic negative cell cycle regulation provided by PIP box- and Cul4Cdt2-mediated destruction of E2f1 during S phase. Dev Cell. 2008;15:890–900. doi: 10.1016/j.devcel.2008.10.003. [DOI] [PMC free article] [PubMed] [Google Scholar]
- Shubina DM, Suchkova IO, Slominskaia NA, Alenina N, Bader M, Patkin EL. CENTB5 gene expression in human and mouse [in Russian] Mol Biol (Mosk) 2009;43((3)):407–413. [PubMed] [Google Scholar]
- Slattery ML, Lundgreen A, Herrick JS, Wolff RK. Genetic variation in RPS6KA1, RPS6KA2, RPS6KB1, RPS6KB2, and PDK1 and risk of colon or rectal cancer. Mutat Res. 2011;706:13–20. doi: 10.1016/j.mrfmmm.2010.10.005. [DOI] [PMC free article] [PubMed] [Google Scholar]
- Stacey DW, Hitomi M. Cell cycle studies based upon quantitative image analysis. Cytometry A. 2008;73:270–278. doi: 10.1002/cyto.a.20511. [DOI] [PubMed] [Google Scholar]
- Tsai KL, Huang CY, Chang CH, Sun YJ, Chuang WJ, Hsiao CD. Crystal structure of the human FOXK1a-DNA complex and its implications on the diverse binding specificity of winged helix/forkhead proteins. J Biol Chem. 2006;281:17400–17409. doi: 10.1074/jbc.M600478200. [DOI] [PubMed] [Google Scholar]
- Wang IC, Chen YJ, Hughes D, Petrovic V, Major ML, Park HJ, Tan Y, Ackerson T, Costa RH. Forkhead box M1 regulates the transcriptional network of genes essential for mitotic progression and genes encoding the SCF (Skp2-Cks1) ubiquitin ligase. Mol Cell Biol. 2005;25:10875–10894. doi: 10.1128/MCB.25.24.10875-10894.2005. [DOI] [PMC free article] [PubMed] [Google Scholar]
- Welsh DK, Yoo SH, Liu AC, Takahashi JS, Kay SA. Bioluminescence imaging of individual fibroblasts reveals persistent, independently phased circadian rhythms of clock gene expression. Curr Biol. 2004;14:2289–2295. doi: 10.1016/j.cub.2004.11.057. [DOI] [PMC free article] [PubMed] [Google Scholar]
- Whitfield ML, et al. Identification of genes periodically expressed in the human cell cycle and their expression in tumors. Mol Biol Cell. 2002;13:1977–2000. doi: 10.1091/mbc.02-02-0030.. [DOI] [PMC free article] [PubMed] [Google Scholar]
- Whitington T, Frith MC, Johnson J, Bailey TL. Inferring transcription factor complexes from ChIP-seq data. Nucleic Acids Res. 2011;39:e98. doi: 10.1093/nar/gkr341. [DOI] [PMC free article] [PubMed] [Google Scholar]
- Wierstra I, Alves J. FOXM1, a typical proliferation-associated transcription factor. Biol Chem. 2007;388:1257–1274. doi: 10.1515/BC.2007.159. [DOI] [PubMed] [Google Scholar]
- Wonsey DR, Follettie MT. Loss of the forkhead transcription factor FoxM1 causes centrosome amplification and mitotic catastrophe. Cancer Res. 2005;65:5181–5189. doi: 10.1158/0008-5472.CAN-04-4059. [DOI] [PubMed] [Google Scholar]
- Yang Q, Kong Y, Rothermel B, Garry DJ, Bassel-Duby R, Williams RS. The winged-helix/forkhead protein myocyte nuclear factor beta (MNF-beta) forms a co-repressor complex with mammalian sin3B. Biochem J. 2000;345:335–343. [PMC free article] [PubMed] [Google Scholar]
- Yeom M, Pendergast JS, Ohmiya Y, Yamazaki S. Circadian-independent cell mitosis in immortalized fibroblasts. Proc Natl Acad Sci USA. 2010;107:9665–9670. doi: 10.1073/pnas.0914078107. [DOI] [PMC free article] [PubMed] [Google Scholar]
- Yoo SH, et al. PERIOD2::LUCIFERASE real-time reporting of circadian dynamics reveals persistent circadian oscillations in mouse peripheral tissues. Proc Natl Acad Sci USA. 2004;101:5339–5346. doi: 10.1073/pnas.0308709101. [DOI] [PMC free article] [PubMed] [Google Scholar]
- Zalmas LP, Zhao X, Graham AL, Fisher R, Reilly C, Coutts AS, La Thangue NB. DNA-damage response control of E2F7 and E2F8. EMBO Rep. 2008;9:252–259. doi: 10.1038/sj.embor.7401158. [DOI] [PMC free article] [PubMed] [Google Scholar]
- Zhang EE, et al. A genome-wide RNAi screen for modifiers of the circadian clock in human cells. Cell. 2009;139:199–210. doi: 10.1016/j.cell.2009.08.031. [DOI] [PMC free article] [PubMed] [Google Scholar]
- Zhang Y, et al. Model-based analysis of ChIP-Seq (MACS) Genome Biol. 2008;9:R137. doi: 10.1186/gb-2008-9-9-r137. [DOI] [PMC free article] [PubMed] [Google Scholar]
Associated Data
This section collects any data citations, data availability statements, or supplementary materials included in this article.