

This study reveals the 3D structure of the CSC and its connections to three major axonemal complexes involved in dynein regulation, including the distal radial spoke and the nexin-DRC. The findings corroborate radial spoke heterogeneity and suggest a unique role for the distal spoke in calcium-mediated signal transduction and flagellar motility.
Abstract
Motile cilia and flagella are highly conserved organelles that play important roles in human health and development. We recently discovered a calmodulin- and spoke-associated complex (CSC) that is required for wild-type motility and for the stable assembly of a subset of radial spokes. Using cryo–electron tomography, we present the first structure-based localization model of the CSC. Chlamydomonas flagella have two full-length radial spokes, RS1 and RS2, and a shorter RS3 homologue, the RS3 stand-in (RS3S). Using newly developed techniques for analyzing samples with structural heterogeneity, we demonstrate that the CSC connects three major axonemal complexes involved in dynein regulation: RS2, the nexin–dynein regulatory complex (N-DRC), and RS3S. These results provide insights into how signals from the radial spokes may be transmitted to the N-DRC and ultimately to the dynein motors. Our results also indicate that although structurally very similar, RS1 and RS2 likely serve different functions in regulating flagellar motility.
INTRODUCTION
Motile cilia and flagella are found on diverse eukaryotic cell types, ranging from unicellular protists to human epithelial cells. Defects in cilia and flagella have been linked to a number of human diseases, called ciliopathies (Afzelius, 2004; Fliegauf et al., 2007). The core structure of these motile organelles is the highly conserved axoneme (Figure 1), which has a nine-plus-two arrangement of nine doublet microtubules (DMTs) surrounding a central apparatus (CA) with two singlet microtubules (MTs; Figure 1D). Each DMT is built of multiple copies of a 96-nm-long axonemal unit that repeats along the doublet length (Figure 1, A and C). Attached to the DMTs are two rows of dynein motors—the inner and outer arms (IAs and OAs; Figure 1, A and B)—as well as radial spokes (RSs), which connect the DMTs to the CA (Figure 1, A–C; e.g., Porter and Sale, 2000), and the nexin–dynein regulatory complex (N-DRC), which connects neighboring DMTs (Heuser et al., 2009).
FIGURE 1:

Ultrastructure of the Chlamydomonas axoneme. (A, B) Isosurface renderings show the 3D structure of the 96-nm-long, axonemal repeat unit after subtomogram averaging in a longitudinal (A) and a cross-sectional (B) view observed from the proximal end. Key axonemal structures are colored, including the N-DRC, RS1 and RS2, as well as the recently described radial spoke 3 stand-in RS3S (Barber et al., 2012), and the inner and outer dynein arms (IA, OA). The IAs are labeled 1–6, including the doublet-specific IAX (Nicastro, 2009), and the protofilaments of the A- and B-tubules (At, Bt) are numbered according to Linck and Stephens (2007) in B. The color coding is preserved in all subsequent figures. (C, D) A 20-nm-thick longitudinal (C) and a 50-nm-thick cross-sectional slice (D) through a cryo–electron tomogram show different views of an intact Chlamydomonas axoneme. Red boxes highlight one 96-nm repeat unit of one of the nine doublet microtubules (DMT) that surround the central apparatus (CA). Scale bar for C and D, 50 nm.
Ciliary and flagellar motility is driven by the dynein motors, which generate sliding movement between adjacent DMTs (Satir, 1968; Summers and Gibbons, 1971; Brokaw, 1972). To produce the high beat frequencies and complex waveforms characteristic of beating cilia and flagella requires precise coordination of dynein-driven MT sliding (Satir, 1985). Substantial data indicate that the I1 dynein complex, the N-DRC, RSs, and the CA provide regulatory cues essential for coordinating dynein activity and MT sliding between subsets of DMTs (reviewed in Porter and Sale, 2000; Smith and Yang, 2004).
In addition to the basic switching mechanisms that produce simple oscillatory bends, ciliary and flagellar motility is regulated by changes in intracellular calcium concentration. This regulation may include changes in beat frequency, waveform, or the direction of bend (Naitoh and Kaneko, 1972; Brokaw et al., 1974; Brokaw, 1979; Verdugo, 1980; Izumi and Miki-Noumura, 1985). Among the 400+ polypeptides that comprise the axonemal proteome, several calcium-binding proteins, including calmodulin (CaM), have been discovered (Pazour et al., 2005). We and others have shown that CaM plays an important role in motility and is associated with several axonemal structures, including the RSs and the CA (Gitelman and Witman, 1980; Witman and Minervini, 1982; Hisanaga and Pratt, 1984; Hirano and Watanabe, 1985; Otter, 1989; Yang et al., 2001; Smith, 2002; Wargo et al., 2005; Dymek and Smith, 2007; DiPetrillo and Smith, 2009, 2010). However, the mechanism by which CaM modulates microtubule sliding to regulate motility is largely unknown.
Defining this mechanism will require identifying axonemal CaM-interacting proteins, as well as determining their precise location in the axoneme. Using the single-celled green algae Chlamydomonas reinhardtii as a model organism, we have made significant progress toward achieving this goal (Wargo et al., 2005; Dymek and Smith, 2007; DiPetrillo and Smith, 2010, 2011; Goduti and Smith, 2012). Using antibodies generated against CaM and an immunoprecipitation approach, we identified a CaM- and spoke-associated complex (CSC) comprised of three polypeptides (CaM-IP2, CaM-IP3, and CaM-IP4; Dymek and Smith, 2007). One polypeptide, CaM-IP2, interacts directly with CaM, as well as with the RS protein RSP3. A mutation in the gene encoding RSP3 results in a failure to assemble the RS pair in the Chlamydomonas mutant pf14 (Luck et al., 1977; Piperno et al., 1981; Diener et al., 1990, 1993). Therefore, on the basis of the interaction of CaM-IP2 with RSP3, we suspected that the CSC is localized to the base of the RS.
Whereas Chlamydomonas flagella have two full-length RSs per 96-nm axonemal repeat—the proximal RS1 and the more distal RS2—the cilia and flagella of many other organisms, such as the protist Tetrahymena, sea urchins, and mammals, have an additional spoke—RS3—distal to RS2 (Dentler and Cunningham, 1977; Olson and Linck, 1977; Piperno et al., 1977; Goodenough and Heuser, 1985; Nicastro et al., 2005, 2006; Lin et al., 2012). Recent studies of Chlamydomonas flagella using cryo–electron tomography (cryo-ET) revealed the presence of a complex, named radial spoke 3 stand-in (RS3S; Barber et al., 2012), that is shorter than RS1 and RS2 but attaches to the same location where RS3 would be found in an organism with triplet RSs (Nicastro et al., 2006; Bui et al., 2009; Barber et al., 2012). In fact, two recent structural studies compared the Chlamydomonas RS3S with RS3 in Tetrahymena cilia (Pigino et al., 2011) and sea urchin sperm flagella (Lin et al., 2012) and demonstrated that RS3S is the conserved base of RS3.
To further explore the functional significance of the CSC association with the spokes, we recently reduced expression of either of two CSC components in Chlamydomonas flagella using an artificial microRNA (amiRNA) technique; our functional analyses of these mutants demonstrated that the CSC plays a role in regulating dynein-driven microtubule sliding and control of wild-type (WT) flagellar beating (Dymek et al., 2011). Surprisingly, we also observed that axonemes isolated from these amiRNA strains had many axonemal repeats in which one spoke was lacking. Using cryo-ET, we determined the missing spoke to always be RS2. On the basis of these analyses, we hypothesized that the CSC must be associated with RS2 but not with RS1. Our results also implied that the RSs are not homogenous in composition as previously believed. This hypothesis is now supported by structural data that demonstrate that RS1 and RS2 exhibit some structural differences at their base where the spoke attaches to the DMT in Chlamydomonas as well as in other species (Pigino et al., 2011; Barber et al., 2012; Lin et al., 2012).
What these initial studies could not provide is a precise localization for the CSC, including the relationship between the CSC and the unique structures associated with the base of the spokes, RS2 in particular. Cryo-ET combined with subtomogram averaging of many axonemal repeats has been a powerful approach for visualizing axonemal structures with 3- to 4-nm resolution (Nicastro et al., 2006, 2011; Bui et al., 2008, 2009; Heuser et al., 2009; Pigino et al., 2011, 2012; Barber et al., 2012; Lin et al., 2012). However, the structural heterogeneity exhibited by the CSC amiRNA mutants made averaging of axonemal repeats particularly challenging (Dymek et al., 2011).
In this study we improved the subtomographic averages considerably by first classifying the axonemal repeats into homogeneous subsets. This process allowed us to provide a complete three-dimensional (3D) structural characterization of CSC amiRNA mutants and the first structure-based localization model of the CSC. Our results show that the CSC is localized not only to the base of RS2, but also to RS3S, and links to the N-DRC, suggesting that the CSC provides a structural connection between the two RS structures and the N-DRC. We also report that, in fact, two of the three CSC subunits correspond to RSP18 and RSP19. These results provide additional evidence for biochemical and structural heterogeneity among all RSs and suggest that particular spokes may play unique roles in regulating dynein-driven microtubule sliding and thus flagellar motility. In addition, our findings raise important questions about the role of the CSC in motility, as well as in assembly and targeting of the RSs to the DMTs.
RESULTS
CaM-IP2 and CaM-IP3 correspond to RSP18 and RSP19, respectively
The CSC is a complex of three polypeptides associated with CaM (Dymek and Smith, 2007). We tentatively named the CSC components CaM-IP2, CaM-IP3, and CaM-IP4 based on their ability to coimmunoprecipitate with antibodies generated against CaM, as well as against antibodies generated against CaM-IP2 (Dymek and Smith, 2007). We also demonstrated that CaM-IP2 interacts directly with CaM and RSP3, and when the complex is extracted from WT axonemes it cosediments at 20S with the RSs (Dymek and Smith, 2007). Because the CSC assembles onto the axoneme of the spokeless mutant pf14, we assumed that the complex did not correspond to any of the 23 polypeptides previously identified as spoke components (Piperno et al., 1977, 1981; Huang et al., 1981; Yang et al., 2006; Yang and Smith, 2009). However, additional biochemical analyses now provide strong evidence that CaM-IP2 and CaM-IP3 are in fact RSP18 and RSP19, respectively.
RSP1–17 were initially identified as spoke proteins based on their absence from two-dimensional (2D) gels of pf14 axonemes compared with WT (Piperno et al., 1977, 1981; Huang et al., 1981). RSP18–23 were identified as spoke proteins using biochemical methods to extract and isolate RSs by sucrose density gradient centrifugation (Yang et al., 2001, 2006; Yang and Smith, 2009). The extracted spokes sediment at 20S; all 23 RSPs are missing from the 20S fraction of axonemal extracts obtained from the spokeless mutant pf14 (Yang et al., 2001).
As we previously showed, CaM-IP2 antibodies immunoprecipitate the CSC and associated spokes from WT axonemal KI extracts (Dymek and Smith, 2007). If we now directly compare these CaM-IP2 immunoprecipitates to the 20S fraction of WT axonemes containing nearly purified RSs (and associated CSC), we detect no differences in the polypeptide composition of these two samples (Figure 2A; note that to resolve the CSC and RSPs of the same molecular weight, 7% acrylamide gels were used for SDS–PAGE, showing only polypeptides with molecular weights >50 kDa). Of note, CaM-IP2 and CaM-IP3 have the same apparent molecular weight as the polypeptides previously identified as RSP18 and RSP19, respectively. The apparent molecular weights of RSP18 and RSP19 were reported to be 210 and 140 kDa, respectively (Yang et al., 2006). These are the same apparent molecular weights of CaM-IP2 and CaM-IP3 as judged by SDS–PAGE (Figure 2A; Dymek and Smith, 2007; Dymek et al., 2011). In addition, the predicted isoelectric points of CaM-IP2 and CaM-IP3 as determined by their amino acid sequences are 4.7 and 4.8, respectively (Dymek and Smith, 2007), which are similar to the reported isoelectric points of RSP18 and RSP19, 5.4 and 5.5, respectively (Yang et al., 2006).
FIGURE 2:
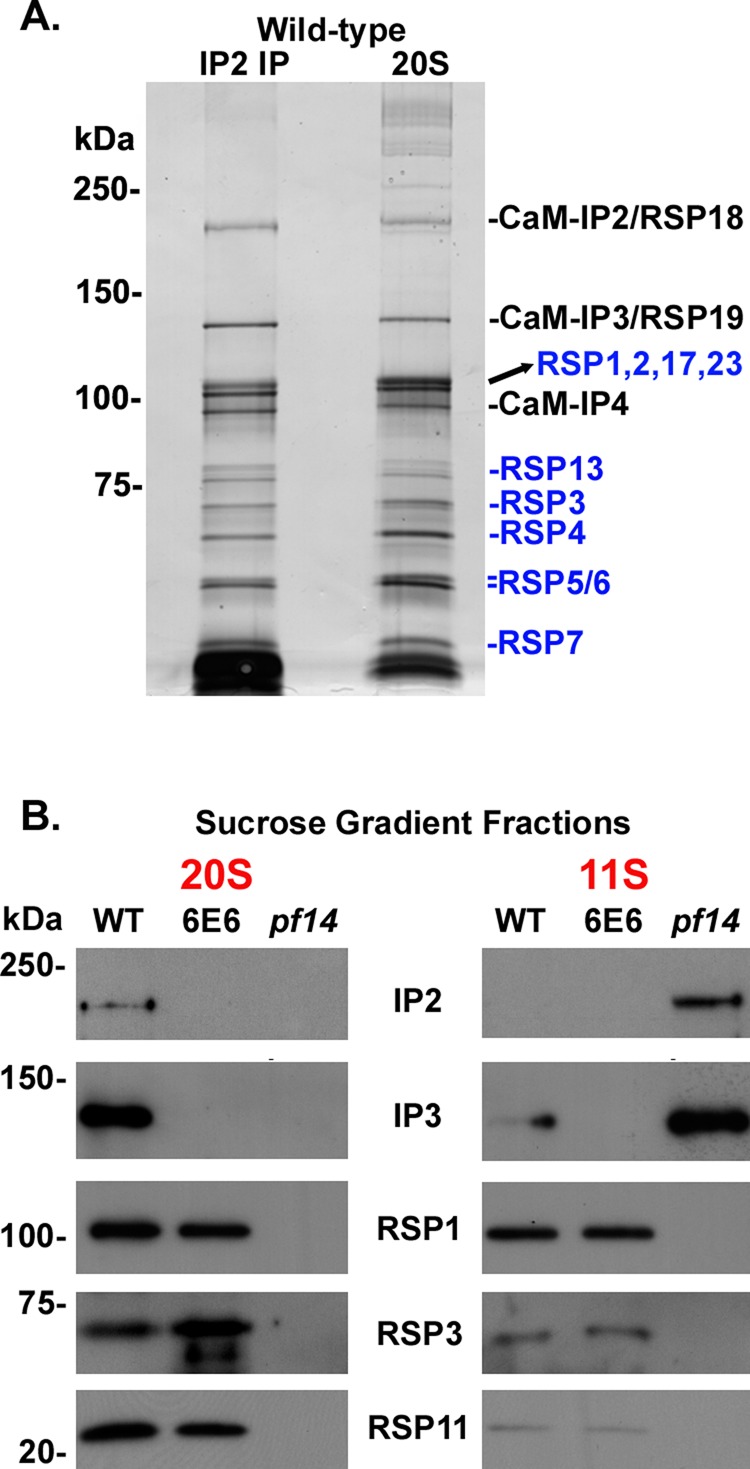
CSC components most likely correspond to RSP18 and RSP19. (A) Silver-stained gels comparing anti-CaM-IP2 immunoprecipitates with the 20S sucrose gradient fraction prepared from axonemal extracts isolated from WT cells. The polypeptide profile (as judged by the number of polypeptides and molecular weight) of precipitates using anti–CaM-IP2 antibodies appears identical to that of the 20S fraction from sucrose gradients using axonemal extracts from WT cells. The CSC components and RSPs are labeled. Two proteins labeled as RSP18 and RSP19 are the same molecular weight as CSC components CaM-IP2 and CaM-IP3, respectively. (B) Western blots of 20S and 11S fractions from sucrose gradients prepared using axonemal extracts isolated from WT, 6E6, and pf14 cells. The CSC is missing in the 20S sucrose gradient fraction of pf14 axonemal extracts yet is present in the 11S fraction. Anti–CaM-IP2 and -IP3 antibodies are used as probes to identify fractions containing the CSC. RSP1, RSP3, and RSP11 are used as probes to identify the RS head (RSP1) and stalk (RSP3 and RSP11). RSP3 is posttranslationally modified in 6E6 and as a consequence migrates more rapidly in SDS–PAGE.
Analysis of sucrose gradient fractions from mutant and WT axonemes provides further support for our conclusion that CaM-IP2 and -IP3 are RSP18 and RSP19, respectively. RSP18–23 were identified as RSPs because they were missing from the 20S fraction of axonemal extracts isolated from pf14 axonemes. Therefore we compared the fractions isolated from WT axonemal extracts with those isolated from 6E6 (amiRNA mutant knockdown of CaM-IP3, missing both CaM-IP2 and -IP3) and pf14 axonemes. As expected, we found that in extracts obtained from 6E6 the spokes but not the CSC still sediment at 20S, whereas both the spokes and CSC are absent from the 20S fraction isolated from pf14 axonemes (Yang et al., 2001; Dymek and Smith, 2007). However, the CSC is not missing from pf14 axonemes; instead, in the absence of the spokes the CSC sediments at 11S. Our Western blots of the sucrose gradient fractions clearly show that the two bands of CaM-IP2 and -IP3 shift from the 20S fraction in WT to the 11S fraction in pf14 extracts (Figure 2B), suggesting that CaM-IP2 and -IP3 (RSP18 and RSP19) belong to a spoke-associated complex but are not part of those radial spoke structures that are missing in pf14 mutant axonemes.
Cryo-ET combined with subtomogram averaging reveals structural defects and heterogeneity in axonemal repeats of CSC amiRNA mutants
We used cryo-ET and subtomogram averaging to compare the axonemal 3D structure of a pseudo wild-type (pWT) strain (see Table 1 for the strains used in this study) and the spokeless mutant pf14 to the three CSC amiRNA mutants 4A2, 4D6 (both CaM-IP2 knockdowns), and 6E6 (CaM-IP3 knockdown). Previous studies established that pWT, a rescue of the N-DRC–defective pf2 mutant (Rupp and Porter, 2003), is phenotypically, biochemically, and structurally undistinguishable from WT (Rupp and Porter, 2003; Heuser et al., 2009, 2012; Nicastro et al., 2011; Barber et al., 2012). Previous structural studies included detailed comparisons of major axonemal complexes between WT and pWT, such as the DMTs (Nicastro et al., 2011), the N-DRC (Heuser et al., 2009), the I1 inner dynein complex (Heuser et al., 2012), and the RSs (Barber et al., 2012), and no differences were observed. However, greater details are visible in the averaged axonemal repeat of pWT due to its slightly better resolution of 3.2–3.6 nm (Heuser et al., 2009; Nicastro et al., 2011; Barber et al., 2012).
TABLE 1:
Strains used in this study.
| Name | Strain | Swim speed | Reference | Number of tomograms | Averaged repeats |
|---|---|---|---|---|---|
| WT | A54-e18 (nit1-1, ac17, sr1, mt+) | Normal | Lefebvrea | — | — |
| pWT | pf2-4::PF2-GFP | Normal | Bowerb | 5 | 720 |
| 4A2 | CaM-IP2 amiRNA | Slightly reduced | Dymek et al. (2011) | 3 | 500 |
| 4D6 | CaM-IP2 amiRNA | Severely reduced | Dymek et al. (2011) | 5 | 800 |
| 6E6 | CaM-IP3 amiRNA | Slightly reduced | Dymek et al. (2011) | 4 | 600 |
| pf14 | CC-1032 mt+ | Paralyzed | Piperno et al. (1981) | 4 | 636 |
| pf28 | CC-1877 mt– | One-half of WT | Mitchell and Rosenbaum (1985) | — | — |
| 6E6pf28 | Severely reduced | This study | — | — |
aFrom Paul A. Lefebvre's laboratory at the University of Minnesota.
bFrom Raqual Bower and Mary E. Porter at the University of Minnesota. This pseudo wild-type strain (pWT) is a mutant rescue that is biochemically, structurally, and phenotypically indistinguishable from WT (Rupp and Porter, 2003; Heuser et al., 2009; Nicastro et al., 2011; Barber et al., 2012). It was generated by transforming the N-DRC mutant pf2 with a green fluorescent protein–tagged PF2 gene from WT (Rupp and Porter, 2003).
Three to five cryotomograms were reconstructed for each CSC amiRNA strain, the pWT, and the pf14 mutant. In contrast to conventional electron microscopy (EM), cryo-ET allows the visualization of lifelike preserved axonemes with molecular resolution. In addition, cryo-ET also provides 3D data, which allows the unambiguous determination of spatial relationships, such as the proximal and distal ends of the tomogram, which is important, for example, for the distinction between RS1 and RS2. Raw cryotomograms of pWT show the characteristic and highly regular spacing of RS1 and RS2 repeating every 96 nm (Figure 3A; Dymek et al., 2011). We previously reported that cryotomograms of all three CSC amiRNA mutants have many axonemal repeats that lack RS2 and occasionally show additional RSs positioned at irregular and variable intervals, whereas no defects of RS1 were found (Figure 3, E, I, and M; Dymek et al., 2011). For comparison, neither RS1 nor RS2 is visible in cryotomograms of the pf14 mutant (Figure 3Q).
FIGURE 3:

Cryotomograms and subtomogram averages show RS defects in the axonemes of CSC amiRNA mutants. (A–R) Longitudinal slices through tomographic reconstructions of intact axonemes (A, E, I, M, Q) and averaged axonemal repeat units (B–D, F–H, J–L, N–P, R) compare the presence and absence of RSs in pWT (A–D), the two CaM-IP2–knockdown mutants 4A2 (E–H) and 4D6 (I–L), the CaM-IP3–knockdown mutant 6E6 (M–P), and the spokeless mutant pf14 (Q, R). The 3D nature of tomographic data allows us to easily determine the proximal (prox) and distal (dist) ends of the axoneme and thus to unambiguously identify RS1 (blue lines) and RS2 (yellow lines). Both spokes display a characteristic and highly regular spacing in pWT (A) and are completely absent in pf14 (Q). All three CSC amiRNA mutants have a regular arrangement of RS1 (blue line) but show many repeats with missing RS2 (orange dots) and occasionally additional, irregularly spaced spokes (green lines). Subtomogram averages of all axonemal repeats show highly similar electron densities for RS1 and RS2 in pWT (B), whereas in all three CSC amiRNA mutants the densities of RS2 are reduced compared with RS1 (F, J, N). Similarly, RS3S is present in pWT (B, magenta arrowhead), but is either reduced in 4A2 and 4D6 (F, J, empty arrowheads) or completely missing in 6E6 (N, open dots). This is in contrast to pf14 averages, in which RS3S is present at WT level (R, magenta arrowhead). A principal component analysis of the RS2 density in the three CSC amiRNA mutants results in two distinct class averages for each strain: in class 1 RS2 is present at a density similar to RS1 (G, K, O), whereas in class 2 RS2 is completely missing (H, L, P). Note that defects in RS2 and RS3S seem to be correlated, that is, in class 1 of the CaM-IP2 mutants, in which RS2 is present, RS3S is only slightly reduced (G, K), whereas in class 2, in which RS2 is missing, RS3S is greatly reduced (H, L). The same classification approach applied to the pWT control does not show significant differences between class averages (C, D). Scale bars, 200 nm (Q, valid also for A, E, I, M) and 20 nm (R, valid also for B–D, F–H, J–L, and N–P).
Due to the radiation sensitivity of ice-embedded biological specimens and the required low-dose imaging, cryotomograms have an intrinsically low signal-to-noise ratio, which limits the resolution and observable details. Subtomogram averaging of structurally identical copies is a powerful technique because it increases the signal-to-noise ratio and thus ultimately the resolution of the cryotomographic data, allowing the visualization of unprecedented details (Nicastro et al., 2006). Therefore in the present study we used subtomogram averaging of 500–800 axonemal repeats of each strain to increase their resolution and visible detail.
Subtomogram averaging of all axonemal repeat units of the three CSC and the pf14 mutants reveals many structural differences, most of which could not be detected in the raw cryotomograms. However, the defect that was clearly visible in the raw tomograms, that is, missing RS2 in many axonemal repeats (Figure 3, E, I, and M; Dymek et al., 2011), is less obvious in the averages of all axonemal repeats (Figure 3, F, J, and N). The axonemal repeats of CSC knockdowns show heterogeneity, in that only 30–60% of them lack RS2 (Supplemental Table S1; Dymek et al., 2011). Therefore the combination of repeats with and without RS2 results in axonemal averages with only reduced electron density of RS2 in comparison to RS1. Questions about precisely which parts of the RS2 structure are missing and with what penetrance remain unanswered by the averages of all axonemal repeats. Despite the limitations posed by structural heterogeneity, the subtomogram averages revealed previously undetected defects in four other axonemal complexes of all CSC mutants in addition to the RS2 defects: RS3S, IAs, N-DRC, and the B-tubule (see subsequent discussion and summary in Table 2).
TABLE 2:
Summary of observed structural defects.
| Knockdown/strain | |||||
|---|---|---|---|---|---|
| CaM-IP2a | CaM-IP3b | ||||
| Structure | pWT | 4A2 | 4D6 | 6E6 | pf14 |
| RS1 | + | + | + | + | – |
| RS2 | + | +/– | +/– | +/– | – |
| RS2 back prong knob | + | +/– | +/– | – | –/? |
| Additional/irregular spokes | – | + | + | + | – |
| RS3S | + | +/– | +/– | – | + |
| IA4 | + | +/– | +/– | +/– | + |
| N-DRC fork | + | +/– | +/– | +/– | + |
| N-DRC-RS2 connection | + | – | – | – | –/? |
| MT hole | + | – | – | – | + |
| Secondary effects unrelated to CSC defectsc | |||||
| N-DRC | + | + | – | + | + |
| Digitus | + | – | + | + | + |
+, structure present; +/–, structure reduced—present in some repeats and missing in others; –, structure missing; ?, unclear.
aKnockdown of CaM-IP2 results in a small decrease in CaM-IP3 abundance.
bKnockdown of CaM-IP3 also completely depletes CaM-IP2 from the axonemes.
cMost likely caused by random insertion of the amiRNA plasmid into the genome.
Defects in RS3S assembly
The recently described homologue of the third RS, RS3S (Pigino et al., 2011; Barber et al., 2012; Lin et al., 2012), is much shorter than a regular RS and is hardly detectable in noisy raw tomograms, but it is clearly visible in subtomogram averages (Figures 3 and 4). Corroborating recent results from Pigino et al. (2011), we found that RS3S is present not only in axonemes of pWT (Figures 3B and 4B), but also in the “spokeless” pf14 mutant (Figures 3R and 4J) that was previously believed to be lacking all RS structures. In contrast, the subtomogram averages of CSC amiRNA mutants show various degrees of reduction in the RS3S structure; both CaM-IP2 knockdowns (4A2 and 4D6) show a decrease in the RS3S density, but in 4A2 (Figures 3F and 4D) the reduction is more pronounced than in 4D6 (Figures 3J and 4F). The CaM-IP3 knockdown 6E6, which lacks both CaM-IP2 and CaM-IP3, has the strongest structural defects and lacks the RS3S structure entirely (Figures 3N and 4H).
FIGURE 4:
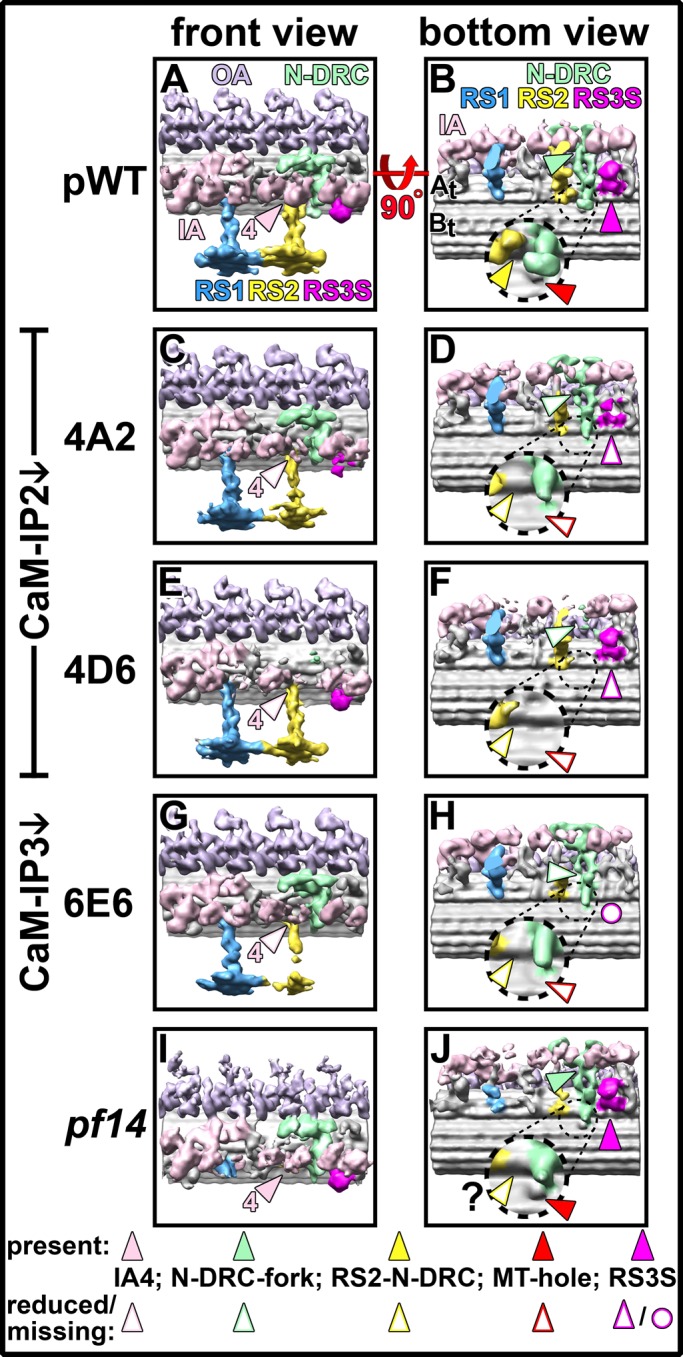
3D structure comparison of averaged axonemal repeats from pWT, CSC amiRNA, and spokeless mutants. (A–J) Isosurface renderings from pWT (A, B), the CaM-IP2–knockdown mutants 4A2 (C, D) and 4D6 (E, F), the CaM-IP3–knockdown strain 6E6 (G, H), and the spokeless mutant pf14 (I, J) show the 3D structure of averaged axonemal repeats viewed from the front (A, C, E, G, I) and the bottom (B, D, F, H, J). In addition to the density reduction in RS2, several other defects are visible in all amiRNA mutants. Whereas in pWT and pf14 the inner arm dynein 4 (IA4, rose arrowheads in A, I) connects to a part of the N-DRC named fork (green arrowheads in B, J), both structures are reduced or missing in all three CSC mutants (open rose and green arrowheads in C–H). In pWT, RS2 has a small connection to the N-DRC baseplate (yellow arrowhead in B; dashed frame shows close-up) in close proximity to a hole (red arrowhead) in the inner junction between the A- and B-tubules (At, Bt). Neither the hole nor the RS2-to–N-DRC connection is observed in any of the CSC mutants (open red and yellow arrowheads in D, F, H). Although the inner junction hole is clearly observed in pf14, the RS2-to–N-DRC connection is not clearly visible (J). Finally, RS3S is present in pWT and pf14 (magenta arrowheads in B and J) but reduced in the CaM-IP2 strains 4A2 and 4D6 (open magenta arrowheads in D and F) and completely missing in the CaM-IP3 mutant 6E6 (open magenta circle in H).
Inner dynein arm defects
The dynein arm IA4 (dynein e) is greatly reduced in all CSC mutants, whereas in pWT and pf14 all IAs are present (compare rose-colored arrowheads in Figure 4, C, E, and G, to A and I). In all amiRNA mutants the IA2 and IA6 (dyneins a/d) densities also seem slightly reduced, but to a smaller degree than IA4 (Figure 4). As previously reported, IAX (dynein b/g) is reduced in the subtomogram averages of all strains, including pWT, because it is the only IA that is present only on a subset of the nine DMTs (Bui et al., 2009; Nicastro, 2009).
As an additional approach to detect and characterize the loss of specific IA subforms in our CSC amiRNA mutants, we generated a double-mutant strain that virtually completely lacks the CSC (6E6) and fails to assemble the OAs (pf28). In this 6E6pf28 double-mutant strain we extracted the IAs and fractioned the resulting axonemal extract using ion exchange chromatography based on the methods of Kagami and Kamiya (1995). The peak dynein fractions were analyzed by SDS–PAGE and subsequent densitometry. As shown in Supplemental Figure S2, fractions a, d, and e show a nearly 50% reduction compared with WT axonemes (Kagami and Kamiya, 1992; King and Kamiya, 2009). These biochemical findings agree with our structural data, as the heavy-chain peak of dynein e corresponds to the IA4 structure, and dynein a/d to IA2/6 in the axonemal repeat (Supplemental Figure S2; Bui et al., 2009; Nicastro et al., 2006; Nicastro, 2009). However, the structural defects in IA2/6 are not as strong as might be expected from the peak fraction reduction of dynein a/d.
Defects in N-DRC components
A small part of the N-DRC in a region named the fork that is connected to the tail of IA4 (Heuser et al., 2009) is also reduced in all CSC mutants (see empty green arrowheads in Figure 4, D, F, and H) but is present in pWT and unchanged in pf14 (see solid green arrowheads in Figure 4, B and J). A second region of the N-DRC defective in the CSC mutants is the thin connection between the N-DRC baseplate and the base of RS2 (Barber et al., 2012; connection 8 in Heuser et al., 2009). This connection is present only in pWT (solid yellow arrowhead in Figure 4 B) and is completely missing in all three CSC amiRNA mutants and seems also greatly reduced in pf14 (open yellow arrowheads in Figure 4, D, F, H, and J).
B-tubule defects
In an earlier study, we found a small hole that penetrates the wall of the DMTs at the inner junction of the B-tubule to the A-tubule; this small hole in the B-tubule inner junction is located between the connection of the N-DRC to the B-tubule and the RS2 base (Heuser et al., 2009; Nicastro et al., 2011). The only mutants reported to lack this DMT hole are drc mutants that lack the N-DRC baseplate domain, which in WT connects to the B-tubule (Heuser et al., 2009; Nicastro et al., 2011). Here we show that this DMT hole is present in pWT and pf14 (solid red arrowhead in Figure 4, B and J) but is absent in all three CSC mutants, although the N-DRC baseplate is present in two of the three CSC mutants (open red arrowheads in Figure 4, D, F, and H).
Additional defects unique to specific strains
The structural defects described in the foregoing were present in all CSC knockdowns, although with various degrees of severity. In addition to these primary defects, we found in each CaM-IP2 knockdown strain one additional structural difference that was not observed in any of the other mutants. 4A2 is missing an uncharacterized density of unknown protein composition—here named digitus for its finger-like shape (Supplemental Figure S1C)—which is usually located between the OA and IA row distal to the N-DRC. 4D6 is lacking almost the entire N-DRC (Supplemental Figure S1D). The fact that these two defects are seen only in individual CSC mutant strains and do not occur consistently in both isolates of the same target gene knockdown indicates that these structural defects are likely caused by the random insertion of the amiRNA construct into the Chlamydomonas genome and that the defects are thus unrelated to reduced expression of the CSC (see also Discussion).
Structural classification shows differences in RS2 and RS3S between CaM-IP2 and CaM-IP3 knockdowns
The subtomogram averages of all axonemal repeats of the CSC mutants reveal important structural differences in comparison to the axonemes of pWT and the RS mutant pf14. However, all CSC amiRNA strains show structural heterogeneity; for example, RS2 is present in some axonemal repeats and missing in others, which is a well-known limitation of averaging techniques in general. The Boulder lab for 3D EM recently implemented a newly developed, improved classification method (Heumann et al., 2011) in the subtomogram averaging software PEET (Particle Estimation for Electron Tomography; Nicastro et al., 2006). To our knowledge, we present the first application of this subtomogram classification method to cellular cryotomograms for detecting biologically meaningful differences.
Using an automated principal component analysis and clustering algorithm (Heumann et al., 2011), the axonemal repeats from each CSC amiRNA mutant were assigned to one of two major classes for each CSC mutant: one class consists of repeats with RS2 and one with repeats that lack RS2 (Figures 3–5 and Supplemental Figure S3). This result is not surprising because the presence or absence of RS2 was also visually the most prominent structural difference in the cryotomograms. However, it confirms that this automated, unsupervised classification approach is capable of separating true structural differences in a missing-wedge-insensitive manner. Supplemental Table S1 summarizes the details of the classification, including how many repeats were present in each class average.
FIGURE 5:

Structural differences of RS2 between pWT, CSC amiRNA, and spokeless mutants. (A–R) Tomographic slices (A, B, E, F, I, J, M, N, Q) and isosurface renderings (C, D, G, H, K, L, O, P, R) show cross-sectional views from the proximal end of either two axonemal class averages for pWT control (A–D) and the three CSC amiRNA mutants 4A2 (E–H), 4D6 (I–L), and 6E6 (M–P) or of an average of all axonemal repeats from the spokeless mutant pf14 (Q, R). The two class averages show clear differences in all three CSC mutant strains: RS2 is present in class 1 (E, G, I, K, M, O) but absent in class 2 (F, H, J, L, N, P). The same classification approach run as a control on pWT axonemes resulted in two similar classes without detectable RS defects (A–D). RS2 has two MT attachment sites: a front prong, to which dynein IA3 connects, and a back prong (yellow arrow). The back prong is present in pWT (A–D) and in class 1 of 4A2 and 4D6 (yellow arrows in E, G, I, K). In class 1 of 6E6 the back prong is still partially present, but a characteristic knob is reduced (open yellow arrows in M, O). The back prong is completely missing in class 2 of all CSC mutants (open yellow arrows in F, H, J, L, N, P). In contrast, the RS2 front prong and the attached IA3 are present in all strains, including the class 2 averages of all CSC mutants and the axonemal average of the spokeless mutant pf14 (Q, R). However, the RS2 back prong is not clearly visible in the current average of pf14. Scale bar, 20 nm (Q, valid also for A, B, E, F, I, J, M, and N).
Overall, the class averages of axonemal repeats with RS2 present (class 1) show highly similar 3D structures among all three CSC amiRNA strains. However, a small difference between the two CaM-IP2–knockdown mutants (4A2, 4D6) on one hand and the CaM-IP3 knockdown 6E6 on the other hand is noticeable: both CaM-IP2 knockdowns have a knob-shaped density attached to the back prong of the RS2 base that is similar in size to the pWT structure (compare Figure 5, A and C, with E, G, I, and K). In contrast, this density is clearly reduced in the CaM-IP3 knockdown, 6E6 (compare Figure 5, M and O, with A, C, E, G, I, and K). This result, together with the earlier-described finding that RS3S is reduced only in CaM-IP2 amiRNA strains but almost entirely missing in the CaM-IP3 amiRNA strain, suggests that the CaM-IP3 knockdown causes more severe structural defects. This result is also consistent with the previous observation that 6E6 is missing almost the entire CSC, whereas in the CaM-IP2 amiRNA strains only CaM-IP2 is greatly reduced and CaM-IP3 is still present (Dymek et al., 2011).
For all three CSC amiRNA mutants the class averages of repeats lacking RS2 (class 2) show that almost the entire ∼3.4-MDa density of RS2—that is, spoke head, stem, and parts of the base—is missing (Figures 3–5 and Supplemental Figure S3). Only a small part of the RS2 base is still attached to the DMT (Figures 3, H, L, and P, and 5, F, H, J, L, N, and P). In WT, RS2 has two attachment sites to the DMT, called the front and back prongs (Barber et al., 2012). IA3, which connects directly to the front prong of RS2 through its dynein tail (Barber et al., 2012), is present in all analyzed strains (Figures 4 and 5), corroborating that parts of the RS2 base, including the front prong, assemble in the CSC and pf14 mutants. This small remaining RS2 base part seems slightly larger in 4A2 compared with 4D6 and 6E6 (compare Figures 3H, and 5, F and H, to Figures 3, L and P, and 5, J, L, N, and P), and resembles the density present in pf14 (Figures 3R, 4J, and 5, Q and R; Pigino et al., 2011).
One of the most interesting insights that the class averages provide is that the severity of defects in RS2 and RS3S seems to correlate in both CaM-IP2 knockdowns: the class 1 averages (RS2 present) of 4A2 and 4D6 both show only a small reduction in the RS3S structure when RS2 is present (Figure 3, G and K, and Supplemental Figure S3, C and G). In contrast, the class 2 averages (RS2 absent) of both strains show a severe RS3S reduction when RS2 is missing (Figure 3, H and L, and Supplemental Figure S3, D and H), suggesting that the assembly of RS2 and RS3S into the axoneme is not mutually independent, but the presence or absence of RS2 also influences the attachment of RS3S to the microtubule.
All other previously described structural defects, namely reductions in IA4 and the N-DRC fork, the missing RS2-to–N-DRC connection, and the absence of the DMT hole, were observed in both class averages of all three CSC amiRNA strains but often seem more pronounced in the class 2 averages that lack RS2 (Figures 3–5 and Supplemental Figure S3).
DISCUSSION
Cryo-ET has provided us with unprecedented insights into the 3D structure of the CSC close to its native state without fixation or staining artifacts. Using a newly implemented unsupervised classification method, we overcame limitations of data heterogeneity that hindered our analysis in the past, allowing us to present the first defined 3D localization model of the CSC. The results provide not only new evidence for heterogeneity among the spokes, but also new insights into how RSs are assembled and attached to the DMT. In addition, our results raise the interesting possibility that each spoke makes a unique contribution to regulating microtubule sliding.
The CSC includes two RSPs
On the basis of the following four observations, CaM-IP2 and CaM-IP3 most likely correspond to RSP18 and RSP19, respectively (Figure 2A). First, coimmunoprecipitates using the CaM-IP2 antibody, which include only the CSC and RS proteins, appear identical to the 20S fraction of WT KI axonemal extracts of nearly purified RSs. Second, CaM-IP2 and CaM-IP3 have the same apparent molecular weights and isoelectric points as RSP18 and RSP19, respectively. Third, in pf14 extracts, the CSC is not present in the 20S fraction, which was used to identify spoke components (Yang et al., 2001, 2006; Dymek and Smith, 2007). Instead, the CSC sediments at 11S when RS1 and RS2 fail to assemble into the axoneme. Finally, all other identifiable RSPs are present in our strains lacking the CSC except the polypeptides of the same molecular weights as RSP18 and RSP19. The fact that RSP18 and RSP19 in 20S sucrose gradient fractions prepared from WT axonemes and resolved by 2D gels are lower in abundance than other known RSPs (Yang et al., 2001, 2006) is also consistent with our finding that the CSC associates with only a subset of spokes (RS2 and RS3S, but not RS1).
The CSC was most likely not identified as a component of the spokes in earlier work by Huang et al. (1981) and Piperno et al. (1977, 1981) because the CSC is present in pf14 axonemes. Their designation of spoke proteins was based on comparison of 2D gels of whole axonemes isolated from WT and spokeless mutants. In contrast, in later studies additional RSPs were identified based on comparisons of only the 20S fraction of isolated spokes from WT and pf14 axonemes (Yang et al., 2001, 2006). However, we demonstrated that the CSC sediments at 11S when isolated from pf14 axonemes (Dymek and Smith, 2007).
The amino acid identities of RSP18 and RSP19 were not unambiguously determined in previous studies. Using mass spectrometry, Yang et al. (2006) obtained only one peptide hit for RSP18, which has some similarity to an uncharacterized protein sequence predicted from the Chlamydomonas genome v2. However, this predicted protein sequence does not match the protein sequence we identified in our mass spectrometry analysis of CaM-IP2 (FAP91; Dymek and Smith, 2007). For RSP19, mass spectrometry results from Yang et al. (2006) showed six peptide hits that corresponded to tubulin. Given the apparent molecular weight of RSP19 of 140 kDa, the tubulin (∼50 kDa) associated with these samples most likely represents a contaminant. We suspect that the difficulty in obtaining reliable mass spectrometry data for RSP18 and RSP19 could be due to the fact that these spoke components are of lower abundance relative to other spoke proteins. Because antibodies were not generated against the protein spots identified as RSP18 and RSP19, we cannot directly test whether CaM-IP2 and CaM-IP3 are RSP18 and RSP19, respectively. However, our data provide compelling support for the hypothesis that CaM-IP2 and CaM-IP3 are RSP18 and RSP19, respectively. This finding raises the interesting possibility that some RSPs may form a unique adaptor for binding specific RSs to the axoneme.
CaM-IP4 does not correspond to any of the 23 polypeptides designated as RSPs. A protein of the same size as CaM-IP4 is present in both the 20S fraction and CaM-IP2 immunoprecipitates. Whether this protein corresponds to a particular spot on the 2D gels of Yang et al. (2001) is not certain. However, one spot has a similar apparent molecular weight and isoelectric point. This protein is labeled as a proteolytic product of RSP2 in Figure 2 of Yang et al. (2001). Because CaM-IP4 is nonantigenic, we were unable to generate antibodies against this protein and therefore cannot directly test whether this spot is in fact CaM-IP4.
Knockdown of either CaM-IP2 or CaM-IP3 expression causes defects in the same axonemal structures
All three CSC amiRNA mutants show similar structural defects (see summary in Table 2), but the extent of the defects differs between the CaM-IP2– and CaM-IP3–knockdown strains. All mutants have many axonemal repeats that lack RS2 and RS3S. A few repeats also have an additional radial spoke located at an irregular position—that is, different from the regular location of RS1, RS2, or RS3S—that varies among repeats. The very low abundance and variable position of the additional spokes prevent further analysis by averaging, and it is unknown whether these spokes resemble RS1, RS2, a mix of both, or a different structure. Repeats missing RS2 seem to occur in clusters on the DMTs—that is, these defective repeats are not evenly distributed throughout the axoneme—but appear concentrated in groups along the DMT (Figure 3, E, I, and M). The underlying mechanism of this clustering is unknown, but it does not seem to be doublet specific or to extend to adjacent DMTs. Of interest, no defects in RS1 were found, suggesting that RS1 and RS2 are anchored to the DMT by two independent mechanisms (Dymek et al., 2011).
Previous results hinted at a relationship between the CSC and the N-DRC. In drc mutants pf2 and pf3, anti-CaM antibodies fail to coprecipitate CSC components, yet CSC components are present in these mutants based on Western blots of isolated axonemes, as well as anti-CaM-IP2 coimmunoprecipitation. Evidently, in these drc mutants the association between CaM and the CSC is disrupted (Dymek and Smith, 2007).
The data we report here provide further evidence suggesting a connection between the CSC and the N-DRC. Knockdowns of CaM-IP2 or CaM-IP3 both show reduced electron densities for a part of the N-DRC fork and IA4 (dynein e; Figure 4, C–H). The affected region of the N-DRC fork is precisely at the position where the IA4 tail connects to the N-DRC (Heuser et al., 2009). A defect in this N-DRC part would therefore weaken or completely disrupt the connection between IA4 and the N-DRC, causing destabilization and loss of IA4 in many axonemal repeats. This reduction of IA4 density in the axonemal averages agrees well with the observed reduction in the dynein e peak in the ion exchange chromatograph of 6E6pf28 axonemes (Supplemental Figure S2). The ion exchange chromatogram also shows reductions in the dynein a and d isoforms (Supplemental Figure S2), known to form IA2 and IA6. Because there are no mutants available that specifically lack either IA2 or IA6, it is still ambiguous which of these dynein heavy chains corresponds to the IA2 and IA6 structures. Both densities—IA2 and IA6—show defects in our subtomographic averages (Figure 4), but these defects are smaller than one would expect from the ion exchange chromatogram. This could be due to the mentioned ambiguity (which dyneins form the IA2 and IA6 structure), or alternatively it is possible that minor dynein species (Yagi et al., 2009) occupy the position of IA2/IA6 in certain regions and/or in the absence of dynein a/d, so that the structural defect would appear less severe.
Two more findings suggest interactions between the CSC and the N-DRC. The connection of RS2 to the N-DRC (Heuser et al., 2009) is missing in all three CSC amiRNA strains (Figure 4, D, F, and H). In addition, a small DMT wall–penetrating hole is usually found in close proximity of this RS2-to–N-DRC connection (Figure 4B) but is not observed in any of the CSC amiRNA strains (Figure 4, D, F, and H). How and why this hole appears in the microtubule lattice is a complete mystery, but it was previously observed that those drc mutants that lack the N-DRC baseplate also do not form this hole in their B-tubule (Heuser et al., 2009; Nicastro et al., 2011). In CSC mutants 4A2 and 6E6, however, the hole fails to form even though the N-DRC baseplate assembles. At our present resolution we do not detect any structural differences on the inside of the B-tubule surrounding the usual hole area in strains with or without the hole, but it is possible that the CSC and/or the N-DRC could contact structures inside the B-tubule through this hole, such as the MT inner proteins MIP3a and b (Nicastro et al., 2011).
All defects discussed so far appear to be similarly pronounced in CaM-IP2 and CaM-IP3 knockdowns. This is not the case for the RS3S structure. Both CaM-IP2 mutants 4A2 and 4D6 show a reduction in RS3S, but some RS3S clearly remains in their axonemes (Figures 3, F–L, and 4, C–F). In the CaM-IP3–knockdown strain 6E6, however, RS3S is completely missing (Figures 3, N–P, and 4, G and H). The same is true for a knob-shaped density at the back prong of RS2, which is missing in both class averages of 6E6 (Figure 5, M–P) but is still present in the class 1 averages (with RS2) of both CaM-IP2 knockdowns (Figure 5, E, G, I, and K). These observations are consistent with our previously published biochemical results that 6E6 is the strongest knockdown with the lowest levels of remaining CaM-IP2, CaM-IP3, and CaM-IP4 protein (Dymek et al., 2011). Our structural results also suggest that the back prong of the RS2 base, the RS2-to–N-DRC connection, and RS3S are the most likely locations for CSC components.
Classification shows that the defects in RS2 and RS3S are correlated
RS2 is present in approximately half of all axonemal repeats in 4A2, 4D6, and 6E6 (Supplemental Table S1). Using a classification method recently incorporated into the averaging software program PEET by Heumann et al. (2011), we separated heterogeneous axonemal repeats into more homogeneous classes, which was an important step for preserving biologically meaningful differences during the averaging process. Several details that are key for the interpretation of the CSC location are visible only in the class averages, such as the reduced RS2 back prong knob in class 1 of 6E6 or the correlation of defect severity between RS2 and RS3S in the CaM-IP2 mutants, that is, defects in RS3S are much stronger in averages of class 2 (without RS2) than of class 1 (with RS2). This correlation suggests that both structures, RS2 and RS3S, could be physically connected to each other, likely through the CSC.
The results obtained using the automated classification approach for the CaM-IP3 knockdown 6E6 were similar to that previously obtained by manually separating the axonemal repeats of 6E6 based on presence or absence of RS2 (Dymek et al., 2011). However, the manual approach was extremely time-consuming, making it unfeasible for comparison of multiple strains. In addition, using the manual separation approach, we discarded about one-fourth of the repeats as ambiguous; it was prone to user bias and could be applied only to features clearly visible in the noisy cryotomograms.
As an additional control, we also applied the automated classification procedure to the axonemal repeats from the pWT strain, resulting in highly similar class averages that both had RS2 (Figures 3, C and D, and 5, A–D).
Isolated structural defects found only in single strains are likely secondary defects caused by random amiRNA construct integration into axonemal genes
4A2 and 4D6 are two independent knockdown strains of the same target, CaM-IP2. Although most of the observed structural defects were consistently detected in both CaM-IP2– and the CaM-IP3–knockdown strains—for example, defects in RS2, RS3S, N-DRC, and IA4—we also identified two structural defects that appeared in only one mutant each. Compared to the pWT structure, 4A2 is missing the uncharacterized digitus density distal to the N-DRC, and 4D6 is missing almost the entire N-DRC (Supplemental Figure S1). It is unlikely that knocking down the same gene causes these striking differences between the two isolates. A more parsimonious explanation is that these defects are caused by random integration of the amiRNA construct into the Chlamydomonas genome (Molnar et al., 2009; Zhao et al., 2009; DiPetrillo and Smith, 2010) and thus that they are unrelated to the CSC. It is possible that our screen for transformants with motility defects increased the probability for identifying strains with additional defects in structures required for WT motility. We previously reported that strain 4D6 may have more than a single copy of the vector sequence integrated into the genome (Dymek et al., 2011); however genetic analysis of this strain indicates that they are tightly linked, presumably integrated into the same location. Because the genes that correspond to these missing structures may be disrupted in these amiRNA strains, in future studies we will be able to use the integrated amiRNA construct to ultimately identify the genes responsible for these additional structural defects.
CSC localization model
Figure 6 summarizes our findings and presents the first structure-based, 3D localization model of the CSC. On the basis of the results described in this study, we propose that components of the CSC are located at the back prong of RS2, the RS2-to–N-DRC connection, and RS3S. We also propose that the CSC interacts with the N-DRC baseplate and physically connects the base of RS2 and the base of RS3S. In all CSC amiRNA mutants we observed defects in the N-DRC, that is, reduction of the RS2-to–N-DRC connection, the N-DRC fork, and associated IA4, indicating that these two regions of the N-DRC might be interacting with the CSC. At the present resolution, we are not able to resolve the exact location where the CSC passes by or through the N-DRC baseplate. However, the connection is likely small, because a comparison of the pf3 mutant that lacks the N-DRC baseplate but not the CSC with the 4D6 strain that lacks both did not identify detectable differences in the region of the N-DRC baseplate. Our localization model of CSC components differs from a previous hypothesis that placed the CSC at the front prong of RS2 (Pigino et al., 2011). However, this proposed localization was based on results using biochemical approaches (Dymek and Smith, 2007; Dymek et al., 2011) and not on direct structural evidence provided by the analysis of CSC-knockdown mutants, making it speculative.
FIGURE 6:
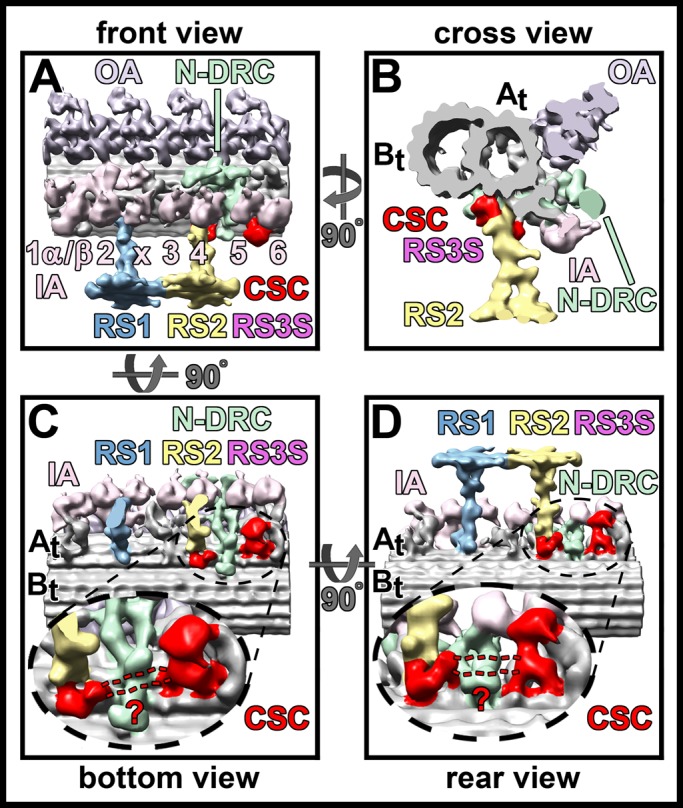
CSC localization model. (A–D) Isosurface rendering representations of the 3D structure of the averaged axonemal repeat from Chlamydomonas pWT viewed from the front (A), the proximal cross-sectional side (B), the bottom (C), and the rear (D). The suggested location of the CSC is colored in red. Note that the RS3S label is shown in its magenta color as in the preceding figures. The CSC consists of two parts: the RS2 back prong with the RS2-to–N-DRC connection, and RS3S, a shorter homologue of the third RS at the same position where organisms with RS triplets would have a full-length third RS. On the basis of the biochemical data supporting that the CSC components form one complex and the structural observation that defects in RS2 and RS3S are highly correlated, we hypothesize that both parts—the RS2 base and RS3S—are connected (dashed red lines). However, the precise location of this connecting density could not be resolved.
Although our structural analysis of the CSC mutants does not provide definitive sublocalization of individual CSC components, the observation that CaM-IP2 has been shown to directly interact with RSP3 could place CaM-IP2 at the RS2 back prong and/or the RS2-to–N-DRC connection. Similarly, since CaM-IP3 knockdown completely eradicates the assembly of RS3S, CaM-IP3 may be located at or near RS3S.
Recent comparisons of spoke structures between Chlamydomonas (Barber et al., 2012) and two species with RS triplets, Tetrahymena (Pigino et al., 2011) and Strongylocentrotus (sea urchin; Lin et al., 2012), showed similar morphologies for RS2 and for the base of RS3/RS3S and described connections from the N-DRC to both RS2 and RS3/RS3S, suggesting that the CSC, including its interactions, could be conserved among species.
New views of the RSs
Until only recently all RSs were assumed to be structurally identical in organisms with RS pairs and triplets. Our recent biochemical and structural studies (Dymek et al., 2011; Barber et al., 2012; Lin et al., 2012), as well as a structural study from Pigino et al. (2011), are changing this view, painting a strikingly different picture of the RSs. The spokeless mutant pf14 was historically used to define the RS structure and components (Piperno et al., 1977, 1981; Huang et al., 1981, 1982). To date the pf14 mutant has the most severe RS defects as defined by both structural and biochemical studies. However, it is important to note that our structural analyses demonstrate that parts of the RS bases and the entire RS3S still assemble into pf14 axonemes (Figures 3R, 4, I and J, and 5, Q and R), and we now know that RSP18 (CaM-IP2) and RSP19 (CaM-IP3) are also still present. The CSC components are likely MT-adaptor proteins that are crucial for docking and/or stabilizing RS2 and RS3S to the DMT. Our future studies will aim at identifying an RS1-specific adaptor protein or complex. Twenty-three RSPs have been characterized (Piperno et al., 1977, 1981; Huang et al., 1981; Yang et al., 2001, 2006; Yang and Smith, 2009); it will be exciting to see whether any of these proteins is the putative RS1 adaptor or if there are additional spoke-associated proteins to be identified. The presence of a calcium-sensing complex localized to the base of only one of the two full-length RSs in Chlamydomonas not only introduces another example of structural heterogeneity between spokes, it also provides a first glimpse that the ability to sense calcium might be a functional difference between both spokes, suggesting different roles for the RSs in the regulation of flagellar motility.
MATERIALS AND METHODS
C. reinhardtii strains
Strains used in this study are summarized in Table 1. The WT strain, A54-e18 (nit1-1, ac17, sr1, mt+), was obtained from P. Lefebvre (University of Minnesota, Minneapolis, MN). All amiRNA strains were made by transforming WT cells with CSC amiRNA constructs targeting CaM-IP2 (4A2 and 4D6) or CaM-IP3 (6E6) (Dymek et al., 2011). The spokeless strain, pf14, and the outer dynein armless strain, pf28, were obtained from the Chlamydomonas Resource Center (University of Minnesota). For the 6E6pf28 strain, 6E6 (mt+) was mated with pf28 (mt–). Flagella were isolated from tetrads, and Western blots were performed to confirm that mutants lacked both the CSC and the OAs. Anti–CaM-IP3 antibodies were used as a CSC marker, and anti-IC69 antibodies (generously provided by G. Witman, University of Massachusetts Medical School, Worcester, MA) were used as an OA marker to confirm absence of OAs in the 6E6pf28 strain. All cells were grown in constant light in TAP (Tris acetate posphate) media (Gorman and Levine, 1965).
Axonemal extracts, sucrose gradients, and immunoprecipitation
The pH shock method was used to separate pWT flagella from cell bodies (Witman et al., 1972). Flagella from all other strains were severed from cell bodies using the dibucaine method (Witman, 1986), separated from cell bodies using differential centrifugation, and resuspended in NaLow (10 mM 4-(2-hydroxyethyl)-1-piperazineethanesulfonic acid [HEPES], pH 7.5, 5 mM MgSO4, 1 mM dithiothreitol [DTT], 0.5 mM EDTA, 30 mM NaCl, with 1 mM phenylmethylsulfonyl fluoride) and 0.0175 trypsin inhibitor unit/ml aprotinin). NP-40 (Calbiochem, La Jolla, CA) was added to remove flagellar membranes (0.5% vol/vol final concentration). The resulting axonemes were pelleted at 12,000 × g for 10 min. For the preparation of cryosamples, axonemes were resuspended in 10 mM HEPES, pH 7.4, 25 mM NaCl, 4 mM MgSO4, 1 mM ethylene glycol tetraacetic acid, and 0.1 mM EDTA and processed within 24 h. For biochemical analyses, axonemes were resuspended at 6 mg/ml in NaHigh (NaLow with 0.6 M NaCl) and extracted on ice for 20 min. Axonemes were pelleted, resuspended again in NaHigh, and immediately pelleted. NaCl-extracted axonemes were resuspended at 12 mg/ml in KI (NaLow with 0.5 M KI) and extracted for 30 min on ice. After centrifugation, the KI extract was dialyzed into NaLow for 1 h and centrifuged at 12,000 × g for 5 min for clarification. For sucrose gradients, 1 mg of KI extract was loaded on a 5–20% sucrose gradient (in NaLow) and ultracentrifuged for 16 h at 35,000 rpm at 4°C (SW41Ti rotor; Beckman Coulter, Brea, CA). Twenty-four 0.5-ml fractions were collected from the bottom of the tube and prepared for SDS–PAGE.
For immunoprecipitation experiments, 200 μg of KI extract was incubated with 50 μl of protein A beads, 70 μg of affinity-purified CaM-IP2 antibody, and 300 μl of TBST150 (150 mM NaCl, 50 mM Tris-HCl, pH 7.4, 0.5 mM EDTA, 0.1% Tween) for 2 h at 4°C. Beads were washed 4 × 5 min with TBST150 and resuspended in 60 μl of TBST150. All samples were prepared for SDS–PAGE.
Silver stain analysis and Western blotting
Silver-stained gels were performed according to Dymek et al. (2011). For Western blot analysis, 30 μl of sample was resolved using 7% polyacrylamide gels and transferred to polyvinylidene difluoride membranes. Membranes were blocked for 1 h in 5% milk/TBST (0.1% Tween) and then incubated with primary antibodies diluted in TBST for 2 h at room temperature. The following dilutions were used: anti–CaM-IP2 affinity-purified antibody, 1:500; anti–CaM-IP3 affinity-purified antibody, 1:1000; anti-RSP1 (generous gift from R. Kamiya, University of Tokyo, Tokyo, Japan), 1:40,000; anti-RSP3 (generous gift from W. Sale, Emory University, Atlanta, GA), 1:3000; and anti-RSP11 (generous gift from P. Yang, Marquette University, Milwaukee, WI), 1:20,000. After washing the membrane 2 × 5 min, we incubated the membrane with secondary antibody (anti-rabbit horseradish peroxidase [GE Healthcare, Piscataway, NJ], 1:30,000 in TBST) for 30 min at room temperature. The ECL Plus Western Blotting Kit (GE Healthcare) was used for detection according to the manufacturer's protocol.
Analysis of dynein isoforms by fast-performance liquid chromatography
To identify dynein arm isoforms, we fractionated axonemal extracts using the methods of Kagami and Kamiya (1995). Flagella from 6E6pf28 and pf28 were isolated, demembranated, and extracted at 6 mg/ml in 0.6 M KCl-HMDEd (10 mM HEPES pH 7.5, 5 mM MgSO4, 1 mM DTT, 0.5 mM EDTA) for 30 min on ice. After centrifugation, the KCl extract was diluted into 60 mM KCl-HMDEd to a 10-ml final volume. The diluted extract was filtered using a syringe and a 0.2-μm filter and loaded onto a MonoQ column (5/50 GL; GE Healthcare) attached to an AKTA fast-performance liquid chromatograph (GE Healthcare). A linear gradient of 0.2–0.5 M KCl-HMDEd was applied to the column at a flow rate of 0.5 ml/min for 100 min. We collected 0.5-ml fractions and prepared them for SDS–PAGE. Fractions were resolved on 3–5% polyacrylamide gels and silver stained. For densitometry, protein bands were analyzed using ImageJ (National Institutes of Health, Bethesda, MD). Results from three separate experiments were averaged. After analysis in ImageJ, 6E6pf28 measurements were normalized to pf28 measurements.
Cryosample preparation and cryo-ET
Copper Quantifoil holey carbon grids with a carbon support film (200 mesh, 2-μm hole size; Quantifoil Micro Tools, Jena, Germany) were glow discharged for 30 s at −40 mA and coated with 10-nm colloidal gold particles (Sigma-Aldrich, St. Louis, MO) for use as fiducial markers in the subsequent tomogram reconstruction. Grids were mounted in tweezers and inserted in a self-made plunge freezer. A 3-μl axoneme sample was added to the grid and mixed with 1 μl of 10-fold-concentrated 10-nm colloidal gold. After blotting of the grid front side with a filter paper for 2 s, grids were immediately plunge frozen in liquid ethane at approximately −180ºC to achieve sample vitrification. Grids were kept below the devitrification temperature at approximately −160ºC at all times and were stored in liquid nitrogen until examined by EM.
Cryosamples were analyzed in a transmission electron microscope (Tecnai F30; FEI, Hillsboro, OR) after being transferred in a cryoholder (Gatan, Pleasanton, CA). The microscope was operated at 300 keV under low-dose conditions using SerialEM software (Mastronarde, 2005). Tilt series were acquired by stepwise rotating the cryosamples from −65 to +65° in 1.5– 2.5° angular increments. The accumulative electron dose was restricted to ∼100 e/Å2 to avoid radiation damage. Specimens were imaged with −6- or −8-μm defocus using an energy filter (Gatan) operated in zero-loss mode with a slit width of 20 eV. All micrographs were digitally recorded at a magnification of 13,500 with a 2k × 2k charge-coupled device camera (Gatan), resulting in a pixel size of approximately 1 nm.
The IMOD software package (Kremer et al., 1996) was used to reconstruct the recorded tilt series into cryo–electron tomograms using the fiducial marker alignment and weighted backprojection options. Data analysis was restricted to undistorted tomograms, and three to five tomograms of each strain were analyzed. More details about the preparation of cryosamples and cryo-ET were published earlier (Nicastro, 2009).
Subtomogram averaging and classification
The software program PEET (Nicastro et al., 2006) was used for subtomogram averaging of the highly repetitive axonemal repeats to overcome the inherent low signal-to-noise ratio of cryotomograms. Extracted axonemal repeats were aligned to each other and averaged with missing-wedge compensation, resulting in an increased signal-to-noise ratio and thus improved resolution (Nicastro et al., 2006). A total of 500–800 axonemal repeats from three to five tomograms were averaged for each analyzed strains. Axonemal repeats from all three CSC amiRNA mutant strains showed strong heterogeneity in the occurrence of RS2, and a newly implemented clustering approach incorporated into the software program PEET (Heumann et al., 2011) was used for unsupervised classification, resulting in two classes: in axonemal repeats of class 1 RS2 was present, and repeats in class 2 were missing RS2. Clustering was performed using the principal component analysis option within PEET, and the examined 3D volume was limited to the RS2 region with a mask. Several different settings were tested regarding the number of analyzed features and number of desired classes. The final class averages in this work were obtained by choosing clustering with principal component analysis and 10 features and four desired classes, followed by combining similar classes to a final of two class averages, as shown in Figures 3–5. All class averages were inspected manually for accuracy and showed satisfying results. Some axonemal repeats were excluded only from the average of class 2 (without RS2) in 4D6 because the presence or absence of RS2 remained unclear or the occurrence of an additional spoke complicated the analysis. An in-depth comparison between class averages from the automated classification presented here and an earlier manual classification (Dymek et al., 2011) showed that both approaches gave comparable results of equal quality. Classification details—for example, how many axonemal repeats are present in each class—are summarized in Supplemental Table S1.
The UCSF Chimera software package was used for 3D visualization of axonemal averages by isosurface rendering (Pettersen et al., 2004). Small, unconnected, and randomly positioned densities assumed to be noise were removed with Chimera's “hide dust” feature. Chimera was further used for structural analysis and volume measurements. Mass estimations assumed an average protein density of 1.43 g/cm3 as proposed by Quillin and Matthews (2000).
Supplementary Material
Acknowledgments
We are grateful to Raqual Bower and Mary E. Porter (University of Minnesota, Minneapolis, MN) for providing the pf2-PF2-GFP rescued strain (pWT). Antibodies against the OA component IC69 and against RS proteins RSP1, RSP3, and RSP11 were generously provided by George Witman, Ritsu Kamiya, Winfield Sale, and Pinfen Yang, respectively. We thank Miguel Galvez, Alan Tso, and Avraham Tukachinsky for their help with tomogram reconstruction and greatly appreciate the outstanding management of the Brandeis EM facility by Chen Xu. We are grateful to John Heumann and David Mastronarde (University of Colorado Boulder, Boulder, CO) for assistance with image processing and principal component analysis–based classification within the PEET software program. This work was supported by funding from the National Institutes of Health (GM083122 to D.N. and GM66919 to E.F.S.), the W. M. Keck Foundation (to D.N.), and the National Science Foundation (DMR-MRSEC-0820492 in support of T.H.) and by a Pew Biomedical Scholars Award (to D.N.).
Abbreviations used:
- CA
central apparatus
- CSC
calmodulin- and spoke-associated complex
- DMT
doublet microtubule
- ET
electron tomography
- IA
inner dynein arm
- MT
microtubule
- N-DRC
nexin–dynein regulatory complex
- OA
outer dynein arm
- pWT
pseudo wild type
- RS
radial spoke
- RS3S
radial spoke 3 stand-in
- WT
wild type
Footnotes
This article was published online ahead of print in MBoC in Press (http://www.molbiolcell.org/cgi/doi/10.1091/mbc.E12-05-0357) on June 27, 2012.
REFERENCES
- Afzelius BA. Cilia-related diseases. J Pathol. 2004;204:470–477. doi: 10.1002/path.1652. [DOI] [PMC free article] [PubMed] [Google Scholar]
- Barber CF, Heuser T, Carbajal-González BI, Botchkarev VV Jr, Nicastro D. Three-dimensional structure of the radial spokes reveals heterogeneity and interactions with dyneins in Chlamydomonas flagella. Mol Biol Cell. 2012;23:111–120. doi: 10.1091/mbc.E11-08-0692. [DOI] [PMC free article] [PubMed] [Google Scholar]
- Brokaw CJ. Flagellar movement, a sliding filament model. Science. 1972;178:455–462. doi: 10.1126/science.178.4060.455. [DOI] [PubMed] [Google Scholar]
- Brokaw CJ. Calcium-induced asymmetrical beating of triton-demembranated sea urchin sperm flagella. J Cell Biol. 1979;82:401–411. doi: 10.1083/jcb.82.2.401. [DOI] [PMC free article] [PubMed] [Google Scholar]
- Brokaw CJ, Josslin R, Bobrow L. Calcium ion regulation of flagellar beat symmetry in reactivated sea urchin spermatozoa. Biochem Biophys Res Commun. 1974;58:795–800. doi: 10.1016/s0006-291x(74)80487-0. [DOI] [PubMed] [Google Scholar]
- Bui KH, Sakakibara H, Movassagh T, Oiwa K, Ishikawa T. Molecular architecture of inner dynein arms in situ in Chlamydomonas reinhardtii flagella. J Cell Biol. 2008;183:923–932. doi: 10.1083/jcb.200808050. [DOI] [PMC free article] [PubMed] [Google Scholar]
- Bui KH, Sakakibara H, Movassagh T, Oiwa K, Ishikawa T. Asymmetry of inner dynein arms and inter-doublet links in Chlamydomonas flagella. J Cell Biol. 2009;186:437–446. doi: 10.1083/jcb.200903082. [DOI] [PMC free article] [PubMed] [Google Scholar]
- Dentler WL, Cunningham WP. Structure and organization of radial spokes in cilia of Tetrahymena pyriformis. J Morphol. 1977;153:143–151. doi: 10.1002/jmor.1051530110. [DOI] [PubMed] [Google Scholar]
- Diener DR, Ang LH, Rosenbaum JL. Assembly of flagellar radial spoke proteins in Chlamydomonas, identification of the axoneme binding domain of radial spoke protein 3. J Cell Biol. 1993;123:183–190. doi: 10.1083/jcb.123.1.183. [DOI] [PMC free article] [PubMed] [Google Scholar]
- Diener DR, Curry AM, Johnson KA, Williams BD, Lefebvre PA, Kindle KL, Rosenbaum JL. Rescue of a paralyzed-flagella mutant of Chlamydomonas by transformation. Proc Natl Acad Sci USA. 1990;87:5739–5743. doi: 10.1073/pnas.87.15.5739. [DOI] [PMC free article] [PubMed] [Google Scholar]
- DiPetrillo C, Smith EF. Calcium regulation of ciliary motility, analysis of axonemal calcium binding proteins. Methods Cell Biol. 2009;92:163–180. doi: 10.1016/S0091-679X(08)92011-2. [DOI] [PubMed] [Google Scholar]
- DiPetrillo CG, Smith EF. Pcdp1 is a central apparatus protein that binds Ca2+-calmodulin and regulates ciliary motility. J Cell Biol. 2010;189:601–612. doi: 10.1083/jcb.200912009. [DOI] [PMC free article] [PubMed] [Google Scholar]
- DiPetrillo CG, Smith EF. The Pcdp1 complex coordinates the activity of dynein isoforms to produce wild-type ciliary motility. Mol Biol Cell. 2011;22:4527–4538. doi: 10.1091/mbc.E11-08-0739. [DOI] [PMC free article] [PubMed] [Google Scholar]
- Dymek EE, Heuser T, Nicastro D, Smith EF. The CSC is required for complete radial spoke assembly and wild-type ciliary motility. Mol Biol Cell. 2011;22:2520–2531. doi: 10.1091/mbc.E11-03-0271. [DOI] [PMC free article] [PubMed] [Google Scholar]
- Dymek EE, Smith EF. A conserved CaM- and radial spoke-associated complex mediates regulation of flagellar dynein activity. J Cell Biol. 2007;179:515–526. doi: 10.1083/jcb.200703107. [DOI] [PMC free article] [PubMed] [Google Scholar]
- Fliegauf M, Benzing T, Omran H. When cilia go bad, cilia defects and ciliopathies. Nat Rev Mol Cell Biol. 2007;8:880–893. doi: 10.1038/nrm2278. [DOI] [PubMed] [Google Scholar]
- Gitelman SE, Witman GB. Purification of calmodulin from Chlamydomonas, calmodulin occurs in cell bodies and flagella. J Cell Biol. 1980;87:764–770. doi: 10.1083/jcb.87.3.764. [DOI] [PMC free article] [PubMed] [Google Scholar]
- Goduti DJ, Smith EF. Analyses of functional domains within the PF6 protein of the central apparatus reveal a role for PF6 sub-complex members in regulating flagellar beat frequency. Cytoskeleton (Hoboken) 2012;69:179–194. doi: 10.1002/cm.21010. [DOI] [PMC free article] [PubMed] [Google Scholar]
- Goodenough UW, Heuser JE. Substructure of inner dynein arms, radial spokes, and the central pair/projection complex of cilia and flagella. J Cell Biol. 1985;100:2008–2018. doi: 10.1083/jcb.100.6.2008. [DOI] [PMC free article] [PubMed] [Google Scholar]
- Gorman DS, Levine RP. Cytochrome f and plastocyanin, their sequence in the photosynthetic electron transport chain of Chlamydomonas reinhardtii. Proc Natl Acad Sci USA. 1965;54:1665–1669. doi: 10.1073/pnas.54.6.1665. [DOI] [PMC free article] [PubMed] [Google Scholar]
- Heumann JM, Hoenger A, Mastronarde DN. Clustering and variance maps for cryo-electron tomography using wedge-masked differences. J Struct Biol. 2011;175:288–299. doi: 10.1016/j.jsb.2011.05.011. [DOI] [PMC free article] [PubMed] [Google Scholar]
- Heuser T, Barber CF, Lin J, Krell J, Rebesco M, Porter ME, Nicastro D. Cryo-electron tomography reveals doublet specific structures and unique interactions in the I1 dynein. Proc Natl Acad Sci USA. 2012 doi: 10.1073/pnas.1120690109. doi: 10.1073/pnas.1120690109. [DOI] [PMC free article] [PubMed] [Google Scholar]
- Heuser T, Raytchev M, Krell J, Porter ME, Nicastro D. The dynein regulatory complex is the nexin link and a major regulatory node in cilia and flagella. J Cell Biol. 2009;187:921–933. doi: 10.1083/jcb.200908067. [DOI] [PMC free article] [PubMed] [Google Scholar]
- Hirano J, Watanabe Y. Studies on calmodulin-binding proteins (CaMBPs) in the cilia of Tetrahymena. Exp Cell Res. 1985;157:441–450. doi: 10.1016/0014-4827(85)90129-6. [DOI] [PubMed] [Google Scholar]
- Hisanaga S, Pratt MM. Calmodulin interaction with cytoplasmic and flagellar dynein, calcium-dependent binding and stimulation of adenosinetriphosphatase activity. Biochemistry. 1984;23:3032–3037. doi: 10.1021/bi00308a029. [DOI] [PubMed] [Google Scholar]
- Huang B, Piperno G, Ramanis Z, Luck DJ. Radial spokes of Chlamydomonas flagella, genetic analysis of assembly and function. J Cell Biol. 1981;88:80–88. doi: 10.1083/jcb.88.1.80. [DOI] [PMC free article] [PubMed] [Google Scholar]
- Huang B, Ramanis Z, Luck DJ. Suppressor mutations in Chlamydomonas reveal a regulatory mechanism for flagellar function. Cell. 1982;28:115–124. doi: 10.1016/0092-8674(82)90381-6. [DOI] [PubMed] [Google Scholar]
- Izumi A, Miki-Noumura T. Tetrahymena cell model exhibiting Ca-dependent behavior. Cell Motil. 1985;5:323–331. [Google Scholar]
- Kagami O, Kamiya R. Translocation and rotation of microtubules caused by multiple species of Chlamydomonas inner-arm dynein. J Cell Sci. 1992;103:653–664. [Google Scholar]
- Kagami O, Kamiya R. Separation of dynein species by high-pressure liquid chromatography. Methods Cell Biol. 1995;47:487–489. doi: 10.1016/s0091-679x(08)60849-3. [DOI] [PubMed] [Google Scholar]
- King SM, Kamiya R. Axonemal dyneins, assembly, structure, and force generation. In: Witman GB, editor. The Chlamydomonas Sourcebook, Vol. 3: Cell Motility and Behavior. 2nd ed. Oxford: Elsevier/Academic Press; 2009. pp. 131–208. [Google Scholar]
- Kremer JR, Mastronarde DN, McIntosh JR. Computer visualization of three-dimensional image data using IMOD. J Struct Biol. 1996;116:71–76. doi: 10.1006/jsbi.1996.0013. [DOI] [PubMed] [Google Scholar]
- Lin J, Heuser T, Carbajal-González BI, Song K, Nicastro D. The structural heterogeneity of radial spokes in cilia and flagella is conserved. Cytoskeleton (Hoboken) 2012;69:88–100. doi: 10.1002/cm.21000. [DOI] [PMC free article] [PubMed] [Google Scholar]
- Linck RW, Stephens RE. Functional protofilament numbering of ciliary, flagellar, and centriolar microtubules. Cell Motil Cytoskeleton. 2007;64:489–495. doi: 10.1002/cm.20202. [DOI] [PubMed] [Google Scholar]
- Luck D, Piperno G, Ramanis Z, Huang B. Flagellar mutants of Chlamydomonas, studies of radial spoke-defective strains by dikaryon and revertant analysis. Proc Natl Acad Sci USA. 1977;74:3456–3460. doi: 10.1073/pnas.74.8.3456. [DOI] [PMC free article] [PubMed] [Google Scholar]
- Mastronarde DN. Automated electron microscope tomography using robust prediction of specimen movements. J Struct Biol. 2005;152:36–51. doi: 10.1016/j.jsb.2005.07.007. [DOI] [PubMed] [Google Scholar]
- Mitchell DR, Rosenbaum JL. A motile Chlamydomonas flagellar mutant that lacks outer dynein arms. J Cell Biol. 1985;100:1228–1234. doi: 10.1083/jcb.100.4.1228. [DOI] [PMC free article] [PubMed] [Google Scholar]
- Molnar A, Bassett A, Thuenemann E, Schwach F, Karkare S, Ossowski S, Weigel D, Baulcombe D. Highly specific gene silencing by artificial microRNAs in the unicellular alga Chlamydomonas reinhardtii. Plant J. 2009;58:165–174. doi: 10.1111/j.1365-313X.2008.03767.x. [DOI] [PubMed] [Google Scholar]
- Naitoh Y, Kaneko H. Reactivated triton extracted models of Paramecium; modification of ciliary movement by calcium ions. Science. 1972;176:523–524. doi: 10.1126/science.176.4034.523. [DOI] [PubMed] [Google Scholar]
- Nicastro D. Cryo-electron microscope tomography to study axonemal organization. Methods Cell Biol. 2009;91:1–39. doi: 10.1016/S0091-679X(08)91001-3. [DOI] [PubMed] [Google Scholar]
- Nicastro D, Fu X, Heuser T, Tso A, Porter ME, Linck RW. Cryo-electron tomography reveals conserved features of doublet microtubules in flagella. Proc Natl Acad Sci USA. 2011;108:E845–E853. doi: 10.1073/pnas.1106178108. [DOI] [PMC free article] [PubMed] [Google Scholar]
- Nicastro D, McIntosh JR, Baumeister W. 3D structure of eukaryotic flagella in a quiescent state revealed by cryo-electron tomography. Proc Natl Acad Sci USA. 2005;102:15889–15894. doi: 10.1073/pnas.0508274102. [DOI] [PMC free article] [PubMed] [Google Scholar]
- Nicastro D, Schwartz C, Pierson J, Gaudette R, Porter ME, McIntosh JR. The molecular architecture of axonemes revealed by cryoelectron tomography. Science. 2006;313:944–948. doi: 10.1126/science.1128618. [DOI] [PubMed] [Google Scholar]
- Olson GE, Linck RW. Observations of the structural components of flagellar axonemes and central pair microtubules from rat sperm. J Ultrastruct Res. 1977;61:21–43. doi: 10.1016/s0022-5320(77)90004-1. [DOI] [PubMed] [Google Scholar]
- Otter T. Calmodulin and the control of flagellar movement. In: Warner FD, Satir P, Gibbons IR, editors. Cell Movement, Vol 1. New York: Alan R. Liss; 1989. pp. 281–298. [Google Scholar]
- Pazour GJ, Agrin N, Leszyk J, Witman GB. Proteomic analysis of a eukaryotic cilium. J Cell Biol. 2005;170:103–113. doi: 10.1083/jcb.200504008. [DOI] [PMC free article] [PubMed] [Google Scholar]
- Pettersen EF, Goddard TD, Huang CC, Couch GS, Greenblatt DM, Meng EC, Ferrin TE. UCSF Chimera—a visualization system for exploratory research and analysis. J Comput Chem. 2004;25:1605–1612. doi: 10.1002/jcc.20084. [DOI] [PubMed] [Google Scholar]
- Pigino G, Bui KH, Maheshwari A, Lupetti P, Diener D, Ishikawa T. Cryoelectron tomography of radial spokes in cilia and flagella. J Cell Biol. 2011;195:673–687. doi: 10.1083/jcb.201106125. [DOI] [PMC free article] [PubMed] [Google Scholar]
- Pigino G, Maheshwari A, Bui KH, Shingyoji C, Kamimura S, Ishikawa T. Comparative structural analysis of eukaryotic flagella and cilia from Chlamydomonas, Tetrahymena, and sea urchins. J Struct Biol. 2012;178:199–206. doi: 10.1016/j.jsb.2012.02.012. [DOI] [PubMed] [Google Scholar]
- Piperno G, Huang B, Luck DJ. Two-dimensional analysis of flagellar proteins from wild-type and paralyzed mutants of Chlamydomonas reinhardtii. Proc Natl Acad Sci USA. 1977;74:1600–1604. doi: 10.1073/pnas.74.4.1600. [DOI] [PMC free article] [PubMed] [Google Scholar]
- Piperno G, Huang B, Ramanis Z, Luck DJ. Radial spokes of Chlamydomonas flagella, polypeptide composition and phosphorylation of stalk components. J Cell Biol. 1981;88:73–79. doi: 10.1083/jcb.88.1.73. [DOI] [PMC free article] [PubMed] [Google Scholar]
- Porter ME, Sale WS. The 9 + 2 axoneme anchors multiple inner arm dyneins and a network of kinases and phosphatases that control motility. J Cell Biol. 2000;151:F37–F42. doi: 10.1083/jcb.151.5.f37. [DOI] [PMC free article] [PubMed] [Google Scholar]
- Quillin ML, Matthews BW. Accurate calculation of the density of proteins. Acta Crystallogr D Biol Crystallogr. 2000;56:791–794. doi: 10.1107/s090744490000679x. [DOI] [PubMed] [Google Scholar]
- Rupp G, Porter ME. A subunit of the dynein regulatory complex in Chlamydomonas is a homologue of a growth arrest-specific gene product. J Cell Biol. 2003;162:47–57. doi: 10.1083/jcb.200303019. [DOI] [PMC free article] [PubMed] [Google Scholar]
- Satir P. Studies on cilia. 3. Further studies on the cilium tip and a “sliding filament” model of ciliary motility. J Cell Biol. 1968;39:77–94. doi: 10.1083/jcb.39.1.77. [DOI] [PMC free article] [PubMed] [Google Scholar]
- Satir P. Switching mechanisms in the control of ciliary motility. In: Satir B, editor. Modern Cell Biology. New York: Alan R. Liss; 1985. pp. 1–46. [Google Scholar]
- Smith EF. Regulation of flagellar dynein by calcium and a role for an axonemal calmodulin and calmodulin-dependent kinase. Mol Biol Cell. 2002;13:3303–3313. doi: 10.1091/mbc.E02-04-0185. [DOI] [PMC free article] [PubMed] [Google Scholar]
- Smith EF, Yang P. The radial spokes and central apparatus, mechano-chemical transducers that regulate flagellar motility. Cell Motil Cytoskeleton. 2004;57:8–17. doi: 10.1002/cm.10155. [DOI] [PMC free article] [PubMed] [Google Scholar]
- Summers KE, Gibbons IR. Adenosine triphosphate-induced sliding of tubules in trypsin-treated flagella of sea-urchin sperm. Proc Natl Acad Sci USA. 1971;68:3902–3906. doi: 10.1073/pnas.68.12.3092. [DOI] [PMC free article] [PubMed] [Google Scholar]
- Verdugo P. Ca2+-dependent hormonal stimulation of ciliary activity. Nature. 1980;283:764–765. doi: 10.1038/283764a0. [DOI] [PubMed] [Google Scholar]
- Wargo MJ, Dymek EE, Smith EF. Calmodulin and PF6 are components of a complex that localizes to the C1 microtubule of the flagellar central apparatus. J Cell Sci. 2005;118:4655–4665. doi: 10.1242/jcs.02585. [DOI] [PubMed] [Google Scholar]
- Witman GB. Isolation of Chlamydomonas flagella and flagellar axonemes. Methods Enzymol. 1986;134:280–290. doi: 10.1016/0076-6879(86)34096-5. [DOI] [PubMed] [Google Scholar]
- Witman GB, Carlson K, Berliner J, Rosenbaum JL. Chlamydomonas flagella, I. Isolation and electrophoretic analysis of microtubules, matrix, membranes, and mastigonemes. J Cell Biol. 1972;54:507–539. doi: 10.1083/jcb.54.3.507. [DOI] [PMC free article] [PubMed] [Google Scholar]
- Witman GB, Minervini N. Role of calmodulin in the flagellar axoneme, effect of phenothiazines on reactivated axonemes of Chlamydomonas. Prog Clin Biol Res. 1982;80:199–204. doi: 10.1002/cm.970020738. [DOI] [PubMed] [Google Scholar]
- Yagi T, Uematsu K, Liu Z, Kamiya R. Identification of dyneins that localize exclusively to the proximal portion of Chlamydomonas flagella. J Cell Sci. 2009;122:1306–1314. doi: 10.1242/jcs.045096. [DOI] [PubMed] [Google Scholar]
- Yang P, Diener DR, Rosenbaum JL, Sale WS. Localization of calmodulin and dynein light chain LC8 in flagellar radial spokes. J Cell Biol. 2001;153:1315–1326. doi: 10.1083/jcb.153.6.1315. [DOI] [PMC free article] [PubMed] [Google Scholar]
- Yang P, et al. Radial spoke proteins of Chlamydomonas flagella. J Cell Sci. 2006;119:1165–1174. doi: 10.1242/jcs.02811. [DOI] [PMC free article] [PubMed] [Google Scholar]
- Yang P, Smith EF. The flagellar radial spokes. In: Witman GB, editor. The Chlamydomonas Sourcebook, Vol. 3: Cell Motility and Behavior. 2nd ed. Oxford: Elsevier/Academic Press; 2009. pp. 209–234. [Google Scholar]
- Zhao T, Wang W, Bai X, Qi Y. Gene silencing by artificial microRNAs in Chlamydomonas. Plant J. 2009;58:157–164. doi: 10.1111/j.1365-313X.2008.03758.x. [DOI] [PubMed] [Google Scholar]
Associated Data
This section collects any data citations, data availability statements, or supplementary materials included in this article.