Abstract
The time required for data acquisition and subsequent spectral assignment are limiting factors for determining biomolecular structure and dynamics using solid state NMR spectroscopy. While strong magnetic dipolar couplings give rise to relatively broad spectra lines, the couplings also mediate the coherent magnetization transfer via the Hartmann Hahn cross polarization (HH-CP) experiment. This mechanism is used in nearly all backbone assignment experiments for carrying out polarization transfer between 1H, 15N, and 13C. In this Article, we describe a general spectroscopic approach to use the residual or afterglow magnetization from the 15N to 13C selective HH-CP experiment to collect a second multidimensional heteronuclear dataset. This approach allowed for the collection of two multidimensional (2D NCA and NCO or 3D NCACX and NCOCX) datasets at the same time. These experiments were performed using instrumentation available on all standard solid state NMR spectrometers configured for magic angle spinning and were demonstrated on uniformly [13C,15N] and [1,3-13C] glycerol labeled ubiquitin. This method is compatible with several other sensitivity enhancement experiments and can be used as an isotopic filtering tool to reduce the spectral complexity and decrease the time needed for assigning spectra.
Keywords: NMR, solid state NMR, crystals, proton driven spin diffusion, assignment methods, ubiquitin, fast data acquisition, sequential acquisition, detection approaches
Introduction
Solid-state NMR magic-angle-spinning (SSNMR MAS) is a widely used method to probe structure and dynamics of hard and soft biological matter.1-7 One of the main bottlenecks in this process is assigning the spectra, which can be especially challenging for membrane proteins and amyloid samples. To address this problem, a number of ways have been proposed to improve the spectral resolution and sensitivity of data acquisition. These can be broadly grouped into three categories: (1) spectroscopic based (e.g., pulse sequences, data acquisition), (2) sample preparation (e.g., isotopic labeling, paramagnetic labeling), and (3) advances in instrumentation (e.g., multiple receivers, cryogenic probes). Combined spectroscopic and instrumentation approaches such as simultaneous or sequential data acquisitions have been applied to the time-consuming process of spectral assignment through the improvement of these triple resonance techniques that shorten data acquisition times.8-11
A novel solution NMR approach recently introduced by Kupce et al. utilizes the residual or “afterglow” 13C magnetization for the purpose of acquiring multiple heteronuclear spectra at the same time.9 In this pulse sequence, the 13C magnetization was directly detected to acquire a 2D (HA)CACO experiment nuclease A inhibitor in the standard way. The residual 13CO magnetization was then transferred to 15N and finally detected using the sensitive 1HN magnetization in a 3D (HA)CA(CO)NNH experiment. Since 13C and 1H signals were detected, these experiments made use of parallel acquisition requiring two receivers. Unlike this solution NMR methodology that relied on J-couplings, the most important transfer mechanism in oriented and MAS SSNMR is the Hartmann Hahn cross-polarization (HH-CP).12-15 This experiment utilizes matched spinlocks on two channels resulting in coherent polarization transfer from one nucleus to the other. Since the CP is the basic element for nearly all SSNMR applications, a tremendous amount of effort has been devoted to understanding and improving this experiment,16-20 including the use of multiple contact pulses.12,21 Transfer of magnetization among low frequency 15N and 13C most commonly utilizes the double CP22-26 or other novel polarization transfer approaches.27-32
A new application of the CP experiment was recently proposed and demonstrated using RNA in SSNMR spectroscopy. This triple resonance cross polarization method uses 1H to simultaneously polarize 13C and 15N with subsequent parallel acquisition using two receivers.8 This scheme has been applied to obtain sequentially acquired datasets that give a 13C-13C correlation spectrum and a heteronuclear 13C-15N (NCA or NCO) correlation spectrum using a single receiver (DU-MAS).10 Careful optimization of the simultaneous cross-polarization will give only small losses on the transfer from 1H to both 15N and 13C as compared to the double resonance CP experiment. These methods and others listed above rely on relatively long 15N and 13C T1 and T1ρ values in soft and hard matter, including membrane proteins in oriented lipid bilayers.33,34
To improve the efficiency of data acquisition in SSNMR MAS, we describe an approach to detect residual or “afterglow” magnetization resulting from the double CP experiment involving selective transfer from 15N to 13CA. We show that this 15N magnetization is appreciable and can be used to obtain a second multidimensional heteronuclear correlation experiment with good sensitivity. In practice, the result is the detection of two 2D (NCA and NCO) or two 3D (NCACX and NCOCX) experiments at the same time (i.e., two for the price of one). These experiments do not require special instrumentation, and are therefore applicable to all spectroscopic approaches where residual coherence can be salvaged for increasing the speed of data acquisition.
Experimental Methods
Sample Preparation
Ubiquitin was expressed in BL21(DE3) E. coli bacteria in the presence of uniformly labeled 13C6-glucose and 15N-ammonium chloride in minimal media (M9) and purified as previously described.35 The glycerol labeling experiment was achieved by replacing glucose with [1,3-13C] glycerol (1 g/L) and natural abundance sodium carbonate (1 g/L).36,37 For preparation of the solid-state NMR samples, 10 mg of ubiquitin was dissolved in 400 Fl 20 mM sodium citrate at pH 4.1. Crystallization was initiated by the dropwise addition of 2-methyl-2,4-pentanediol (MPD) to a final concentration of 60% and allowed to proceed overnight at 4 °C.38 The samples were packed into 3.2 mm MAS rotors using samples spacers to prevent sample dehydration.
NMR Spectroscopy
All NMR experiments were carried out using a DDR2 Agilent NMR spectrometer operating at a 1H frequency of 600 MHz. The temperature was set to 0 °C and the MAS rate was 12500 ± 5 Hz. The initial cross-polarization from 1H to 15N utilized a contact time of 1 msec. The transfers between 15N to 13CA and 15N to 13CO utilized SPECIFIC-CP23, a form of double CP,25 where the 15N offset was set to 121 ppm, the 13CA offset to 57.5 ppm, and the 13CO offset to 175 ppm. The 15N to 13CA transfer used a tangent adiabatic ramp22 on the 15N channel, while the 13CO SPECIFIC-CP utilized the ramp on the carbon channel. The Δ/2π and β/2π parameters of the adiabatic cross-polarization were set to 1.2 kHz and 0.3 kHz for the 15N to 13CA transfer and 3.7 kHz and 0.9 kHz for the 15N to 13CO transfer (see Eqns. 1 and 2 of Franks et al.39) with the total length of the cross-polarization time set to 4 msec. All parameters were optimized to obtain maximal signal intensity in the standard 1D NCO and NCA experiments. Both sequential data acquisition periods used a 13C spectral width of 100 kHz and an acquisition time of 20 msec. The indirect 15N dimension was acquired with a spectral width of 3125 Hz and 28 increments. A total of 64 and 128 scans were used for the [U-13C,15N] and [1,3-13C] glycerol labeled ubiquitin samples, respectively. For spin diffusion experiments between 13C spins, the DARR condition was set to the n=1 rotary resonance condition on 1H (12.5 kHz).40
Results
Sequential Acquisition of Residual 15N Magnetization
The standard experiments for obtaining resonance assignments and distance restraints in MAS utilize multiple transfers between 15N and 13CA or 15N and 13CO. The NCACX and NCOCX experiments are two of the most valuable that give correlations among the backbone nuclei. The former correlates intra-residue carbon atoms with the chemical shifts of 15N and 13CA. This involves a HH-CP element where 1H polarization is transferred to 15N and followed by a 15N chemical shift evolution in t1. Magnetization is then most commonly transferred to 13CA using a type of double cross polarization25 called SPECIFIC CP.23 After the transfer, 13CA chemical shifts are evolved in the t2 time dimension and then allowed to undergo spin diffusion most commonly with a DARR mixing period.40 Finally, the 13C magnetization is detected in the direct dimension. These are the standard experiments carried out and will be referred to as the STD-NCA or STD-NCACX (with DARR).
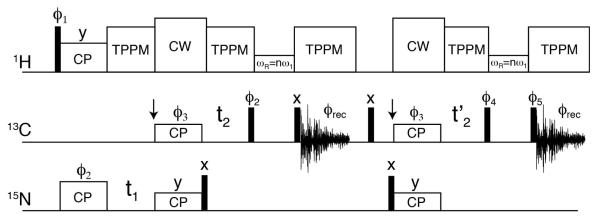
Following the SPECIFIC-CP transfer to 13CA, there is residual 15N magnetization remaining that is typically discarded. Using [U-15N,13C] ubiquitin, we carried out the 1D NCA experiment detecting on 15N immediately following the SPECIFIC-CP transfer to 13CA. Relative to the 15N magnetization after CP from 1H, ~40-45% of the 15N signal remained. Therefore, it is possible to detect this 15N polarization at the same time as the STD-NCA 13C detected experiment with a second receiver (parallel acquisition11). However, 1D spectra do not provide the resolution required for resolving all the protein resonances. Instead, the pulse sequence in Figure 1 shows how afterglow (or residual) 15N signal can be salvaged to obtain a second 2D NCO or 3D NCOCX dataset. The first half of the pulse sequence in Figure 1 is identical to that of a standard NCA (or NCACX) experiment. To reuse the residual 15N magnetization, a 90° pulse is applied to 15N spins immediately following the SPECIFIC-CP transfer to 13CA. This stores the magnetization along the z-axis. Since the T1 relaxation times for 15N in proteins are on the order of seconds, placing the spins along the z-axis results in only a small amount of magnetization lost due to longitudinal relaxation. Following the free-induction-decay acquisition for the 2D NCA (or 3D NCACX) experiment, a 90x° pulse is applied to 15N placing it along the y-axis. Next, a second SPECIFIC-CP step is used to transfer magnetization to 13CO in the same way as a standard NCO experiment. The 13CO magnetization is then directly detected to obtain a 2D NCO or evolved in the indirect t2’ dimension followed by a DARR mixing element to give a 3D NCOCX experiment. If evolved in the indirect dimension, t2’ is arrayed concurrently with the 13CA t2 evolution period for the NCACX experiment. Both simultaneously acquired datasets have an identical 15N chemical shift evolution period (t1). For brevity, we will refer to the sequentially acquired datasets using the following nomenclature: SIM1-NCA or SIM1-NCACX (first dataset acquired) or SIM2-NCO or SIM2-NCOCX (second dataset acquired); the standard experiments will be called STD-NCA, STD-NCO, STD-NCACX, or STD-NCOCX.
Figure 1.
Pulse sequence with two acquisitions for simultaneous detection of 2D SIM1-NCA and SIM2-NCO or 3D SIM1-NCACX and SIM2-NCOCX spectra. The former are achieved by setting the DARR mixing time to zero. The DARR mixing can be replaced with a double quantum transfer for improved single bond transfers. The narrow rectangles correspond to 90° pulses. Phase are: ϕ1=(x,−x), ϕ2=(y), ϕ3=(x,x,y,y), ϕ4=(−y,−y,−x,−x), ϕ5=(y,y,−x,−x), and ϕrec=(x,−x,−y,y). To obtain phase-sensitive data in t1 and t2, ϕ2 and ϕ3 were phase-shifted by 90°, respectively. After the first FID acquisition, a 5 msec time was allowed to dephase residual 13C magnetization; during this time a 90x° pulse was applied 13C.
Application to Uniformly Labeled Ubiquitin
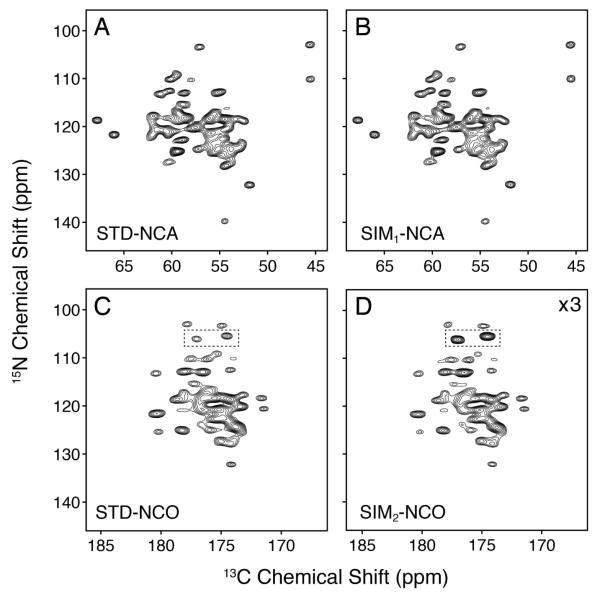
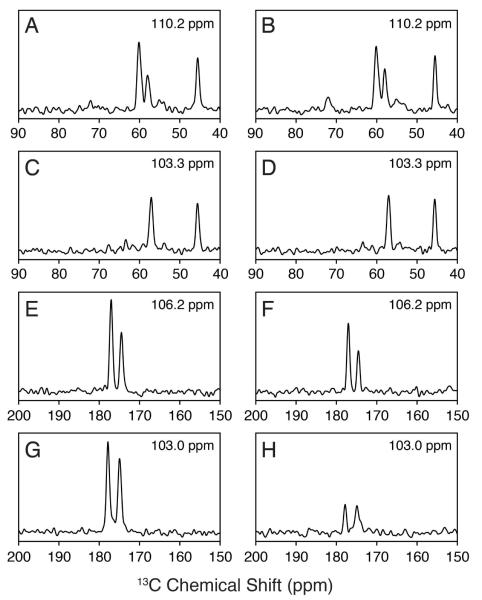
We carried out the pulse sequence in Figure 1 on selectively and uniformly labeled ubiquitin prepared in a microcrystalline state. [U-13C,15N] ubiquitin has 76 residues and therefore 76 15N-13CA pairs. The 2D STD-NCA and SIM1-NCA datasets on [U-13C,15N] ubiquitin are shown in Figure 2. These spectra give the same signal to noise, which is expected since the first half of the pulse sequence in Figure 1 is identical to the STD-NCA experiment. After the first transfer from 15N to 13CA, the amount of 15N magnetization available for the 15N to 13CO SPECIFIC-CP is reduced. This results in an overall signal intensity of the SIM2-NCO 2D dataset of 32 ± 3% compared to that of the STD-NCO. However, the SIM2-NCO gives ~50% the signal/noise as the SIM1-NCA, which results from the slightly better efficiency of the 15N to 13CO vs. 15N to 13CA SPECIFIC-CP experiment.39,41 Although the second dataset is lower in intensity (see 1D cross sections in Figure 3), the SIM2-NCO is a free dataset since the preparation and subsequent detection of the afterglow 15N magnetization only adds ~25 msec to the overall pulse sequence. In practice, for a recycle delay of 2 sec and an acquisition period of 25 msec, the pulse sequence in Figure 1 only increases the experimental time by 1.2% relative to the STD-NCA. If a 3 sec recycle delay is used, this amounts to an increase of 0.8%.
Figure 2.
Comparison of the standard vs. sequentially acquired datasets on [U-13C,15N] ubiquitin. The STD-NCA and STD-NCO datasets (A and C) used identical experimental parameters as the sequentially acquired ones (B and D). The spectra in panels A and B are each plotted starting at a contour level of 18.75. This is a factor of 1.5 higher than the SIM2-NCO dataset (panel D; first contour: 12.5). The SIM2-NCO spectrum (panel C) is plotted at 3 times the signal level compared to the STD-NCO (first contour: 37.5), which accounts for the signal loss in the SIM2-NCO from the SPECIFIC-CP transfer to 13CA. For the listed contour levels, the standard deviation of the noise is 1.0. The peaks in the dotted rectangles indicate side chain residues that have 75% intensity retention. The 2D datasets for the STD-NCA and STD-NCO together required 2 times longer acquisition than that for the SIM1-NCA and SIM2-NCO.
Figure 3.
1D cross-sections of the 2D spectra shown in Figure 2 for [U-13C,15N] ubiquitin. The 15N frequencies are given in each panel. The STD-NCA 1D cross sections (A, C) can be directly compared with those of the SIM1-NCA dataset (B, D). As expected these peak intensities are identical. The STD-NCO cross sections (E, G) are directly compared to those of the SIM2-NCO (F, H). The noise level is the same in all 1D spectra. The spectra in panels E and F correspond to side chain 15NH2 resonances.
There are ~45-50 resonances within the NCA spectra shown in Figure 2 out of the 76 residues in ubiquitin. It has been reported that nine peaks do not appear as a result of residual motion in the loop encompassing residues 8-10 and the C-terminus (residues 71-76) at 0 °C.38 In addition, some of the peaks have reduced signal intensity based on crystallization with MPD or polyethylene glycol (PEG).42 For example, in the 2D N-CA spectrum reported by Seidel et al. crystallized from PEG, there are four clearly resolved Gly peaks (G10, G35, G47, and G53), however, in the ubiquitin N-CA spectrum reported by Schubert et al. prepared by crystallization using MPD (same as the ubiquitin preparations used in this study), only G35 and G47 were observed.43 The lack of the Gly10 peak is consistent with the cross-polarization based results from Igumenova et al.38 These observations from the literature as well as our detection of an additional ~3-5 peaks at a reduced contour level from the data in Figure 2 account for the large majority of the expected resonances in ubiquitin. To identify the remaining spin systems, experiments at a higher magnetic field and/or 3D spectroscopy can be used.44
The 3D version of the SIM2-NCOCX and SIM1-NCACX datasets evolve the 13CO and 13CA dimensions together in t2’ and t2, respectively. It is important to realize that the dwell times for the 13CO and 13CA dimensions can be different, which is beneficial since the 13CA chemical shift range is ~30 ppm, while the 13CO region is ~10 ppm (a factor of three). Therefore, it is possible to reduce the number of increments in the indirect 13CO dimension by a factor of three and increase the number of scans by the same factor in order to obtain the same maximal indirect acquisition time in t2 and t2’. Alternatively, one may acquire additional indirect points in t2 or t2’.10 For example, 13CO nuclei typically have longer T2 relaxation time in proteins relative to 13CA, allowing for increased sampling of the maximum t2’ in the SIM2-NCOCX experiment, which would increase the resolution. These linear correction factors have previously been used in the DU-MAS technique.10
It should also be stated that while the first DARR mixing time is intended for only the 13C spins, the 15N nuclei that have been stored along the z-axis may also undergo spin diffusion. However, this will be relatively minor (< 5%) for typical mixing times of ~200 msec.42 It is also noted that the order of the sequentially acquired experiments can be inverted to detect the NCO first (i.e., SIM1-NCO), followed by the SIM2-NCA experiment. In this case, the SIM1-NCO will give the same signal/noise as the STD-NCO, while the SIM2-NCA spectrum will have ~33% the signal/noise as the STD-NCA experiment.
Distinguishing Side Chain NH2 Peaks in the Spectrum
In the SIM2-NCO spectrum, it was also possible to easily distinguish the side chain NH2 peaks from those of backbone amides in [U-13C,15N] samples. For the side chain Asn or Gln residues, the 15N to 13CA SPECIFIC-CP does not transfer amine 15N magnetization to 13C spins, since the covalent Cγ (Asn) or Cδ (Gln) nuclei have chemical shifts of ~175 ppm (13CA offset for the experiment is ~57.5 ppm). Therefore, a relatively small loss in side chain signal (~25%) was observed in the SIM2-NCO spectrum relative to that of the STD-NCO. The side chain amine peaks are highlighted in the SIM2-NCO experiment in Figure 2 and displayed as 1D cross-sections in Figure 3E and F. For [U-13C,15N] samples, this means these peaks are the most intense in the spectrum and are easily distinguishable from those of the backbone NCO cross peaks. Since the 15N amine resonances can overlap with those from the amide 15N of Ser, Gly, and Thr, the intensity of the peaks can be used to easily distinguish these residue types for the purpose of spectral assignment.
Application to Selective Glycerol Labeling in Ubiquitin
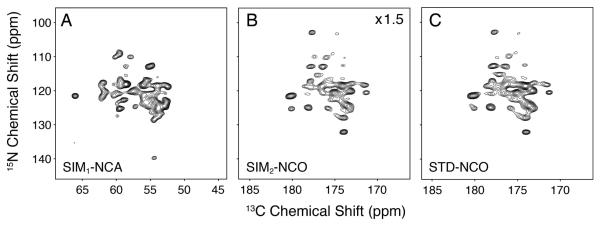
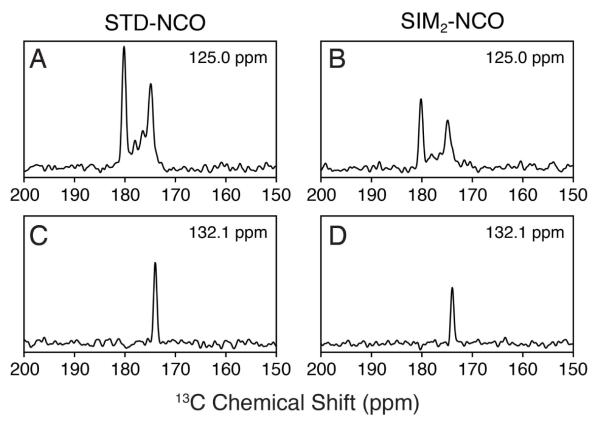
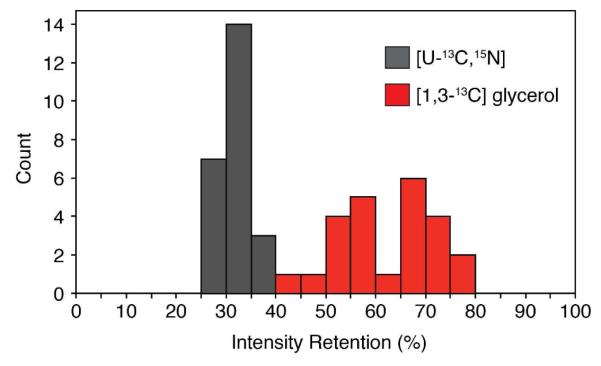
A common way to improve resolution and reduce spectral congestion is the use of selective labeling schemes.45,46 One of the preferred methods is glycerol labeling ([1,3-13C] or [2-13C]) that significantly reduces pairwise 13C labels (i.e., few 13C-13C covalent bonds). This decreases resonance linewidths by removing one-bond carbon-carbon J-couplings and eliminates many of the resonances in a given spectrum.36,37 It is also common to use glycerol or reverse labeling47 in conjunction with double CP48,49 or REDOR based dephasing50-53 to assist in the assignment process.48,49 We applied our sequential acquisition pulse sequence to ubiquitin labeled with [1,3-13C] glycerol and detected SIM1-NCA and SIM2-NCO 2D spectra at the same time (Figure 4). Selected 1D cross sections are shown in Figure 5 for a simpler comparison. In general, we found that several of the peaks in the NCA and NCO based spectra were missing as expected from the isotopic labeling pattern (e.g., Gly resonances at 45 ppm in the SIM1-NCA).36,37 In fact, on average we observed that the SIM2-NCO gave 63 ± 9% of the sensitivity compared to the STD-NCO spectrum (Figure 6). The primary advantage of our approach for partially labeled samples is to maintain no loss in sensitivity for the SIM1-NCA dataset, while also obtaining a complementary dataset compared to that for [U-13C,15N] samples. In other words, the 15N to 13CA SPECIFIC-CP element acts as an isotope filter that can be used to assign peaks.48 For uniformly labeled samples, the spectral information for backbone amide peaks between STD-NCO and SIM2-NCO contains identical information, since all sites have 13C labeling. However, for the [1,3-13C] glycerol sample, the incorporation at the 13CA depends on the residue type.36,37 As a way to illustrate this, we plot the intensity retention as a histogram in Figure 6 comparing the uniform vs. glycerol labeling. The retention was calculated as the SIM2-NCO peak intensity divided by the same resonance in the STD-NCO. Only resolved peaks were used in this calculation and all resonances analyzed are the same for the glycerol and uniform labeling. The wide distribution of intensity retentions compared to that obtained for the [U-13C,15N] ubiquitin sample shows that the sequential acquisition approach can be used to assign resonances in a similar way as done previously.48,54
Figure 4.
Comparison of the standard vs. sequentially acquired datasets on [1,3-13C] glycerol labeled ubiquitin. The STD-NCA (not shown) is identical to that of the SIM1-NCA (panel A). All comparable experimental parameters were the same between the STD-NCO (panel C) and the SIM2-NCO (panel B). The sequentially acquired datasets in panels A and B are plotted at the same noise level (first contour: 11.0). The SIM2-NCO spectrum (panel B) is plotted at 1.5 times the signal level compared to the STD-NCO (panel C; first contour: 16.5); this accounts for the average signal loss in the SIM2-NCO due to the SPECIFIC-CP transfer to 13CA. For the listed contour levels, the standard deviation of the noise is 1.0.
Figure 5.
1D cross sections of the 2D spectra shown in Figure 4 for the [1,3-13C] glycerol labeled ubiquitin sample. The 15N frequencies indicated in each panel are directly comparable for the STD-NCO (A, C) and SIM2-NCO spectra (B, D). The noise level is the same for the four 1D cross-sections.
Figure 6.
Histogram of intensity retention for the [1,3-13C] glycerol vs. [U-13C,15N] labeling ubiquitin samples. The intensity retention is calculated by dividing the intensity of the resolved peak in the 2D SIM2-NCO spectrum by the corresponding resonance in the 2D STD-NCO. In total 24 resolved peaks from the 2D spectra from Figures 2 and 4 were used for this analysis. The average ± standard deviation for the two samples are: [U-13C,15N] = 32 ± 3%, [1,3-13C] glycerol = 63 ± 9%.
Discussion
Developments in magnetic resonance spectroscopy aim to improve the rate of characterizing biomolecular structure, dynamics, and imaging. We introduced a simple approach to utilizing residual or afterglow magnetization from the 15N double CP experiment to obtain a second multidimensional dataset that can be used to assign biomolecules by SSNMR. In current practice this residual magnetization is neither refocused nor directly detected. Since one of the most important factors determining experimental length is the recycle time (time needed to obtain equilibrium), methods such as RELOAD55 and use of paramagnetic agents56-58 strive to reduce or eliminate the need for the long recycle delays. Our method detects two heteronuclear correlation spectra (NCA and NCO) back to back with no recycle delay between experiments. This means two datasets can be acquired for the same amount of time as the standard acquisition that gives only a single dataset. For [U-13C,15N] ubiquitin, we have shown that the SIM2-NCO gives 33% of the sensitivity as the STD-NCO dataset and 50% the signal/noise as the SIM1-NCA. This means that an additional dataset with excellent signal/noise can be obtained with no loss in sensitivity to the first dataset when compared to the standard method. Related methods have utilized multiple cross-polarization elements to improve sensitivity59 or cross depolarization filtering techniques.60 Note that it is possible to carry novel non-selective 15N to 13C double CP transfer,26 but this compromises the sensitivity of the NCA region by ~30%.
Our sequential acquisition method is also amenable to selective glycerol or reverse labeling approaches. Since these samples have dilute 13C spins, it is possible to obtain two datasets with nearly the same signal/noise without compromising the sensitivity of the spectrum acquired first. An application of our approach is the use of selectively labeled protein samples to aide in the assignment of overlapped spectra. This is important for poorly dispersed 15N signals such as membrane proteins that often do not allow for robust assignments from triple resonance experiments.52,61 While some well-ordered membrane proteins give excellent spectra,62-64 several other membrane proteins have biologically relevant conformational disorder65-69 that gives rise to broader spectral lines. Future developments such as TROSY based methods may aide in reducing 15N line-widths that are broadened from N-H motion on the nsec to μsec timescale.70
In summary, the presented method uses “afterglow” 15N magnetization remaining from the initial double CP step to obtain a second high quality dataset. The acquisition of these 2D or 3D datasets relies on long T1ρ and T1 relaxation times that exist for 15N in SSNMR.71 Our approach is also compatible with several existing techniques, including the DU-MAS method,10,72 paramagnetic-based sensitivity enhancement methods,56-58 dynamic nuclear polarization experiments,73 applications utilizing time-resolved MAS techniques,74-76 and oriented SSNMR. This method requires no additional SSNMR hardware and will result in no loss in sensitivity for the first dataset. The second dataset is free and can be detected with good sensitivity for biomolecular assignments in MAS SSNMR spectroscopy.
Acknowledgement
The authors thank Prof. Alexej Jerschow for a careful reading of the manuscript. This work was supported by NIH grant 5K22AI083745 and start up funds from New York University.
Footnotes
Supporting Information
The pulse sequence in Figure 1 can be downloaded from our website: www.nyu.edu/fas/dept/chemistry/traasethgroup/
References
- (1).McDermott AE. Curr Opin Struct Biol. 2004;14:554–561. doi: 10.1016/j.sbi.2004.09.007. [DOI] [PubMed] [Google Scholar]
- (2).Opella SJ, Marassi FM. Chem Rev. 2004;104:3587–3606. doi: 10.1021/cr0304121. [DOI] [PMC free article] [PubMed] [Google Scholar]
- (3).Hong M. J Phys Chem B. 2007;111:10340–10351. doi: 10.1021/jp073652j. [DOI] [PubMed] [Google Scholar]
- (4).Tycko R. Ann Rev Phys Chem. 2011;62:279–299. doi: 10.1146/annurev-physchem-032210-103539. [DOI] [PMC free article] [PubMed] [Google Scholar]
- (5).Baldus M. Curr Opin Struct Biol. 2006;16:618–623. doi: 10.1016/j.sbi.2006.08.003. [DOI] [PubMed] [Google Scholar]
- (6).Naito A. Solid State Nucl Magn Reson. 2009;36:67–76. doi: 10.1016/j.ssnmr.2009.06.008. [DOI] [PubMed] [Google Scholar]
- (7).Wylie BJ, Rienstra CM. J Chem Phys. 2008;128:052207. doi: 10.1063/1.2834735. [DOI] [PubMed] [Google Scholar]
- (8).Herbst C, Riedel K, Ihle Y, Leppert J, Ohlenschlager O, Gorlach M, Ramachandran R. J Biomol NMR. 2008;41:121–125. doi: 10.1007/s10858-008-9247-1. [DOI] [PubMed] [Google Scholar]
- (9).Kupce E, Kay LE, Freeman R. J Am Chem Soc. 2010;132:18008–18011. doi: 10.1021/ja1080025. [DOI] [PubMed] [Google Scholar]
- (10).Gopinath T, Veglia G. Angewandte Chemie (International ed.in English) 2012 doi: 10.1002/anie.201108132. [DOI] [PMC free article] [PubMed] [Google Scholar]
- (11).Kupce E, Freeman R, John BK. J Am Chem Soc. 2006;128:9606–9607. doi: 10.1021/ja0634876. [DOI] [PubMed] [Google Scholar]
- (12).Pines A, Gibby MG, Waugh JS. J Chem Phys. 1973;59:569–590. [Google Scholar]
- (13).Lurie FM, Slichter CP. Phys Rev Lett. 1963;10:403. [Google Scholar]
- (14).Hartmann SR, Hahn EL. Phys Rev. 1962;128:2042. [Google Scholar]
- (15).Schaefer J, Stejskal EO. J Am Chem Soc. 1976;98:1031–1032. [Google Scholar]
- (16).Levitt MH, Suter D, Ernst RR. J Chem Phys. 1986;84:4243–4255. [Google Scholar]
- (17).Fukuchi M, Ramamoorthy A, Takegoshi K. J Magn Reson. 2009;196:105–109. doi: 10.1016/j.jmr.2008.10.013. [DOI] [PMC free article] [PubMed] [Google Scholar]
- (18).Kolodziejski W, Klinowski J. Chem Rev. 2002;102:613–628. doi: 10.1021/cr000060n. [DOI] [PubMed] [Google Scholar]
- (19).Hediger S, Meier BH, Ernst RR. Chem Phys Lett. 1993;213:627–635. [Google Scholar]
- (20).Hediger S, Meier BH, Ernst RR. Chem Phys Lett. 1995;240:449–456. [Google Scholar]
- (21).Nevzorov AA. J Magn Reson. 2011;209:161–166. doi: 10.1016/j.jmr.2011.01.006. [DOI] [PubMed] [Google Scholar]
- (22).Baldus M, Geurts DG, Hediger S, Meier BH. J Magn Reson Ser A. 1996;118:140–144. [Google Scholar]
- (23).Baldus M, Petkova AT, Herzfeld JH, Griffin RG. Mol Phys. 1998;95:1197–1207. [Google Scholar]
- (24).Metz G, Wu XL, Smith SO. J Magn Reson Ser A. 1994;110:219–227. [Google Scholar]
- (25).Schaefer J, McKay RA, Stejskal EO. J Magn Reson. 1979;34:443–447. [Google Scholar]
- (26).Zhang Z, Miao Y, Liu X, Yang J, Li C, Deng F, Fu R. J Magn Reson. 2012;217:92–99. doi: 10.1016/j.jmr.2012.02.020. [DOI] [PMC free article] [PubMed] [Google Scholar]
- (27).Nielsen AB, Straaso LA, Nieuwkoop AJ, Rienstra CM, Bjerring M, Nielsen NC. J Phys Chem Lett. 2010;1:1952–1956. doi: 10.1021/jz100564j. [DOI] [PMC free article] [PubMed] [Google Scholar]
- (28).Brinkmann A, Levitt MH. J Chem Phys. 2001;115:357–384. [Google Scholar]
- (29).Lee YK, Kurur ND, Helmle M, Johannessen OG, Nielsen NC, Levitt MH. Chem Phys Lett. 1995;242:304–309. [Google Scholar]
- (30).Bjerring M, Nielsen NC. Chem Phys Lett. 2003;370:496–503. [Google Scholar]
- (31).Kehlet C, Bjerring M, Sivertsen AC, Kristensen T, Enghild JJ, Glaser S, Khaneja N, Nielsen NC. J Magn Reson. 2007;188:216–230. doi: 10.1016/j.jmr.2007.06.011. [DOI] [PubMed] [Google Scholar]
- (32).Kehlet CT, Sivertsen AC, Bjerring M, Reiss TO, Khaneja N, Glaser SJ, Nielsen NC. J Am Chem Soc. 2004;126:10202–10203. doi: 10.1021/ja048786e. [DOI] [PubMed] [Google Scholar]
- (33).Gopinath T, Veglia G. J Am Chem Soc. 2009;131:5754–5756. doi: 10.1021/ja900096d. [DOI] [PMC free article] [PubMed] [Google Scholar]
- (34).Gopinath T, Verardi R, Traaseth NJ, Veglia G. J Phys Chem B. 2010;114:5089–5095. doi: 10.1021/jp909778a. [DOI] [PMC free article] [PubMed] [Google Scholar]
- (35).Lazar GA, Desjarlais JR, Handel TM. Protein Sci. 1997;6:1167–1178. doi: 10.1002/pro.5560060605. [DOI] [PMC free article] [PubMed] [Google Scholar]
- (36).Castellani F, van Rossum B, Diehl A, Schubert M, Rehbein K, Oschkinat H. Nature. 2002;420:98–102. doi: 10.1038/nature01070. [DOI] [PubMed] [Google Scholar]
- (37).LeMaster DM, Kushlan DM. J Am Chem Soc. 1996;118:9255–9264. [Google Scholar]
- (38).Igumenova TI, Wand AJ, McDermott AE. J Am Chem Soc. 2004;126:5323–5331. doi: 10.1021/ja030546w. [DOI] [PubMed] [Google Scholar]
- (39).Franks WT, Kloepper KD, Wylie BJ, Rienstra CM. J Biomolec NMR. 2007;39:107–131. doi: 10.1007/s10858-007-9179-1. [DOI] [PubMed] [Google Scholar]
- (40).Takegoshi K, Nakamura S, Terao T. Chem Phys Lett. 2001;344:631–637. [Google Scholar]
- (41).Loening NM, Bjerring M, Nielsen NC, Oschkinat H. J Magn Reson. 2012;214:81–90. doi: 10.1016/j.jmr.2011.10.012. [DOI] [PMC free article] [PubMed] [Google Scholar]
- (42).Seidel K, Etzkorn M, Heise H, Becker S, Baldus M. Chembiochem. 2005;6:1638–1647. doi: 10.1002/cbic.200500085. [DOI] [PubMed] [Google Scholar]
- (43).Schubert M, Manolikas T, Rogowski M, Meier BH. J Biomolec NMR. 2006;35:167–173. doi: 10.1007/s10858-006-9025-x. [DOI] [PubMed] [Google Scholar]
- (44).Igumenova TI, McDermott AE, Zilm KW, Martin RW, Paulson EK, Wand AJ. J Am Chem Soc. 2004;126:6720–6727. doi: 10.1021/ja030547o. [DOI] [PubMed] [Google Scholar]
- (45).Hong M, Jakes K. J Biomolec NMR. 1999;14:71–74. doi: 10.1023/a:1008334930603. [DOI] [PubMed] [Google Scholar]
- (46).Lian LY, Middleton DA. Prog Nucl Magn Reson Spectrosc. 2001;39:171–190. [Google Scholar]
- (47).Vuister GW, Kim SJ, Wu C, Bax A. J Am Chem Soc. 1994;116:9206–9210. [Google Scholar]
- (48).Higman VA, Flinders J, Hiller M, Jehle S, Markovic S, Fiedler S, van Rossum BJ, Oschkinat H. J Biomolec NMR. 2009;44:245–260. doi: 10.1007/s10858-009-9338-7. [DOI] [PubMed] [Google Scholar]
- (49).Shi L, Ahmed MA, Zhang W, Whited G, Brown LS, Ladizhansky V. J Mol Biol. 2009;386:1078–1093. doi: 10.1016/j.jmb.2009.01.011. [DOI] [PubMed] [Google Scholar]
- (50).Yang J, Tasayco ML, Polenova T. J Am Chem Soc. 2008;130:5798–5807. doi: 10.1021/ja711304e. [DOI] [PubMed] [Google Scholar]
- (51).Li S, Su Y, Luo W, Hong M. J Phys Chem B. 2010;114:4063–4069. doi: 10.1021/jp912283r. [DOI] [PMC free article] [PubMed] [Google Scholar]
- (52).Traaseth NJ, Veglia G. J Magn Reson. 2011;211:18–24. doi: 10.1016/j.jmr.2011.03.013. [DOI] [PMC free article] [PubMed] [Google Scholar]
- (53).Yang J, Parkanzky PD, Bodner ML, Duskin CA, Weliky DP. J Magn Reson. 2002;159:101–110. doi: 10.1016/s1090-7807(02)00033-2. [DOI] [PubMed] [Google Scholar]
- (54).Sperling LJ, Berthold DA, Jeisy Sasser TL, Scott V, Rienstra CM. J Mol Biol. 2010;399:268–282. doi: 10.1016/j.jmb.2010.04.012. [DOI] [PMC free article] [PubMed] [Google Scholar]
- (55).Lopez JJ, Kaiser C, Asami S, Glaubitz C. J Am Chem Soc. 2009;131:15970–15971. doi: 10.1021/ja904963n. [DOI] [PubMed] [Google Scholar]
- (56).Wickramasinghe NP, Shaibat M, Ishii Y. J Am Chem Soc. 2005;127:5796–5797. doi: 10.1021/ja042188i. [DOI] [PubMed] [Google Scholar]
- (57).Nadaud PS, Helmus JJ, Kall SL, Jaroniec CP. J Am Chem Soc. 2009;131:8108–8120. doi: 10.1021/ja900224z. [DOI] [PubMed] [Google Scholar]
- (58).Yamamoto K, Xu J, Kawulka KE, Vederas JC, Ramamoorthy A. J Am Chem Soc. 2010;132:6929–6931. doi: 10.1021/ja102103n. [DOI] [PMC free article] [PubMed] [Google Scholar]
- (59).Tang W, Nevzorov AA. J Magn Reson. 2011;212:245–248. doi: 10.1016/j.jmr.2011.06.028. [DOI] [PubMed] [Google Scholar]
- (60).Wu XL, Zhang SM, Wu XW. Phys Rev B. 1988;37:9827–9829. [Google Scholar]
- (61).Agarwal V, Fink U, Schuldiner S, Reif B. Biochim Biophys Acta. 2007;1768:3036–3043. doi: 10.1016/j.bbamem.2007.09.012. [DOI] [PubMed] [Google Scholar]
- (62).Ward ME, Shi L, Lake E, Krishnamurthy S, Hutchins H, Brown LS, Ladizhansky V. J Am Chem Soc. 2011;133:17434–17443. doi: 10.1021/ja207137h. [DOI] [PubMed] [Google Scholar]
- (63).Li Y, Berthold DA, Frericks HL, Gennis RB, Rienstra CM. Chembiochem. 2007;8:434–442. doi: 10.1002/cbic.200600484. [DOI] [PubMed] [Google Scholar]
- (64).Shi L, Kawamura I, Jung KH, Brown LS, Ladizhansky V. Angew Chem Int Ed Engl. 2011;50:1302–1305. doi: 10.1002/anie.201004422. [DOI] [PubMed] [Google Scholar]
- (65).Mittag T, Kay LE, Forman Kay JD. J Molec Recog. 2010;23:105–116. doi: 10.1002/jmr.961. [DOI] [PubMed] [Google Scholar]
- (66).Gustavsson M, Traaseth NJ, Karim CB, Lockamy EL, Thomas DD, Veglia G. J Mol Biol. 2011;408:755–765. doi: 10.1016/j.jmb.2011.03.015. [DOI] [PMC free article] [PubMed] [Google Scholar]
- (67).Gustavsson M, Traaseth NJ, Veglia G. Biochim Biophys Acta. 2012;1818:146–153. doi: 10.1016/j.bbamem.2011.07.040. [DOI] [PMC free article] [PubMed] [Google Scholar]
- (68).Hong M, Zhang Y, Hu F. Annu Rev Phys Chem. 2011 doi: 10.1146/annurev-physchem-032511-143731. [DOI] [PMC free article] [PubMed] [Google Scholar]
- (69).Su Y, Hong M. J Phys Chem B. 2011;115:10758–10767. doi: 10.1021/jp205002n. [DOI] [PMC free article] [PubMed] [Google Scholar]
- (70).Chevelkov V, Faelber K, Schrey A, Rehbein K, Diehl A, Reif B. J Am Chem Soc. 2007;129:10195–10200. doi: 10.1021/ja072024c. [DOI] [PubMed] [Google Scholar]
- (71).Schanda P, Meier BH, Ernst M. J Am Chem Soc. 2010;132:15957–15967. doi: 10.1021/ja100726a. [DOI] [PubMed] [Google Scholar]
- (72).Gopinath T, Veglia G. J Magn Reson. 2012 doi: 10.1016/j.jmr.2012.04.006. in press. [DOI] [PMC free article] [PubMed] [Google Scholar]
- (73).Maly T, Debelouchina GT, Bajaj VS, Hu KN, Joo CG, Mak Jurkauskas ML, Sirigiri JR, van der Wel PC, Herzfeld J, Temkin RJ. J Chem Phys. 2008;128:052211. doi: 10.1063/1.2833582. [DOI] [PMC free article] [PubMed] [Google Scholar]
- (74).Evans JNS, Appleyard RJ, Shuttleworth WA. J Am Chem Soc. 1993;115:1588–1590. [Google Scholar]
- (75).Hu KN, Yau WM, Tycko R. J Am Chem Soc. 2010;132:24–25. doi: 10.1021/ja908471n. [DOI] [PMC free article] [PubMed] [Google Scholar]
- (76).Comellas G, Lemkau LR, Zhou DH, George JM, Rienstra CM. J Am Chem Soc. 2012;134:5090–5099. doi: 10.1021/ja209019s. [DOI] [PMC free article] [PubMed] [Google Scholar]


