Abstract
Mechanical properties of cells have been shown to have a significant role in disease as in many instances cell stiffness changes when a cell is no longer healthy. We present a high throughput microfluidics based approach that exploits the connection between travel time of a cell through a narrow passage and cell stiffness. The system resolves both cell travel time and relative cell diameter while retaining information on the cell level. We show that stiffer cells have longer transit times than less stiff ones and that cell size significantly influences travel times. Experiments with untreated HeLa cells and cells made compliant with Latrunculin A and Cytochalasin B further demonstrate that travel time is influenced by cell stiffness, with the compliant cells having faster transit time.
Keywords: Cell mechanics, microfluidics, cell deformability
Introduction
Mechanical properties of living cells have been shown to play a role in a number of physiological and pathological processes.1 Specifically, cells often change their stiffness in disease states including infectious diseases and cancer. For instance, red blood cells of patients with malaria have increased stiffness,2 human epithelial pancreatic cancer cells have reduced elastic stiffness3 and cancerous human bladder epithelial cells are one order of magnitude more deformable than healthy ones.4 A comprehensive review of the literature on this topic with specific attention to cancer has been recently published.5
Mechanical characteristics of living cells can be probed with techniques that have either very low throughput or very low accuracy.6 Among the most accurate methods to measure cell mechanical parameters is atomic force microscopy (AFM) in which the tip of an atomic force microscope is used to indent the cell membrane and measure its mechanical response. The technique is very accurate and provides quantitative data. However AFM measurements have extremely low throughput and require very skilled operators.7 Another popular and elegant method to measure cell mechanical properties is optical tweezers,8 a system that allows applying tensile loads to single cells. This system shares the same advantages and disadvantages of AFM. Similar to optical tweezers but without the need for “handles” is the optical stretcher method.9,10. A third quantitative technique for evaluation of cellular mechanical properties is micropipette aspiration.11 In this technique, a cell is aspirated into a micropipette using a negative pressure. Displacements of the cell membrane are recorded to infer cell mechanical properties. This approach provides fairly accurate results with higher throughput than the two previously mentioned techniques, but it is still very slow, with throughput in the order of a few cells/hour at most. A few approaches for the quick non-quantitative evaluation of cellular mechanical properties have been developed. Among them, filtration of cell suspensions through micropores has been used to evaluate the overall ability of a cell population to deform enough to go through the filter.12 In more sophisticated systems, flowing of cells at a specified pressure through a microfluidic device with defined channels has been optimized to either filter out and identify subpopulation of stiffer cells.13 Alternatively, image analysis of transit times through artificial microcapillaries has yielded information about cell deformability.14 These approaches provide increased throughput, but generally do not take into account the cell diameter. Recently, microfluidic systems in which cells flow through microfabricated channels with known compliance for the purpose of assessing cell deformability have been implemented with optical analysis tools to enable further characterization of the cells of interest.15 These systems have particularly been optimized for red blood cells that have very similar cell diameters. In addition, a deformability based cell classification device that uses inertial microfluidics has been proposed16, this system offers an interesting and promising approach but currently the separation confounds the roles of cell deformability and diameter.
Herein we describe a microfluidic chip for semi-quantitative high throughput (up to 800 cells/min) probing of cellular mechanical properties of a cell population. This system is based on the observation that, for a given diameter, the travel time of an object through a funnel with diameter smaller than the characteristic diameter of the object is influenced by the stiffness of the object of interest. Applying this to cells, we design a system in which cells are flown through microfluidic channels with an appropriately designed funnel shaped narrowing. Utilizing that at low frequencies cells behave as dielectrics, we generate an electric field across the microchannel constriction and investigate the transit time of cells through the constriction measuring the interaction of the cell with the electric field. Importantly, the electric signature recorded at the passage of each cell also provides information about the diameter of the cell and therefore enables correlation between cell size and cell transit time. After characterization of the device, we show that cell transit time depends on both cell deformability and cell diameter.
Microfluidic system
Device concept
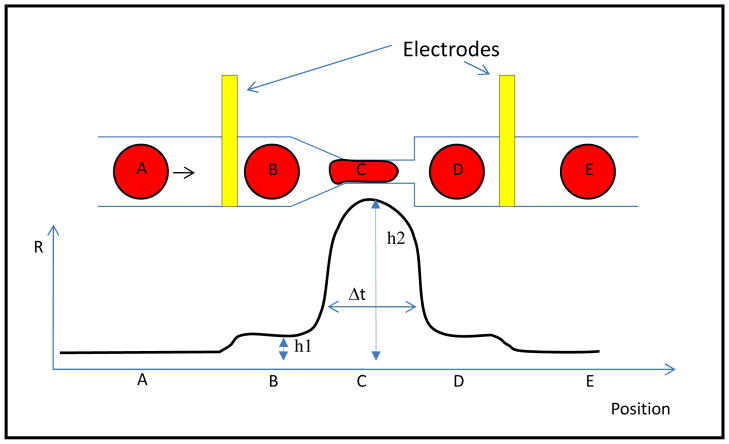
Figure 1 shows a schematic representation of the microfluidic concept. As a cell travels through a constriction, the electrical resistance between two electrodes placed on either side of the constriction changes. A small increase in resistance from baseline to a value “h1” would be expected as the cell passes in front of the first electrode. The electrical resistance subsequently reaches a peak value “h2” as the cell engages the constriction and then returns to h1 before coming back to the original baseline once the cell is beyond the second electrode. Variations in the electrical signal capture cell travel time through the narrowing (Δt), and for a given diameter, the travelling time of the cell through the narrowing is expected to be dependent on cell mechanical properties.
Figure 1.
Microfluidic concept for measuring cell deformability. Suspended cells travel through a microfluidic channel that presents a funnel shaped constriction. The electrical resistance across two electrodes placed on either side of the constriction is measured upon passage of the cell. This resistance is expected to increase from baseline (position A) to a value “h1” when the cell is in-between the two electrodes, but not yet in the constriction, (position B). The resistance subsequently peaks at a value “h2” when the cell is fully engaged in the constriction (position C) and then returns to the h1 value when the cell is between the narrowing and the downstream electrode (position D). Finally, the resistance goes back to the baseline value once the cell is beyond the downstream electrode (position E). The width of the signal (Δt) measures the time that the cell needs to travel through the constriction.
Device design and fabrication
We decided to test the device concept with Hela cells and human primary fibroblast that have diameters of 10–15 μm. We therefore designed a microfluidic channel with width of about ~15 μm, and a funnel shaped constriction with narrowest section of about 7 μm. The microchannel had a constant depth of ~15 μm. Since cells of different sizes are forced through the same constriction, they experience a different deformation depending on their original diameter. The gap size needs to be small enough to challenge the transit of most cells so that their deformability can be probed, but also large enough to minimize clogging of the chip by cells. We tested constrictions of 7 μm and 5 μm, the latter was very difficult to operate with the selected cell types. With the narrow constriction only a few cells would pass through before the device clogged. The length of the narrow section also has been selected as a compromise between different factors. A longer channel makes the travel time longer amplifying the differences between cells and making the system more sensitive. On the other hand a longer channel increases the electrical resistance between the electrodes making the relative variation of resistance due to the cell presence smaller and hence more difficult to detect and prone to noise. In addition, a longer channel increases the chances of having more than one cell in the detection area at the same time.
The sensing electrodes are positioned outside the constriction area in order to achieve uniformity of the electric field near the electrodes and minimize possible variations between chips due to differences in electrode to constriction alignment. On the upstream side, a funnel shape channel facilitates the cell passage. On the downstream end, where clogging issues are less, there is a sharper variation of the channel width so to decrease the distance between the downstream and upstream electrode and reduce the baseline resistance.
Microfluidic chips were fabricated with deep reactive ion etching (DRIE) of silicon wafers. The silicon was insulated electrically with a 0.3 μm thick thermally grown silicon oxide. Finally, the silicon wafer was anodically bonded to a borofloat glass wafer upon which gold electrodes had been deposited with electron beam deposition and patterned by lift off (Fig. 2A, 2C). The electrodes were positioned one upstream and one downstream of the funnel shaped constriction in order to be able to generate an electric field across the opening and measure changes in the voltage between the electrodes with the passage of cells. The assembly was completed by addition of machined compression packaging parts, aluminum and high density pole ethylene (HDPE) (Fig. 2B).
Figure 2.
Microfluidic device and its packaging for measuring cell deformability. Frame A shows the microfluidic device made of silicon and bonded to a borofloat glass. Gold electrodes deposited onto the borofloat glass are apparent. Frame B shows the device packaged with compression parts (Aluminum and HDPE) to provide a cell reservoir and easily accessible electrical connections. Frame C shows a close up view of the channel constriction with the electrodes; flow is from right to left (20X magnification).
Sensing area electrical model
The model of Foster and Schwan17 is usually used for the analysis of the electrical behavior of a cell in a suspension. In this model, the cell is approximated as a resistor, Ri, describing the cytoplasm, in series with a capacitor, Cmem, representing the cell membrane. To complete the model, the electrical equivalent of the cell is in parallel with the medium resistance, Rm, and medium capacitance, Cm. In order to include the interface between the electrodes and the suspension medium, the capacitance of the electric double layer, CDL, also needs to be added. Modeling of the sensing area (see supporting information for the full model) shows that for frequencies below the Maxwell-Wagner dispersion (0.6–1.1 MHz), a cell can be regarded as an insulator and sizing can then be accomplished in line with previous studies.18,19,20,21
Working at frequencies around 100kHz (lower than the Maxwell-Wagner dispersion) would provide a measurement with good sensitivity because the role of the double layer capacitance becomes negligible and cell size information is retained. The present device was fabricated in silicon as it provided the advantage of established techniques for the fabrication of the small funnel shape in the channel with tight tolerances, but its electrical properties forced us to run the circuitry at frequencies below 100 KHz to minimize the influence of the silicon. We ran experiments at 20 KHz as a compromise among time resolution, limited loss in the silicon and reasonable impedance increase due to the double layer capacitance. At 20kHz a cell of radius 4 μm would theoretically give an impedance change ΔZ/Z of about 1% whereas cell with radius of 7 μm would give a variation of about 5%. Foster–Schwartz theory predicts that the impedance variation scales linearly with the cell volume.
The device was connected in series with an external resistor (200 kOhm) and this series was powered by a function generator with a voltage output such that the applied voltage across the chip is about 1V in amplitude. The voltage drop across the chip was amplified 10 times and recorded with a data acquisition card sampling at 200kHz. Custom software was written to compute the root mean square (RMS) value of the recorded AC signal and then extract for each cell the values of h1, h2 and travel time. Travel time was determined as the width of the signal at 30% of the peak height. We verified that other definitions of travel time (for instance signal width at 50% or 70 % of peak height) gave comparable results. The software excluded doublets of cells or incomplete signals from the analysis.
Flow of the cell suspension through the device was driven by a constant and externally controlled pressure. We tested pressures in the 1–10 psi range, with lower pressures providing a modest throughput and higher pressures giving signals with reduced time resolution of cell passage (typical travel time at 8 psi was ~0.3 ms). The reported experiments were run at 4 psi providing a throughput of ~200–800 cell/min. The cell throughput was closer to the upper bound at the beginning of the experiment and decreasing over time because of cell sedimentation in the supply reservoir (no changes in the flow rate were observed).
Results and discussion
System Characterization
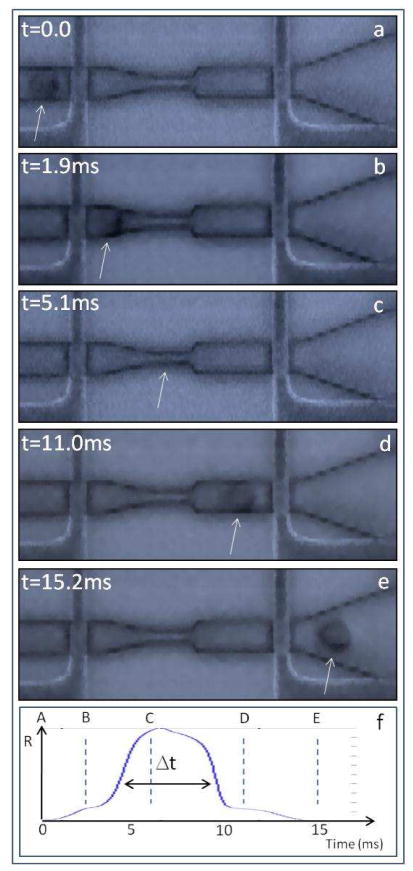
We first verified the device concept (Fig. 1) by high speed imaging synchronized with oscilloscope recordings. The measurements (Fig. 3) confirmed the expected interaction between cells flowing through the chip and the electrical signal measured between the two microfabricated electrodes, and showed that the electrical signature of cells flowing through the chip corresponded to the cell travelling time, Δt, through the narrowing. Moreover, these measurements confirmed that the cell electrical signature is characterized by a peak height h2 and by a flat area of increased resistance h1.
Figure 3.
Variations in the electrical signal at the passage of a cell. Frames extracted from a high speed movie of a cell passing through the microfluidic chip (movie in supplementary information). Fluid flows from left to right. A cell approaches the upstream electrode (frame a), it passes between the upstream electrode and the funnel shaped constriction (frame b), it changes shape to go through the narrowing (frame c), it enters the space between the funnel shaped narrowing and the downstream electrode (frame d) and finally it arrives downstream of the downstream electrode (frame e). The white arrow marks the position of the cell. Frame f represents the signal recorded from the electrodes during the passage of the cell. The blue dotted vertical lines on the signal identify the time of acquisition of images a to e. Importantly, the electrical signal varies as expected and shown schematically in Fig. 1. Analysis of the correspondence between the high speed imaging and the recorded electrical signal shows that Δt measures the cell transit time through the channel.
As suggested by the aforementioned Foster Shawn theory and by analogy with the Coulter principle22, the height h1 is proportional to the cube of the cell diameter. Thus for each cell passing the device, it is possible to measure the cell travel time through the constriction and to infer the relative cell diameter. Conversion of h1 values to the actual diameter size would require calibration with deformable particles of known diameters.
In order to characterize the system, we started with HeLa cells suspended in PBS + 3% serum + 1% Pluronics after 10 minutes exposure to trypsin at a concentration of 106 cell/ml. We observed that concentrations up to about 1.8–2×10⁶cell/ml could be used in the device without a significant increase in cells sticking and excessive amounts of doublets. Low cell concentrations (~105cell/ml) could be handled without problems.
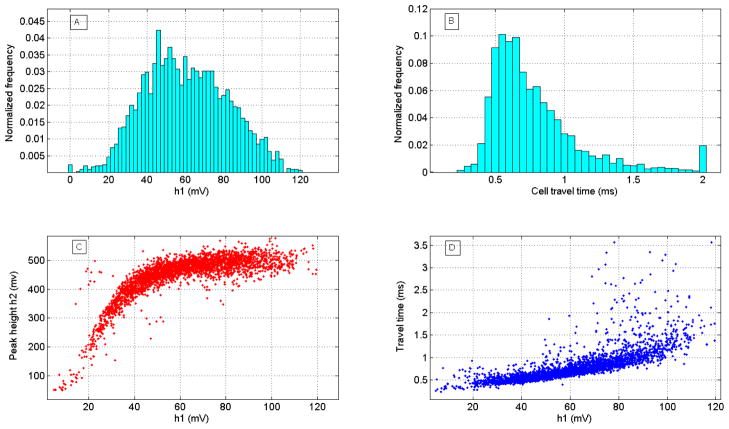
Fig. 4 shows typical results collected during an experiment. The height of the signal of the flat area h1 appears to have a bell shaped symmetrical distribution (Fig. 4A). The distribution typical of cell travel time is non-symmetric with a long tail on the side of longer travel times (Figure 4B). In each experiment there are a few cells that have a very large travel time (even larger than 50 times the most frequent value of the population). This lack of symmetry of the distribution has been previously reported for white blood cells.14 The relationship between signal peak height (h2) vs. h1 is nearly linear for low values of h1 and then becomes independent of h1 (Fig. 4C). Since h1 depends on cell diameter, this behavior can be interpreted in terms of cell not completely spanning the channel width for small diameters. As the cell diameter increases the cell obstruct more of the channel creating and increasing barrier to electric current. After a certain threshold of diameter (in this graph the threshold is h1= ~50 mV), the constriction is essentially filled by the cell and values of peak height h2 become independent of h1. Fig. 4D shows a typical relationship between cell travel time and cell diameter as reflected by h1. For a given h1, there is a minimum travel time and this minimum value increases with increasing values of h1. When h1 exceeds ~50mV, the spread of the travel time increases, presumably because at higher values of h1 cells are fully engaged by the channel constriction and the system becomes more sensitive to variations in cell deformability.
Figure 4.
Results of flowing HeLa cells through the device with a driving pressure of 4 psi. a) Histogram of the value of the flat area of the signal h1. h1 appears to have a symmetric bell shaped distribution as expected for a measurement of cell size in cultured cells. The bar at 0 mv represents the fraction of cells for which the software did not succeed to retrieve h1. B) Histogram of cell travel time through the funnel shaped constriction. Travel time has a non-symmetric distribution with a long tail at higher transversal times. The most frequent value (mode) is 0.58 ms. The bar at 2ms represents all the cells with travel time higher than 2 ms. C) Relationship between peak height h2 and value of flat area h1. h2 (maximum resistance observed at the passage of the cell) depends linearly on h1 (cell size) for low values of h1 but saturates around h1=~50mV. D) Relationship between cell travel time Δt and value of h1. The scattering of travel time values increases for values of h1 larger than ~50mV.
Cell travel time depends on cell diameter
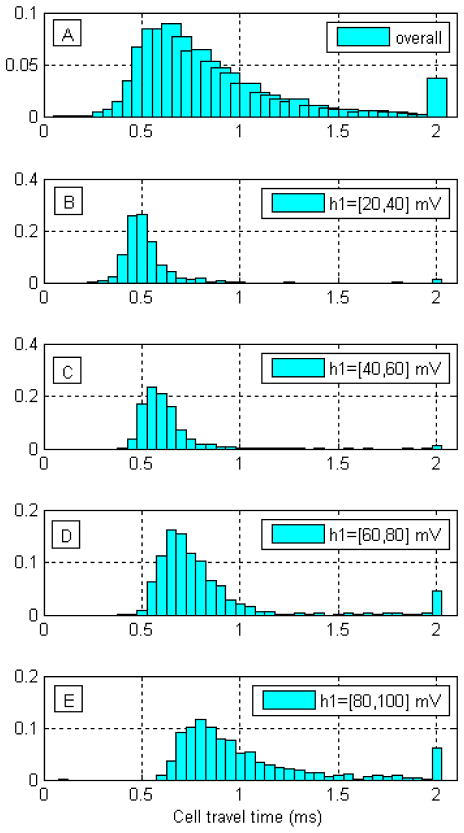
Histograms of cell travel times for specific values of h1 (Figs. 5B–E) confirm the hypothesis that travel time through the channel depends on cell diameter. The typical non-symmetric behavior of the distribution is maintained for each assigned interval of h1 values, and cells with larger diameter (increasing h1) have higher travel times. Also, for larger diameters the travel time distribution broadens. All the described experiments were repeated several times (>5) with results similar to those reported. In each experiment, we analyzed a few thousand cells. Moreover, the experiments were repeated on human primary fibroblasts (see supplemental materials, Fig. S4 and Fig. S5).
Fig. 5.
Cell travel time through the microchannel narrowing depends on cell diameter. A) Histogram of cell transit time measured on ~3000 HeLa cells. Transit time has a non-symmetric, wide distribution. B to E) Histograms of cell travel times for classes of cells with different diameters, as reflected by h1. B) h1 values 20–40 mv. C) h1 values 40–60 mV. D) h1 values 60 to 80 mV. E) h1 values 80–100 mv (largest cells). Cell transit time is significantly influenced by diameter with larger cells showing longer transit times than smaller cells. All cells with travel times > 2ms are pooled in the 2ms bar
Cell travel time depends on cell stiffness
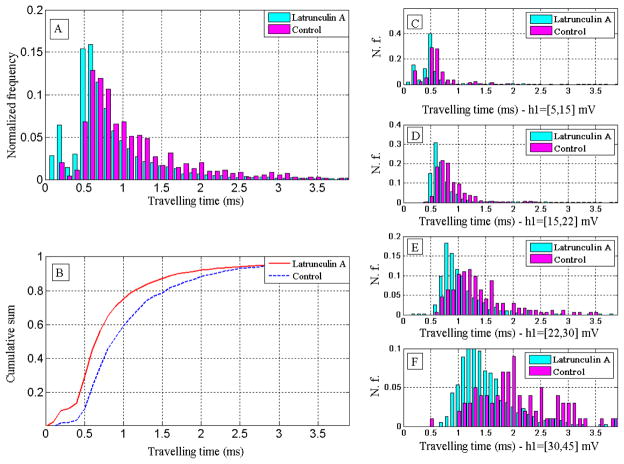
In order to test our hypothesis that travel time is influenced by cell stiffness, we made HeLa cells more compliant with Latrunculin A (Invitrogen). Latrunculin A is a toxin known to disrupt actin filaments thus reducing the elastic modulus of cells.23 After detaching cells from the culture dish with trypsin, the cell population was divided into two samples. We exposed one to Latrunculin A (in DMSO) 0.1 μM for 60 min and the other to just DMSO. In order to assure consistency of results and avoid possible variation among devices, the samples were flown through the same device with a wash step in between. Fig. 6A shows a typical distribution of travel times between Latrunculin A-treated and untreated samples. As expected, the stiffer population (the untreated portion) shows a travel time distribution shifted to the right. Also, less broadening of the travel time distributions is observed. The difference in travel time between treated and untreated cells is reflected by the cumulative sum of cell transit times (Fig. 6B). In “compliant cells” (exposed to Latrunculin A) the travel time of the 50th percentile is 0.64 ms while it is 0.86 ms in the controls. Fig. 6C–D–E–F show the travel time histograms of treated and untreated cells with different diameters as inferred from h1 (increasing diameter from top to bottom of figure). Treated cells flow faster than the control, and the difference is more pronounced for larger diameters. As expected, smaller cells travel faster than larger ones both in the treated sample and in the control. In order to rule out potential drug specific effects of Latrunculin A, we repeated the experiment described in Fig. 6 with another actin disruptive chemical, Cytochalasin B (20μM for 30 min) (Sigma Aldrich) and obtained similar results (see supporting information, Fig. S6).
Figure 6.
Cell travel time through the microchannel narrowing depends on cell deformability. HeLa cells were treated with Latrunculin A (0.1μM for 1h) to interfere with actin polymerization and reduce cell stiffness. A: Histogram of the travel time of treated sample and the control (samples are taken from the same original population and passed through the same device). B: cumulative sums of the travel time histograms for both treated and control sample. The travel time of the treated sample is shorter than the control for any percentile. C–F: histograms of travel time of treated and control sample for different values of cell diameter reflected by ranges of the signal flat area parameter h1 [in brackets]. For each range of cell diameter the treated sample has a shorter travel time than the control, the difference is more prominent for larger diameters.
As a cell travels through a constriction we expect friction to play a role as a deformed cell exerts a force normal to the channel walls and the higher this force, the higher the friction.24 The magnitude of this force normal to the channel wall depends on the deformability of the cell as a more deformable cell needs less force to be deformed, and a stiffer one needs more force (if the cell was not deformed it simply could not travel through the small channel). The higher the normal force, the higher the friction force that slows down the cell, thus stiffer cells have a longer travel time. While it is difficult to measure the friction between the channel wall and the cell membrane, for consistency it is important that the value of friction factor remains constant during an experiment. To that purpose, we added to the phosphate buffered saline, 3 % of bovine serum and 1% Pluronic. The serum is known to reduce cell stickiness and the Pluronics is known to have a lubricating action. We observe neither buildup of material at the constriction nor change of results over time thus suggesting that friction conditions can be regarded as constant during the experiment. In the future, the role of friction would need further characterization in order to compare results from different cell lines. Such a characterization would require comparison of mechanical property data for specific cell lines obtained by alternative techniques, such as those discussed in the introduction.
Conclusion and future outlook
In summary, we have demonstrated a microfluidics based approach to probe deformability of single cells with up to 800 cells/min. The analysis shows that cell travel time through a funnel shaped constriction has a non-Gaussian distribution. More importantly, we show that cells with different diameters have different travel times and that, for a given diameter, stiffer cells have longer transit times than less stiff ones.
The described system enhances significantly the throughput of current methodologies for probing of cell deformability, maintains single cell resolution and provides semi-quantitative results. The analysis throughput achieved could be already sufficient to analyze the amount of cells contained in a typical clinical biopsy in a few minutes. Thus, the system could be used to as a screening/diagnostic tool to explore connections between certain diseases and cell stiffness. However, in order to be suitable for clinical applications the system would need to be calibrated to create a scale that allowed translation of cell travel times and heights of the flat area h1 respectively in absolute values of cell stiffness and cell diameter. Furthermore, the chip could be integrated with other cell analysis systems (e.g., FACS) to enable discrimination of different cells types.
Supplementary Material
Acknowledgments
We would like to thank Prof. Krystyn Van Vliet, for commenting on the manuscript. This research was supported in part by NIH (RC1 EB011187-02).
Footnotes
Supporting Information Available
Details about the electrical model and additional experimental data are given in the Supporting Information. This information is available free of charge via the Internet at http://pubs.acs.org/.
References
- 1.Ingber DE. Ann Med. 2003;35:564. doi: 10.1080/07853890310016333. [DOI] [PubMed] [Google Scholar]
- 2.Suresh S, Spatz J, Mills JP, Micoulet A, Dao M, Lim CT, Beil M, Seufferlein T. Acta Biomater. 2005;1:15. doi: 10.1016/j.actbio.2004.09.001. [DOI] [PubMed] [Google Scholar]
- 3.Beil M, Micoulet A, von Wichert G, Paschke S, Walther P, Omary MB, Van Veldhoven PP, Gern U, Wolff-Hieber E, Eggermann J, Waltenberger J, Adler G, Spatz J, Seufferlein T. Nat Cell Biol. 2003;5:803. doi: 10.1038/ncb1037. [DOI] [PubMed] [Google Scholar]
- 4.Lekka M, Laidler P, Gil D, Lekki J, Stachura Z, Hrynkiewicz AZ. Eur Biophys J. 1999;28:312. doi: 10.1007/s002490050213. [DOI] [PubMed] [Google Scholar]
- 5.Suresh S. Acta Biomater. 2007;3:413. doi: 10.1016/j.actbio.2007.04.002. [DOI] [PMC free article] [PubMed] [Google Scholar]
- 6.Bao G, Suresh S. Nat Mater. 2003;2:715. doi: 10.1038/nmat1001. [DOI] [PubMed] [Google Scholar]
- 7.Kirmizis D, Logothetidis S. Int J Nanomedicine. 2010;5:137. doi: 10.2147/ijn.s5787. [DOI] [PMC free article] [PubMed] [Google Scholar]
- 8.Mills JP, Qie L, Dao M, Lim CT, Suresh S. Mech Chem Biosyst. 2004;1:169. [PubMed] [Google Scholar]
- 9.Van Vliet KJ, Bao G, Suresh S. Acta materialia. 2003;51:5881. [Google Scholar]
- 10.Guck J, Schinkinger S, Lincoln B, Wottawah F, Ebert S, Romeyke M, Lenz D, Erickson HM, Ananthakrishnan R, Mitchell D, Kas J, Ulvick S, Bilby C. Biophys J. 2005;88:3689. doi: 10.1529/biophysj.104.045476. [DOI] [PMC free article] [PubMed] [Google Scholar]
- 11.Hochmuth RM. J Biomech. 2000;33:15. doi: 10.1016/s0021-9290(99)00175-x. [DOI] [PubMed] [Google Scholar]
- 12.Moessmer G, Meiselman HJ. Biorheology. 1990;27:829. doi: 10.3233/bir-1990-27604. [DOI] [PubMed] [Google Scholar]
- 13.Shelby JP, White J, Ganesan K, Rathod PK, Chiu DT. Proc Natl Acad Sci U S A. 2003;100:14618. doi: 10.1073/pnas.2433968100. [DOI] [PMC free article] [PubMed] [Google Scholar]
- 14.Rosenbluth MJ, Lam WA, Fletcher DA. Lab Chip. 2008;8:1062. doi: 10.1039/b802931h. [DOI] [PMC free article] [PubMed] [Google Scholar]
- 15.Bow H, Pivkin IV, Diez-Silva M, Goldfless SJ, Dao M, Niles JC, Suresh S, Han J. Lab Chip. 2011;11:1065. doi: 10.1039/c0lc00472c. [DOI] [PMC free article] [PubMed] [Google Scholar]
- 16.Hur SC, Henderson-MacLennan NK, McCabe ERB, Carlo DD. Lab Chip. 2011;11 doi: 10.1039/c0lc00595a. [DOI] [PubMed] [Google Scholar]
- 17.(a) Foster KR, Schwan HP. Crit Rev Biomed Eng. 1989;17:25. [PubMed] [Google Scholar]; (b) Sun T, Morgan H. Microfluidics and Nanofluidics. 2010;8:423. doi: 10.1007/s10404-009-0534-2. [DOI] [PMC free article] [PubMed] [Google Scholar]
- 18.Gawad S, Schild L, Renaud PH. Lab Chip. 2001;1:76. doi: 10.1039/b103933b. [DOI] [PubMed] [Google Scholar]
- 19.Gawad S, Cheung K, Seger U, Bertsch A, Renaud P. Lab Chip. 2004;4:241. doi: 10.1039/b313761a. [DOI] [PubMed] [Google Scholar]
- 20.Malleo D, Nevill JT, Lee LP, Morgan H. Microfluid Nanofluidics. 2010;9:191. doi: 10.1007/s10404-009-0534-2. [DOI] [PMC free article] [PubMed] [Google Scholar]
- 21.Valero A, Braschler T, Renaud P. Lab Chip. 2010;10:2216. doi: 10.1039/c003982a. [DOI] [PubMed] [Google Scholar]
- 22.Coulter WH. Proc Natl El Conf. 1956;12:1034. [Google Scholar]
- 23.Rotsch C, Radmacher M. Biophys J. 2000;78:520. doi: 10.1016/S0006-3495(00)76614-8. [DOI] [PMC free article] [PubMed] [Google Scholar]
- 24.Hou HW, Li QS, Lee GY, Kumar AP, Ong CN, Lim CT. Biomed Microdevices. 2009;11:557. doi: 10.1007/s10544-008-9262-8. [DOI] [PubMed] [Google Scholar]
Associated Data
This section collects any data citations, data availability statements, or supplementary materials included in this article.


