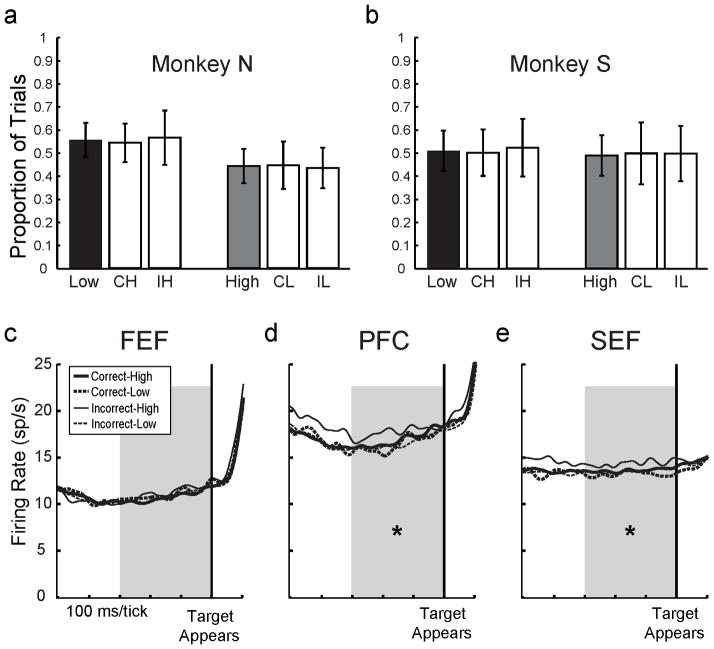
Figure 6.
Inter-trial effects. (a and b) Rate of placing bets as a function of previous trial outcome for each monkey. In each graph, the average low bet rate (black bar) is plotted next to low rates after previous CH and IH trials (white bars), and the average high bet rate (grey bar) is plotted next to high rates after previous CL and IL trials (white bars). Error bars are standard deviations. None of the “switch” rates were different from the respective average bet rates (paired t-tests, p > .05). (c–e) Neuronal activity during baseline period (shaded) as a function of previous trial outcome for the populations of FEF, PFC, and SEF neurons. Asterisks indicate whether IH activity was greater than all three of the other trial outcomes by paired t-tests (p < .05).

