Abstract
The feasibility of using ultrasound technology as a noninvasive, nondestructive method for evaluating the mechanical properties of engineered weight-bearing tissues was evaluated. A fixture was designed to accurately and reproducibly position the ultrasound transducer normal to the test sample surface. Agarose hydrogels were used as phantoms for cartilage to explore the feasibility of establishing correlations between ultrasound measurements and commonly used mechanical tissue assessments. The hydrogels were fabricated in 1–10% concentrations with a 2–10 mm thickness. For each concentration and thickness, six samples were created, for a total of 216 gel samples. Speed of sound was determined from the time difference between peak reflections and the known height of each sample. Modulus was computed from the speed of sound using elastic and poroelastic models. All ultrasonic measurements were made using a 15 MHz ultrasound transducer. The elastic modulus was also determined for each sample from a mechanical unconfined compression test. Analytical comparison and statistical analysis of ultrasound and mechanical testing data was carried out. A correlation between estimates of compressive modulus from ultrasonic and mechanical measurements was found, but the correlation depended on the model used to estimate the modulus from ultrasonic measurements. A stronger correlation with mechanical measurements was found using the poroelastic rather than the elastic model. Results from this preliminary testing will be used to guide further studies of native and engineered cartilage.
Keywords: Ultrasound, hydrogels, modulus, mechanical properties
INTRODUCTION
Diseases of cartilage are one of the major health issues in industrialized countries with high life expectancies. Currently, over 40 million people in the United States suffer from arthritis, which is 15% of the overall population.40 That number is expected to rise to over 60 million by the year 2020.40 Tissue engineering (TE) is a promising approach for repairing and replacing defective joint tissues in vivo. TE assists in the replacement of damaged tissue by providing a regenerated tissue that is specifically designed and fabricated to meet the needs of each individual patient. Novel tissue engineering strategies for using in vitro cultured products to replace damaged tissue have been developed and are now poised to emerge into the clinical field,22 but this approach currently is highly inefficient and not amenable to large scale manufacturing.21
Ex-vivo engineered cartilage should have the mechanical integrity needed to carry considerable loads immediately after implantation into a joint. From a patient care as well as a cost perspective, however, it would be desirable to minimize the time spent maturing the implant. Unfortunately, there is considerable donor-to-donor variability in the proliferation, differentiation potentials, and biosynthetic activity of cells. Some of this variability can be overcome,43,44 but it appears unlikely that a universal protocol can be developed which will guarantee optimal reproducible results in all cases. It is important to monitor the development of the engineered tissue for quality-control purposes to ensure that immature as well as poor or failed constructs are not implanted into patients. Unfortunately, most current mechanical and biochemical assessment protocols require destructive endpoint-testing and/or violation of the sterile bioreactor environment.9,24,30,31,38,41,48 When such methods are used, a tested construct is no longer suitable for implantation.29,41,48 End-point evaluation would require multiple test samples solely for testing purposes. Direct indentation testing can be used as an alternative to confined/unconfined compression to assess the mechanical properties of tissues.3,26–28,47 This works well in situ, but there are significant drawbacks to this approach in tissue engineering. The approach requires direct contact with the engineered tissue, which will again require opening the bioreactor system to the environment. If sequential testing of the tissue is desired, the risk of contaminating the reactor content increases with each opening. Depending on the bioreactor design, opening and reclosing the chamber may itself be quite labor intensive. Furthermore, even at low forces and displacements, indentation tests can result in marked cell death in human cartilage.4 Other approaches use magnetic resonance imaging (MRI) to measure glycosaminoglycan (GAG) concentration and water distribution nondestructively in tissue but these methods do not determine biomechanical properties.25 Limited cell availability, high cost, and time restrictions prevent any of the aforementioned testing procedures from becoming a viable method to implement. Quality control of tissue-engineered constructs must therefore be configured to use noninvasive/nondestructive evaluation techniques. Ultrasound probes on the other hand can be acoustically coupled to the outside of the reactor, without contact with the reactor contents.
Ultrasound has been evaluated as a technique for noninvasive evaluation of tissue-engineered cartilage, but has not yet been fully utilized for biomechanical assessment.17 Additionally, ultrasound has been used as a tool for predicting the regeneration process of tissue-engineered cartilage.18 Most pertinent to this study is the fact that material properties such as elastic modulus and density are known to correlate with the speed of sound within a test sample.35
In the present study, we used agarose hydrogels to determine if a correlation could be established between the modulus determined from mechanical testing and from ultrasound. The study is designed as a proof-of-concept of the use of ultrasound technology as a noninvasive, nondestructive method for evaluating the mechanical properties of tissue engineered weight-bearing tissues as they are growing in a bioreactor. We are not attempting to establish equivalence between the ultrasound and conventional mechanical tests. Rather, we are seeking to determine whether a useful correlation between ultrasound-derived mechanical properties and those determined by conventional tests can be found. Establishing a correlation with conventional assessment methods is the first step toward developing a quality-control index that will enable us to discriminate between mature, implantable, and immature TE constructs.
MATERIALS & METHODS
Materials
Agarose was obtained from Invitrogen (Carlsbad, CA). The ultrasound hardware consisted of a ½” diameter, nominally 15MHz center-frequency immersion-rated unfocused transducer (−6dB bandwidth 59.96%; waveform durations: 0.154 µs @ −14dB, 0.192 µs @ −20dB, and 0.256 µs @ −40dB, p/n V319, Olympus NDT, Waltham, MA), a Panametrics 5072PR pulser receiver (Olympus), and a Picoscope 3206 oscilloscope (Pico Technology, St Neots, Cambridgeshire, UK). A Microsoft Windows-based laptop was used for data acquisition. The fixturing framing struts and hardware were from MiniTec (Victor, NY); all other hardware and raw materials were from McMaster-Carr Supply Co. (Cleveland, OH). Software packages used for data acquisition and processing included Picoscope R.5.2, Microsoft Excel (Redmond, WA), Sigmaplot 11 (Systat Software, San Jose, CA), and MatLab (MathWorks, Natick, MA).
Gels
Agarose hydrogels were used as cartilage phantoms. They are similar to cartilage in that they are made up of a fluid saturated solid matrix, although they are homogeneous and have a simpler structure than cartilage. Since hydrogels can be made in carefully controlled concentrations and thicknesses, they are attractive substitutes for cartilage in this feasibility study. Agarose hydrogels in 1, 2, 5, and 10% concentrations with a 2–10 mm sample thickness were created using 12.7 mm diameter molds. Preliminary studies suggested that gels in the range of 1–10% agarose would span the range of stiffnesses expected in engineered cartilage. The molds were cut from a hollow acrylic tube. The tube was supported by a mandrel and rough-cut using a cutoff tool. The molds were then polished to within, on average, 10µm of the nominal height. The required amount of powdered agarose was weighed out using a precision balance (TB-215D, Denver Instruments, Arvada, CO) and added to the requisite volume of deionized water in a laboratory beaker. The beaker and agarose dispersion were then weighed, and the weight was recorded. The agarose dispersion was then heated to boiling several times in a microwave oven to dissolve the agarose completely in the water. The beakers were then weighed again, and evaporative losses were replaced using fresh diH2O.
For each concentration and height, six samples were created for a total of 216 gel samples. Each mold was set out on top of a glass bar. Using a 5 ml pipet, the agarose gel mixture was injected into the mold and topped immediately with a glass cover slip to ensure both faces of the gel would be flat, smooth, and parallel. Once solidified, gels were carefully removed from the mold and stored in distilled water at 4 °C until testing. Imperfect samples, e.g., samples containing bubbles were replaced.
Fixturing
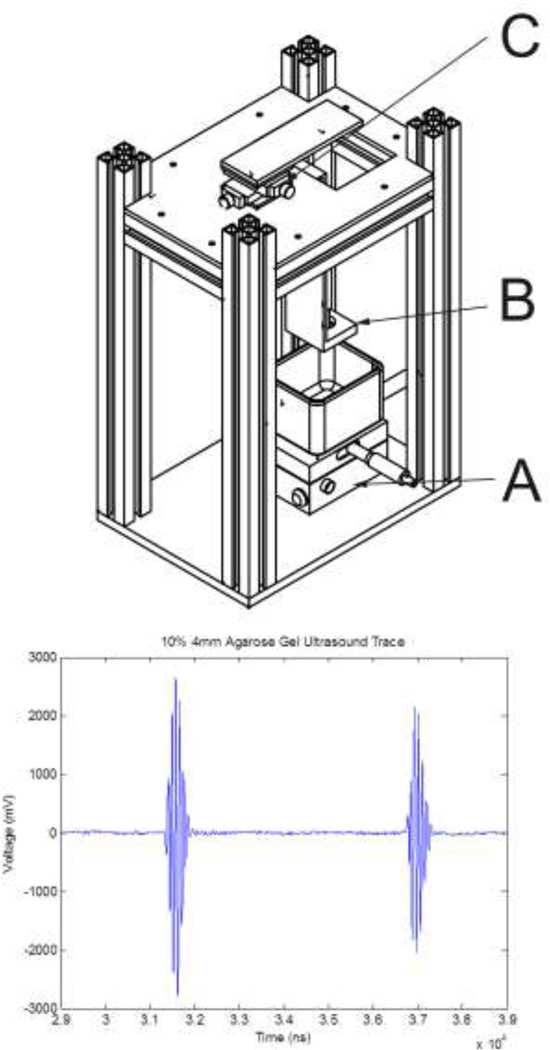
A rigid fixture was designed to secure the ultrasound transducer and allow for fine positioning relative to the sample (Figure 1). The fixture consisted of upper and lower 6.4 mm (¼”) aluminum plates and MiniTec struts. Positions were adjusted to maximize the amplitude of the reflections from the sample’s upper and lower surfaces. An X–Y table topped with a lab-jack allowed for rough positioning of a beaker containing the agarose cylinder relative to the transducer face (Figure 1, Part A). An L-shaped bracket was used to hold the transducer in a spherical bearing (Figure 1, Part B). The transducer was extended upwards by a machined Delrin adapter and then though the upper plate by a 19 mm OD (¾”) aluminum tube, which was slip-fit into a second spherical bearing. The latter was attached to a precision screw-driven X–Y positioning table (Figure 1, Part C). Adjustments to this upper positioning table were used to fine-tune the incident angle of the ultrasound beam by allowing the transducer face to be oriented parallel to the surface of the agarose gel sample.
Figure 1.
(Top) Ultrasound fixture. A: lower X–Y table allows for positioning of the sample relative to the transducer, which is held by the bracket B. An upper X–Y table (C) controls the incident angle of the ultrasound beam. (Bottom) Representative plot of ultrasound tracing illustrating the returns off the top and bottom surfaces of the agarose gel. The peak to peak separation was used to determine the speed of sound.
Ultrasound data acquisition
The gel cylinders were placed upright in distilled water in a 125 × 65 mm crystallizing dish (Corning Pyrex 3140, Fisher Scientific, Pittsburgh, PA), and were supported by a bed of 0.1 – 0.2% agarose cast at the bottom of the dish. All measurements were carried out at room temperature. The transducer face was immersed in the water and positioned 25 mm from the front gel face using the X–Y–Z controls of the positioning table. On the pulser-receiver, the pulse repeat frequency, energy, and damping were set to 1kHz, 52 µJ, and 100Ω, respectively. Gain was set to 50dB and no hardware filtering was used. All coaxial cabling was terminated with 50Ω resistors.
Data were acquired using the Picoscope software. Prior to recording a data set, the transducer face was oriented using the upper X–Y stage to maximize the amplitude of the return. The oscilloscope was configured for external triggering off the pulser receiver. Data (Figure 1, bottom) were then acquired at 50 MHz and averaged for several seconds; equivalent time sampling was used. The data were stored to disk.
Modeling
Signal processing was carried out in MATLAB. A linear phase, finite impulse response filter that uses a least squares approach was used to band-pass the data (~5 – 18MHz), then a signal envelope was built using the Hilbert transform. The two reflections were analyzed independently, and the absolute maximum of the signal envelopes was found. Speed of sound (c) was computed using the known height of the sample and the time difference between the computed maxima of the reflected signals. The modulus was calculated from ultrasonic data (n=6 per thickness at each concentration) using one-dimensional linear elastic and poroelastic models.
Using the elastic model, Young’s modulus (E) was computed from
| (1) |
where ρ is the measured sample density computed as the mass of the hydrogel divided by its volume.
The poroelastic model used in this investigation is based on a binary mixture of immiscible fluid and solid components. Both components are modeled as incompressible, the solid is linearly elastic and the fluid in viscid. Coupled interaction between solid and fluid is a function of the relative velocity of the components, fluid volume fraction and specific weight, and permeability. Pore distribution is assumed to be homogeneous and the fluid volume fraction is not a function of local dilatation. Under such conditions, the modulus (H, sometimes referred to as the aggregate modulus is equal to λ+2µ, the Lamé coefficients) was computed using:11
| (2) |
where c is the speed of sound, the ηi are volume fractions of the solid (s) and fluid (f), and the ρ b,i are the bulk densities of the fluid and solid components. These values, sometimes called apparent density, 32 are computed as the mass of solid or fluid per total volume of the hydrogel.
After the ultrasound evaluation, each gel was blotted dry and weighed using a digital mass balance. Since the dimensions of the hydrogel were carefully controlled, the densityρ for each sample was computed from its measured mass and computed volume. Bulk densities for an N% hydrogel were computed from:
| (3) |
| (4) |
where19 ρagarose = 1.64·103 kg/m3.
Calculation of the volume fraction of the solid accounted for the water that is bound in helical agarose fibrils. For a gel with agarose concentration N, and a mass fraction of agarose in the fiber of 0.625,11, the volume fraction of agarose is:
| (5) |
and the volume fraction of fluid in the gel:
| (6) |
Mechanical testing
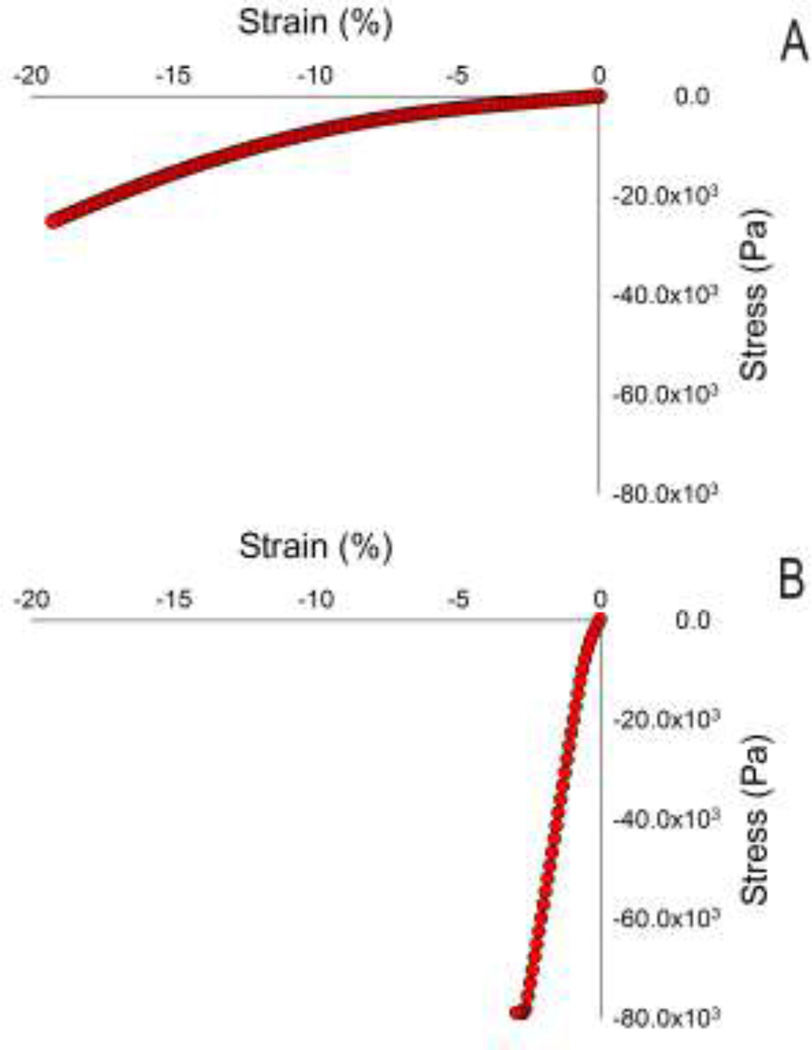
After ultrasound evaluation, samples were tested mechanically (Rheometrics RSA-II, TA Instruments, New Castle, DE) under uniaxial unconfined compression and a constant strain rate of 5% per second for 4 seconds. The slope of a straight-line fit of the stress-stain data between 0–2% strain, determined using a program written in MATLAB, was used as a measure of mechanical stiffness (at a 5%/s strain rate), which we will refer to as Young’s modulus in this paper (Figure 2). In three samples of 2% gels, frequency dependence of the modulus was evaluated over a range of 0.5 to 100 rad/s (the upper limit of the Rheometrics device).
Figure 2.
Representative plots of mechanical compression data of a 1% agarose 10 mm gel (A) and a 10% agarose 10 mm gel (B). Young’s modulus was determined via a linear approximation of slope within the first 2% of applied strain. The 10% gels exceeded the load cell limit in the testing.
Statistical analysis
To determine whether there was a correlation between gel height and stiffness, the stiffness measure was regressed on height of the gel, for each type of measurement (ultrasound or mechanical) with a different regression run for each gel percent, ranging from 1% to 10%. The dependence of stiffness on gel height and gel percent was modeled using multiple linear regression, where the logarithm of the stiffness measure was used as dependent variable, to better stabilize the variance about the regression. The dependence of mechanical modulus on ultrasound modulus was modeled using multiple linear regression; again log-transform was used to stabilize variance about the regression.
RESULTS
Mechanical measurements showed an approximately linear relationship between stress and strain, particularly in the 0% to 2% strain range used to compute Young’s modulus (Figure 3). Young’s modulus values ranged from an average of 1.3 × 10⁵ Pa for the 1% gels to an average of 3.0 × 10⁶ Pa for the 10% gels.
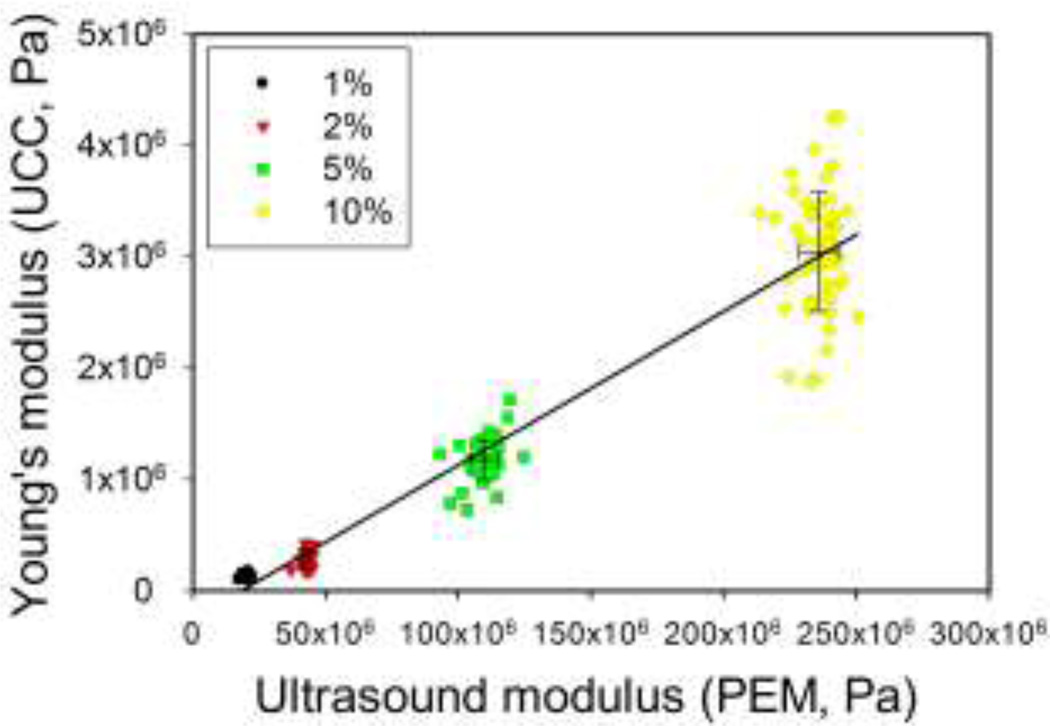
Figure 3.
Plot of mechanically-derived modulus versus ultrasound-derived modulus. Note that the coefficient of variation is in the range of 3 – 5 % for the ultrasound measurements, whereas for the unconfined compression it is in the range of 12 – 30 % depending on gel concentration.
In the ultrasound tests, the amplitude of reflections from the top and bottom surfaces of the hydrogels were easily maximized by adjusting the alignment fixtures (Figure 1, Part C), and thus the orientation of the ultrasonic transducer. A representative ultrasound trace is shown in the bootom panel of Figure 1.
The values of Young’s modulus (obtained using the elastic model) were higher than those for the aggregate modulus (obtained using the poroelastic model) but the range of values for Young’s modulus was much smaller than that for the aggregate modulus (Table 1). Using the elastic ultrasound model resulted in values of Young’s modulus ranging from 1.7 × 10⁹ Pa for the 1% gels to 2.4 × 10⁹ Pa for the 10% gels. The poroelastic model applied to the same data set yielded values one to two orders of magnitude lower, i.e., between 1.7 × 10⁷ Pa and 2.5 × 10⁸ Pa (1% and 10% agarose respectively). Where a faint dependency on agarose concentration may have been present when using the elastic model (Equation (1)), it is definitely present using the poroelastic model (Equation (2)). A strong positive correlation (Pearson’s correlation 0.9693, r2 = 0.94) between the moduli computed from ultrasound using the poroelastic model and conventional mechanical testing was found; a representative plot is shown in Figure 3. Log transform of both mechanical and ultrasound moduli stabilized variability and better met assumptions for Pearson’s correlation; the Pearson’s correlation between the logarithms increased to 0.9858 (r2 = 0.97, plot not shown). Correlations between the logarithms of ultrasound and mechanical moduli within each gel concentration group were 0.42 (p=0.002), 0.34 (p=0.015), 0.40 (p=0.003), and 0.05 (p=0.75) for gel concentrations of 1%, 2%, 5%, and 10%, respectively. The lower correlation within groups is not surprising, as even when two variables X and Y are highly correlated across the entire range of X, if samples are taken over a small range of X-values, the correlation will be much less.6
Table 1.
Mean ± standard deviation for the moduli derived from ultrasound measurements using the linear elastic model (LEM) or the poroelastic model (PEM) and from unconfined compression tests (UCC) for each percentage gel and for all the data pooled. Note that in the case of LEM the data center around the bulk modulus for water.
| 1% | 2% | 5% | 10% | All% | |
|---|---|---|---|---|---|
| LEM | 2.01 × 10⁹ ± 9.89 × 10⁷ | 2.13 × 10⁹ ± 7.61 × 10⁷ | 2.18 × 10⁹ ± 8.78 × 10⁷ | 2.28 × 10⁹ ± 6.01 × 10⁷ | 2.15 × 10⁹ ± 1.28 × 10⁸ |
| PEM | 2.10 × 10⁷ ± 1.08 × 10⁶ | 4.28 × 10⁷ ± 1.73 × 10⁶ | 1.10 × 10⁸ ± 5.12 × 10⁶ | 2.36 × 10⁸ ± 7.23 × 10⁶ | |
| UCC | 1.28 × 10⁵ ± 1.61 × 10⁴ | 2.87 × 10⁵ ± 8.65 × 10⁴ | 1.17 × 10⁶ ± 1.79 × 10⁵ | 3.04 × 10⁶ ± 5.26 × 10⁵ |
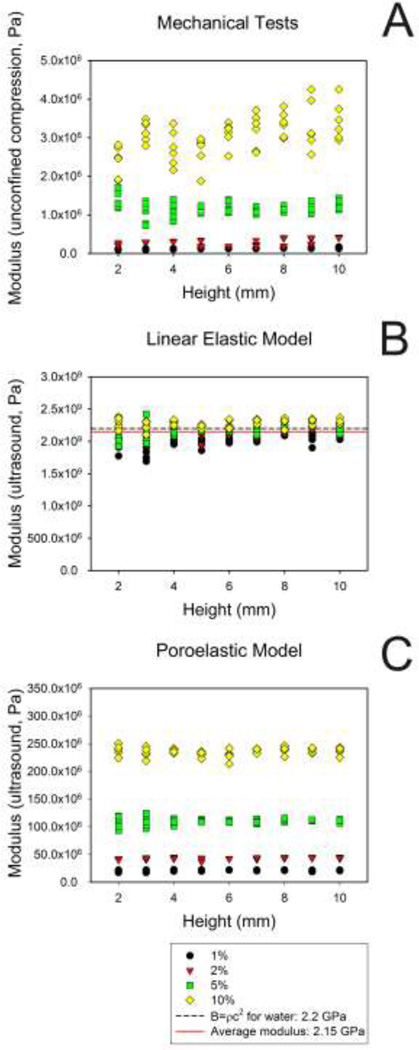
Regression analysis suggests that very little of the variation in modulus, as measured by ultrasound, was explained by phantom height (r2 range = 0.02 to 0.14, Figure 4 and Table 2). With the exception of the 2% gel samples the regression of the modulus on height had a slope that was not significantly different from zero.
Figure 4.
Variation of the elastic modulus as a function of agarose gel height. Comparison of Young’s modulus determined by unconfined compression tests (A) with moduli determined using ultrasound and either the linear elastic model (B) or the poroelastic model (C). Note the dependency on gel concentration in A and C, compared to the clustering near the bulk modulus of water in B.
Table 2.
Effect of gel height on modulus as a function of gel percentage. For ultrasound measures, the only significant relationship between stiffness and height was for the 2 % gel. For the mechanical measures, a significant relationship between height and stiffness was seen in all except the 5% gel data.
| Ultrasound | Mechanical | |||
|---|---|---|---|---|
| Gel % | R2 | p-value | R2 | p-value |
| 1 | 0.0487 | 0.12 | 0.6692 | <0.0001 |
| 2 | 0.1495 | 0.0055 | 0.2009 | 0.0010 |
| 5 | 0.0231 | 0.28 | 0.0003 | 0.91 |
| 10 | 0.0297 | 0.22 | 0.2803 | <0.0001 |
For the mechanical tests, the phantom height explained somewhat more of the modulus variation (r2 range 0.0003 – 0.67, Table 2 and Figure 4). For all except the 5% gel, the slope of the regression of modulus on height was significantly greater than zero, indicating that the modulus increased with gel height. Still, gel height explained much less of the variability in mechanical modulus than did gel concentration. For example, in a multiple regression of log10 (mechanical modulus), linear and quadratic terms for gel percent explained 97.3% of the variability (r2 = 0.973). Adding height to the regression equation only increased the R2 slightly (albeit statistically significantly, p<.0001) from 0.973 to 0.977.
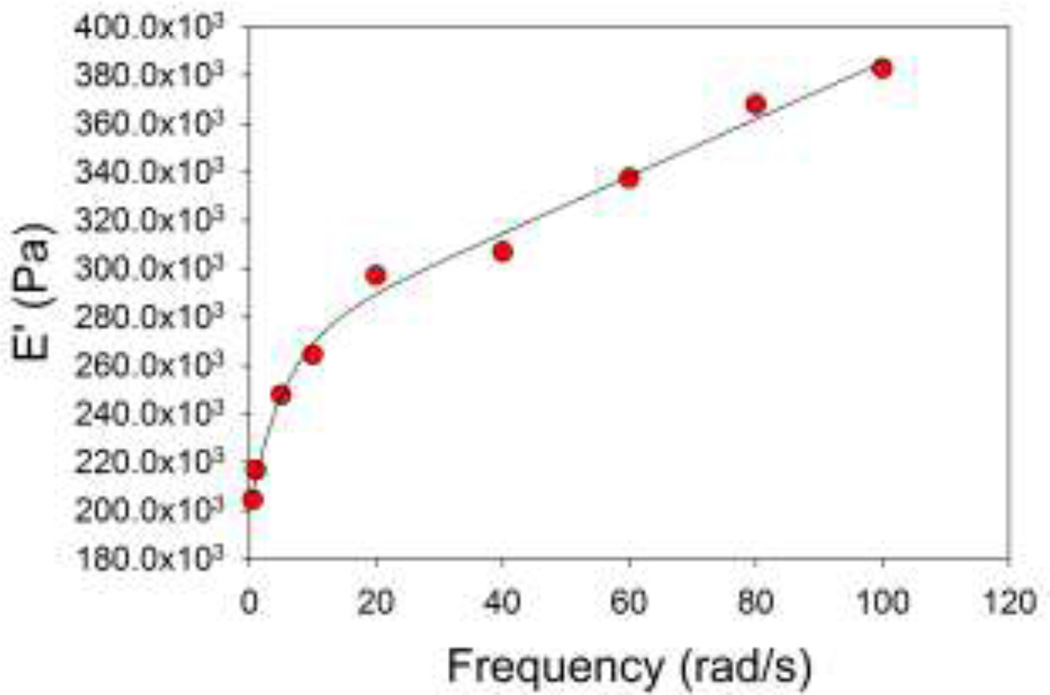
A frequency dependency of the storage and loss moduli was noted over the frequency range tested mechanically (0.5 – 100 rad/s). A representative plot of the storage modulus for a 2%, 3 mm high gel sample is shown in Figure 5.
Figure 5.
Frequency dependence of storage modulus E’ for a sweep of 0 – 100 rad/s. In this case, a double exponential (f = y0 + a(1−e(−bx) + c(1−e(−dx))) fit the data well, but the significance of this relationship has not been explored.
DISCUSSION
Our long-term goal is to use ultrasound technology as a noninvasive, nondestructive method for estimating the mechanical properties of engineered tissues as they develop in a bioreactor. For this proof-of-concept study, we used a simplified, well-controlled system of agarose hydrogels. We chose agarose hydrogels since, as is cartilage, they are fluid-saturated and poroelastic, and they are easily made with precisely-controlled compositions and dimensions10. Hydrogels are also frequently used as carriers in cartilage TE. Furthermore, if correlations could not be found in this system, it appeared unlikely that they could be found in more complex tissues.
Material properties such as elastic modulus and density measurements are known to correlate with the speed of sound (Equations 1 and 2),35 and this has been verified in cartilage.45 Accoustic properties have been used for noninvasive evaluation of tissue-engineered cartilage, but have been used to a lesser extent for direct assessment of biomechanical properties.17,18 Thus, we sought to determine explicitly whether moduli determined from ultrasound measurements would correlate with conventional mechanical stress-strain measurements. This is in contrast to other studies that focused on general acoustic properties of cartilage as indices of its condition,15,20,34 or to histological integrity.14,16,45,46
We could have chosen other mechanical measures of stiffness such as the equilibrium modulus, which would yield the intrinsic stiffness of the polymer matrix. This is only one of three material constants (permeability and two independent properties of the solid matrix, e.g., aggregate modulus and Poisson’s ratio) needed for a complete description of the mechanics of an isotropic poroelastic material. Although material constants are essential in some applications, if one is ultimately interested in an index of quality, they are less critical and possibly less informative. Rapid indentation is an example of a test that gives an index of cartilage health without yielding material constants of the solid matrix.3,5,26–28,47 Supporting this concept, data from Töyräs et al. show that equilibrium and dynamic (1Hz, 1% strain) mechanical measures of stiffness both correlate equally well with speed of sound in cartilage.45 Our results are encouraging, and illustrate a positive relationship between moduli calculated from ultrasound and from mechanical testing.
Based on the work of, e.g., Armstrong et al. and Eberhardt et al. on the behavior of cartilage at high loading rates, we initially assumed that wave propagation through hydrogels could be described using a linear elastic model.1,12 However, we found a much stronger positive correlation between the moduli calculated using uniaxial unconfined compression and the poroelastic model, than when the linear elastic model was used. This suggests the poroelastic model is more representative of hydrogel acoustics than an elastic model. Biomechanical studies have also previously shown that a poroelastic model better captured the essential mechanical behavior of cartilage.2,23,32
Moduli determined by ultrasound were several orders of magnitude higher than those derived from conventional unconfined compression tests (Figure 4). Both of these tests yield stiffnesses that are dependent on the interaction of the fluid and solid components of the gels7. Differences in moduli between ultrasound and mechanical tests may be attributed, at least in part, to the inherent rate dependency of poroelastic materials, which has been observed in cartilage.36,42 A further caveat is that our mechanical moduli differ from values presented by others.8 Differences in strain rate or differences in the intrinsic properties of different preparations of agarose could account for these discrepancies. For this reason, all tests in this paper were performed at the same strain rate and with a single lot of agarose.
For agarose, we also noted a frequency dependence of the modulus determined from mechanical tests performed over a low range of frequencies (0.08 to 16 Hz, Table 3). It is therefore important to note that the mechanical modulus values of agarose reported here may differ (at times substantially) from values reported by others that were generated at different strain rates.8 Because the ultrasound transducer frequency is six orders of magnitude higher, we cannot extrapolate from these data. We would like to note, however, that other factors may be responsible for the observed differences. The mechanical and ultrasound moduli are measured under physically different test conditions and assumptions. In the mechanical tests, materials were free to expand laterally, whereas when using the one-dimensional calculation of the moduli from ultrasound data, we are assuming that the material cannot expand laterally. This is conceptually equivalent to a confined compression test. The difference in the magnitude of the moduli is consistent with the assumptions of confined vs. unconfined compression.
Table 3.
Storage (E') and loss (E") moduli for a 2 %, 3 mm thick agarose gel over a range of low frequencies. Tests were performed using a Rheometrics RSA II.
| Freq (rad/s) | E' (Pa) | E" (Pa) | Tanδ |
|---|---|---|---|
| 0.5 | 2.05 × 10⁵ | 5.84 × 10⁴ | 0.286 |
| 1 | 2.17 × 10⁵ | 5.48 × 10⁴ | 0.253 |
| 5 | 2.48 × 10⁵ | 6.09 × 10⁴ | 0.246 |
| 10 | 2.64 × 10⁵ | 7.42 × 10⁴ | 0.281 |
| 20 | 2.97 × 10⁵ | 8.79 × 10⁴ | 0.296 |
| 40 | 3.07 × 10⁵ | 9.65 × 10⁴ | 0.314 |
| 60 | 3.37 × 10⁵ | 1.06 × 10⁵ | 0.314 |
| 80 | 3.68 × 10⁵ | 1.14 × 10⁵ | 0.309 |
| 100 | 3.83 × 10⁵ | 1.17 × 10⁵ | 0.304 |
LIMITATIONS
A limitation of the elastic model is that it does not distinguish between fluid and solid behavior, as can be seen from a comparison of one dimensional waves in solids and fluids13,37. For a fluid of density, ρf, the bulk modulus, B, can be described by
| (7) |
which is the same functional relationship as that for the elastic modulus. Using the elastic model, our ultrasonic estimates of Young’s modulus showed very little effect of the hydrogel concentration, but rather were clustered around the bulk modulus of water (2.2 GPa, Figure 4B).39 Thus, when applied to hydrogels, the fluid component dominates wave propagation.
In contrast, the poroelastic model explicitly recognizes that the material is composed of solid and fluid phases (Equation (2)). Although the same speed of sound data were used as in the elastic model, and despite the fact that those measurements all fell within ±60 m/s of the speed of sound in water (1,500m/s),37 the poroelastic model was able to identify distinct material properties in hydrogels of different concentrations. Others, e.g., Chiarelli et al. have proposed continuum poroelastic models with different functional relationships between the solid and fluid phases than in the model we used.10 Different interaction models may provide additional insight into the behavior of the material; however, we have no reason to believe that this would change the “macroscopic” correlation we describe.
The poroelastic model is more sensitive to changes in the composition of the hydrogels than the elastic model, but more tissue-specific parameters are needed to determine the modulus. Because this could limit the applicability of this approach to cartilage, we examined the sensitivity of the modulus to changes in the density of the constituents, and to volume fraction. Equation (2) was used to explore the effects of hypothetical changes to density and volume fraction.
Small differences in density between the phases produced small changes in H. For example, increasing the density of the solid phase 5% over that of the fluid phase and holding the fluid volume fraction at 0.7 increased the modulus by 3.5% (Equation (2)).
In general, results are more sensitive to changes in volume fraction. If we assume that the true densities of the fluid and solid phases are equal, and that cartilage is fully saturated (ηf + η s = 1), Equation (2) reduces to
| (8) |
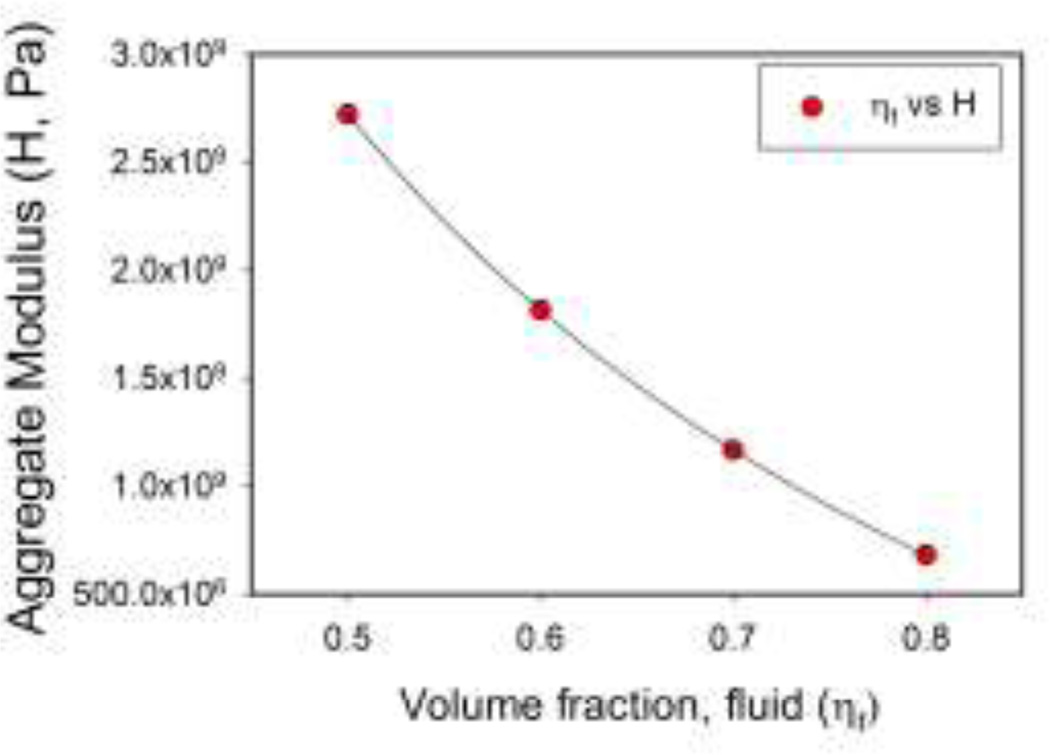
where ρ is the true density of each phase, which we set equal to that of water. Varying the fluid volume fraction from 0.5 to 0.8 results in a four-fold decrease in H (Figure 6). These results suggest that volume fraction must be known to a much greater degree of accuracy than the constituent densities. The sensitivity to volume fraction also suggests that ultrasound should be a sensitive indicator of development of a tissue-engineered construct. Based on the available literature, we anticipate that with embedded cells, the fluid volume fraction of agarose carrier gels would undergo considerable change during cartilage development. For example, Ng et al. seeded 2% and 3% gels (97% or 98% water) with chondrocytes,33 but the water content of mature cartilage is likely to be 80% or less. Our sensitivity analysis predicts that these changes will be readily detectable using ultrasound.
Figure 6.
Theoretical prediction of the sensitivity of the aggregate modulus H to changes in volume fraction. Varying the fluid volume fraction from 0.5 to 0.8 results in a four-fold decrease in H.
A caveat is that in a live construct, we would predict a loss of homogeneity over time, as previous studies have shown that differentiation and maturation of the extracellular matrix does not occur uniformly. As implemented here, the ultrasound measurements will result in average, not local, properties for the volume of tissue under examination.
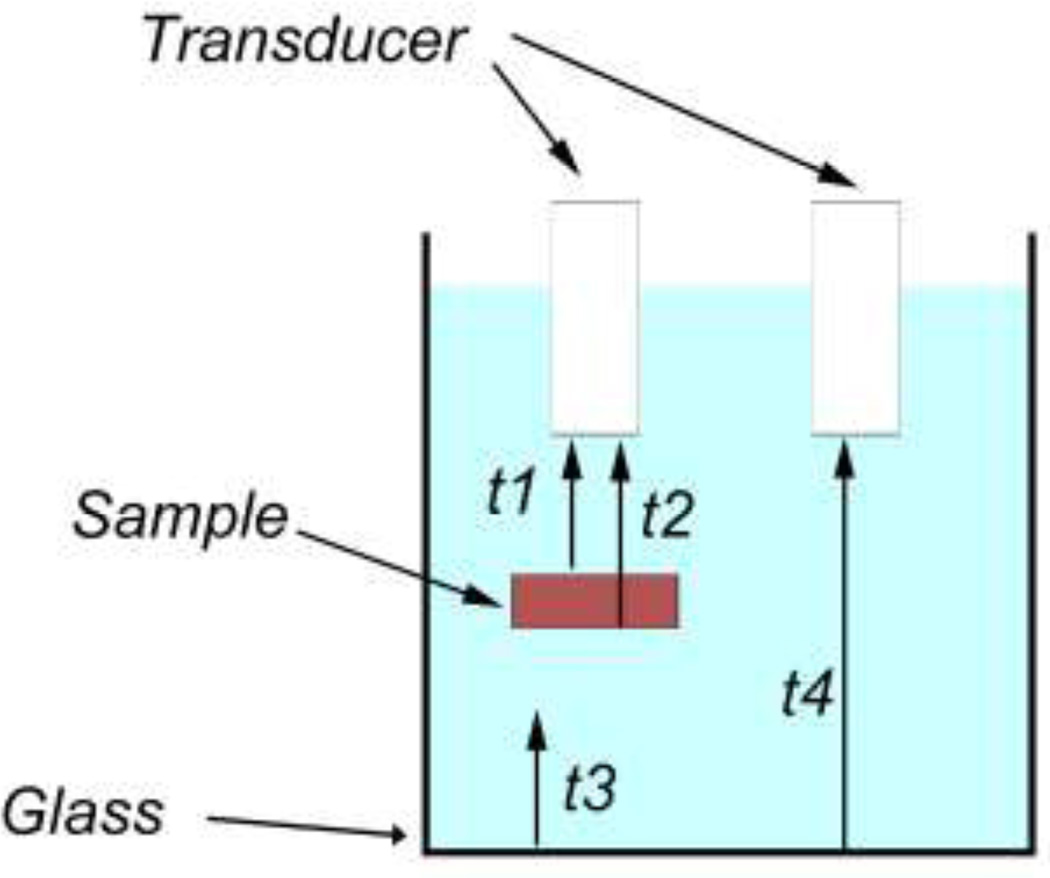
A further caveat related to the need to know the height of the sample, however, as shown in Figure 7, one-way travel times for a series of echoes and the known speed of sound in the surrounding fluid can be used to derive the sample thickness. Irregularly contoured samples could potentially pose a problem, however ultimately much smaller diameter transducers will mitigate this issue.
Figure 7.
Using one-way travel times for the echoes shown in the figure, and the known speed of sound in the surrounding fluid (cf), the speed of sound in the sample is computed from c = {[t2−t1)+(t4−t3)]/(t2−t1)}cf. The sample’s thickness (h) is then found from h = c(t2−t1).
CONCLUSIONS
In summary, using hydrogel phantoms, we have encouraging results demonstrating a positive relationship between moduli calculated from ultrasound and from mechanical testing. The correlation depended on the model used to estimate the modulus from ultrasonic measurements; of the models tested, the poroelastic model best predicted the mechanical measurements. Results from these studies will be used to guide further investigation into the properties of native and engineered cartilage.
ACKNOWLEDGEMENTS
Special thanks to Yves T. Wang for his help with trouble shooting. Generous travel assistance was provided by the Case Alumni Association (AMM). Grant support was provided by the National Institutes of Health through grants R01 AR050208 (JFW) and P01 AR053622 (JFW, AIC, VMG, and JMM). This work has been presented in part at the 2009 and 2010 annual meetings of the Biomedical Engineering Society and the 2010 annual meeting of the Orthopædic Research Society.
REFERENCES
- 1.Armstrong CG, Lai WM, Mow VC. An analysis of the unconfined compression of articular cartilage. J Biomech Eng. 1984;106(2):165–173. doi: 10.1115/1.3138475. [DOI] [PubMed] [Google Scholar]
- 2.Ateshian GA. The role of interstitial fluid pressurization in articular cartilage lubrication. J Biomech. 2009;42(9):1163–1176. doi: 10.1016/j.jbiomech.2009.04.040. [DOI] [PMC free article] [PubMed] [Google Scholar]
- 3.Bae WC, Lewis CW, Levenston ME, Sah RL. Indentation testing of human articular cartilage: effects of probe tip geometry and indentation depth on intra-tissue strain. J Biomech. 2006;39(6):1039–1047. doi: 10.1016/j.jbiomech.2005.02.018. [DOI] [PubMed] [Google Scholar]
- 4.Bae WC, Schumacher BL, Sah RL. Indentation probing of human articular cartilage: Effect on chondrocyte viability. Osteoarthr Cartilage. 2007;15(1):9–18. doi: 10.1016/j.joca.2006.06.007. [DOI] [PubMed] [Google Scholar]
- 5.Bae WC, Temple MM, Amiel D, Coutts RD, Niederauer GG, Sah RL. Indentation testing of human cartilage: sensitivity to articular surface degeneration. Arthritis Rheum. 2003;48(12):3382–3394. doi: 10.1002/art.11347. [DOI] [PubMed] [Google Scholar]
- 6.Bland JM, Altman DG. Correlation in restricted ranges of data. BMJ. 2011;342:d556. doi: 10.1136/bmj.d556. [DOI] [PubMed] [Google Scholar]
- 7.Buckley AR, Putnam CW, Russell DH. Prolactin as a mammalian mitogen and tumor promoter. Adv Enzyme Regul. 1988;27:371–391. doi: 10.1016/0065-2571(88)90027-1. [DOI] [PubMed] [Google Scholar]
- 8.Buckley CT, Thorpe SD, O'Brien FJ, Robinson AJ, Kelly DJ. The effect of concentration, thermal history and cell seeding density on the initial mechanical properties of agarose hydrogels. J Mech Behav Biomed Mater. 2009;2(5):512–521. doi: 10.1016/j.jmbbm.2008.12.007. [DOI] [PubMed] [Google Scholar]
- 9.Bursac PM, Obitz TW, Eisenberg SR, Stamenovic D. Confined and unconfined stress relaxation of cartilage: appropriateness of a transversely isotropic analysis. J Biomech. 1999;32(10):1125–1130. doi: 10.1016/s0021-9290(99)00105-0. [DOI] [PubMed] [Google Scholar]
- 10.Chiarelli P, Lanata A, Carbone M, Domenici C. High frequency poroelastic waves in hydrogels. J Acoust Soc Am. 2010;127(3):1197–1207. doi: 10.1121/1.3293000. [DOI] [PubMed] [Google Scholar]
- 11.de Boer R, Ehlers W, Liu Z. One-dimensional transient wave propagation in fluid saturated incompressible porous media. Arch Appl Mech. 1993;63:59–72. [Google Scholar]
- 12.Eberhardt AW, Keer LM, Lewis JL, Vithoontien V. An analytical model of joint contact. J Biomech Eng. 1990;112(4):407–413. doi: 10.1115/1.2891204. [DOI] [PubMed] [Google Scholar]
- 13.Fox EA. Mechanics. New York: Harper and Row; 1967. [Google Scholar]
- 14.Hattori K, Ikeuchi K, Morita Y, Takakura Y. Quantitative ultrasonic assessment for detecting microscopic cartilage damage in osteoarthritis. Arthritis Res Ther. 2005;7(1):R38–R46. doi: 10.1186/ar1463. [DOI] [PMC free article] [PubMed] [Google Scholar]
- 15.Hattori K, Mori K, Habata T, Takakura Y, Ikeuchi K. Measurement of the mechanical condition of articular cartilage with an ultrasonic probe: quantitative evaluation using wavelet transformation. Clin Biomech. 2003;18(6):553–557. doi: 10.1016/s0268-0033(03)00048-2. [DOI] [PubMed] [Google Scholar]
- 16.Hattori K, Takakura Y, Ishimura M, Tanaka Y, Habata T, Ikeuchi K. Differential acoustic properties of early cartilage lesions in living human knee and ankle joints. Arthritis Rheum. 2005;52(10):3125–3131. doi: 10.1002/art.21299. [DOI] [PubMed] [Google Scholar]
- 17.Hattori K, Takakura Y, Ohgushi H, Habata T, Uematsu K, Ikeuchi K. Novel ultrasonic evaluation of tissue-engineered cartilage for large osteochondral defects--non-invasive judgment of tissue-engineered cartilage. J Orthop Res. 2005;23(5):1179–1183. doi: 10.1016/j.orthres.2005.03.014. [DOI] [PubMed] [Google Scholar]
- 18.Hattori K, Takakura Y, Ohgushi H, Habata T, Uematsu K, Yamauchi J, Yamashita K, Fukuchi T, Sato M, Ikeuchi K. Quantitative ultrasound can assess the regeneration process of tissue-engineered cartilage using a complex between adherent bone marrow cells and a three-dimensional scaffold. Arthritis Res Ther. 2005;7(3):R552–R559. doi: 10.1186/ar1710. [DOI] [PMC free article] [PubMed] [Google Scholar]
- 19.Johnson EM, Berk DA, Jain RK, Deen WM. Diffusion and partitioning of proteins in charged agarose gels. Biophys J. 1995;68(4):1561–1568. doi: 10.1016/S0006-3495(95)80328-0. [DOI] [PMC free article] [PubMed] [Google Scholar]
- 20.Kaleva E, Saarakkala S, Töyräs J, Nieminen HJ, Jurvelin JS. In-vitro comparison of time-domain, frequency-domain and wavelet ultrasound parameters in diagnostics of cartilage degeneration. Ultrasound Med Biol. 2008;34(1):155–159. doi: 10.1016/j.ultrasmedbio.2007.06.028. [DOI] [PubMed] [Google Scholar]
- 21.Kelly DJ, Crawford A, Dickinson SC, Sims TJ, Mundy J, Hollander AP, Prendergast PJ, Hatton PV. Biochemical markers of the mechanical quality of engineered hyaline cartilage. J Mater Sci Mater Med. 2007;18(2):273–281. doi: 10.1007/s10856-006-0689-2. [DOI] [PubMed] [Google Scholar]
- 22.Kino-Oka M, Maeda Y, Yamamoto T, Sugawara K, Taya M. A kinetic modeling of chondrocyte culture for manufacture of tissue-engineered cartilage. J Biosci Bioeng. 2005;99(3):197–207. doi: 10.1263/jbb.99.197. [DOI] [PubMed] [Google Scholar]
- 23.Korhonen RK, Laasanen MS, Töyräs J, Lappalainen R, Helminen HJ, Jurvelin JS. Fibril reinforced poroelastic model predicts specifically mechanical behavior of normal, proteoglycan depleted and collagen degraded articular cartilage. J Biomech. 2003;36(9):1373–1379. doi: 10.1016/s0021-9290(03)00069-1. [DOI] [PubMed] [Google Scholar]
- 24.Li LP, Buschmann MD, Shirazi-Adl A. A fibril reinforced nonhomogeneous poroelastic model for articular cartilage: inhomogeneous response in unconfined compression. J Biomech. 2000;33(12):1533–1541. doi: 10.1016/s0021-9290(00)00153-6. [DOI] [PubMed] [Google Scholar]
- 25.Lu XL, Sun DD, Guo XE, Chen FH, Lai WM, Mow VC. Indentation determined mechanoelectrochemical properties and fixed charge density of articular cartilage. Ann Biomed Eng. 2004;32(3):370–379. doi: 10.1023/b:abme.0000017534.06921.24. [DOI] [PubMed] [Google Scholar]
- 26.Lyyra-Laitinen T, Niinimäki M, Töyräs J, Lindgren R, Kiviranta I, Jurvelin JS. Optimization of the arthroscopic indentation instrument for the measurement of thin cartilage stiffness. Phys Med Biol. 1999;44(10):2511–2524. doi: 10.1088/0031-9155/44/10/310. [DOI] [PubMed] [Google Scholar]
- 27.Lyyra T, Jurvelin J, Pitkänen P, Väätäinen U, Kiviranta I. Indentation instrument for the measurement of cartilage stiffness under arthroscopic control. Med Eng Phys. 1995;17(5):395–399. doi: 10.1016/1350-4533(95)97322-g. [DOI] [PubMed] [Google Scholar]
- 28.Lyyra T, Kiviranta I, Väätäinen U, Helminen HJ, Jurvelin JS. In vivo characterization of indentation stiffness of articular cartilage in the normal human knee. J Biomed Mater Res. 1999;48(4):482–487. doi: 10.1002/(sici)1097-4636(1999)48:4<482::aid-jbm13>3.0.co;2-m. [DOI] [PubMed] [Google Scholar]
- 29.Ma PX, Langer R. Morphology and mechanical function of long-term in vitro engineered cartilage. J Biomed Mater Res. 1999;44(2):217–221. doi: 10.1002/(sici)1097-4636(199902)44:2<217::aid-jbm12>3.0.co;2-6. [DOI] [PubMed] [Google Scholar]
- 30.Mak AF, Lai WM, Mow VC. Biphasic indentation of articular cartilage--I. Theoretical analysis. J Biomech. 1987;20(7):703–714. doi: 10.1016/0021-9290(87)90036-4. [DOI] [PubMed] [Google Scholar]
- 31.Mow VC, Gibbs MC, Lai WM, Zhu WB, Athanasiou KA. Biphasic indentation of articular cartilage--II. A numerical algorithm and an experimental study. J Biomech. 1989;22(8–9):853–861. doi: 10.1016/0021-9290(89)90069-9. [DOI] [PubMed] [Google Scholar]
- 32.Mow VC, Kuei SC, Lai WM, Armstrong CG. Biphasic creep and stress relaxation of articular cartilage in compression: Theory and experiments. J Biomech Eng. 1980;102(1):73–84. doi: 10.1115/1.3138202. [DOI] [PubMed] [Google Scholar]
- 33.Ng KW, Ateshian GA, Hung CT. Zonal chondrocytes seeded in a layered agarose hydrogel create engineered cartilage with depth-dependent cellular and mechanical inhomogeneity. Tissue Eng Part A. 2009;15(9):2315–2324. doi: 10.1089/ten.tea.2008.0391. [DOI] [PMC free article] [PubMed] [Google Scholar]
- 34.Nieminen HJ, Saarakkala S, Laasanen MS, Hirvonen J, Jurvelin JS, Töyräs J. Ultrasound attenuation in normal and spontaneously degenerated articular cartilage. Ultrasound Med Biol. 2004;30(4):493–500. doi: 10.1016/j.ultrasmedbio.2003.12.007. [DOI] [PubMed] [Google Scholar]
- 35.Nieminen HJ, Töyräs J, Laasanen MS, Jurvelin JS. Acoustic properties of articular cartilage under mechanical stress. Biorheology. 2006;43(3–4):523–535. [PubMed] [Google Scholar]
- 36.Oloyede A, Flachsmann R, Broom ND. The dramatic influence of loading velocity on the compressive response of articular cartilage. Connect Tissue Res. 1992;27(4):211–224. doi: 10.3109/03008209209006997. [DOI] [PubMed] [Google Scholar]
- 37.Pierce AD. Acoustics. New York: McGraw-Hill; 1981. [Google Scholar]
- 38.Roth V, Mow VC. The intrinsic tensile behavior of the matrix of bovine articular cartilage and its variation with age. J Bone Joint Surg [Am] 1980;62(7):1102–1117. [PubMed] [Google Scholar]
- 39.Sabersky RH, Acosta AJ, Hauptmann EG, Gates EM. Fluid Flow. Upper Saddle River: Prentice Hall; 1999. [Google Scholar]
- 40.Schulz RM, Bader A. Cartilage tissue engineering and bioreactor systems for the cultivation and stimulation of chondrocytes. Eur Biophys J. 2007;36(4–5):539–568. doi: 10.1007/s00249-007-0139-1. [DOI] [PubMed] [Google Scholar]
- 41.Setton LA, Elliott DM, Mow VC. Altered mechanics of cartilage with osteoarthritis: human osteoarthritis and an experimental model of joint degeneration. Osteoarthr Cartilage. 1999;7(1):2–14. doi: 10.1053/joca.1998.0170. [DOI] [PubMed] [Google Scholar]
- 42.Silyn-Roberts H, Broom ND. Fracture behaviour of cartilage-on-bone in response to repeated impact loading. Connect Tiss Res. 1990;24(2):143–156. doi: 10.3109/03008209009152430. [DOI] [PubMed] [Google Scholar]
- 43.Solchaga LA, Penick K, Goldberg VM, Caplan AI, Welter JF. Fibroblast growth factor-2 enhances proliferation and delays loss of chondrogenic potential in human adult bone-marrow-derived mesenchymal stem cells. Tissue Eng Part A. 2010;16(3):1009–1019. doi: 10.1089/ten.tea.2009.0100. [DOI] [PMC free article] [PubMed] [Google Scholar]
- 44.Solchaga LA, Penick K, Porter JD, Goldberg VM, Caplan AI, Welter JF. FGF-2 enhances the mitotic and chondrogenic potentials of human adult bone marrow-derived mesenchymal stem cells. J Cell Physiol. 2005;203(2):398–409. doi: 10.1002/jcp.20238. [DOI] [PubMed] [Google Scholar]
- 45.Töyräs J, Laasanen MS, Saarakkala S, Lammi MJ, Rieppo J, Kurkijärvi J, Lappalainen R, Jurvelin JS. Speed of sound in normal and degenerated bovine articular cartilage. Ultrasound Med Biol. 2003;29(3):447–454. doi: 10.1016/s0301-5629(02)00708-1. [DOI] [PubMed] [Google Scholar]
- 46.Töyräs J, Rieppo J, Nieminen MT, Helminen HJ, Jurvelin JS. Characterization of enzymatically induced degradation of articular cartilage using high frequency ultrasound. Phys Med Biol. 1999;44(11):2723–2733. doi: 10.1088/0031-9155/44/11/303. [DOI] [PubMed] [Google Scholar]
- 47.Vasara AI, Jurvelin JS, Peterson L, Kiviranta I. Arthroscopic cartilage indentation and cartilage lesions of anterior cruciate ligament-deficient knees. Am J Sports Med. 2005;33(3):408–414. doi: 10.1177/0363546504268040. [DOI] [PubMed] [Google Scholar]
- 48.Wang CC, Hung CT, Mow VC. An analysis of the effects of depth-dependent aggregate modulus on articular cartilage stress-relaxation behavior in compression. J Biomech. 2001;34(1):75–84. doi: 10.1016/s0021-9290(00)00137-8. [DOI] [PubMed] [Google Scholar]


