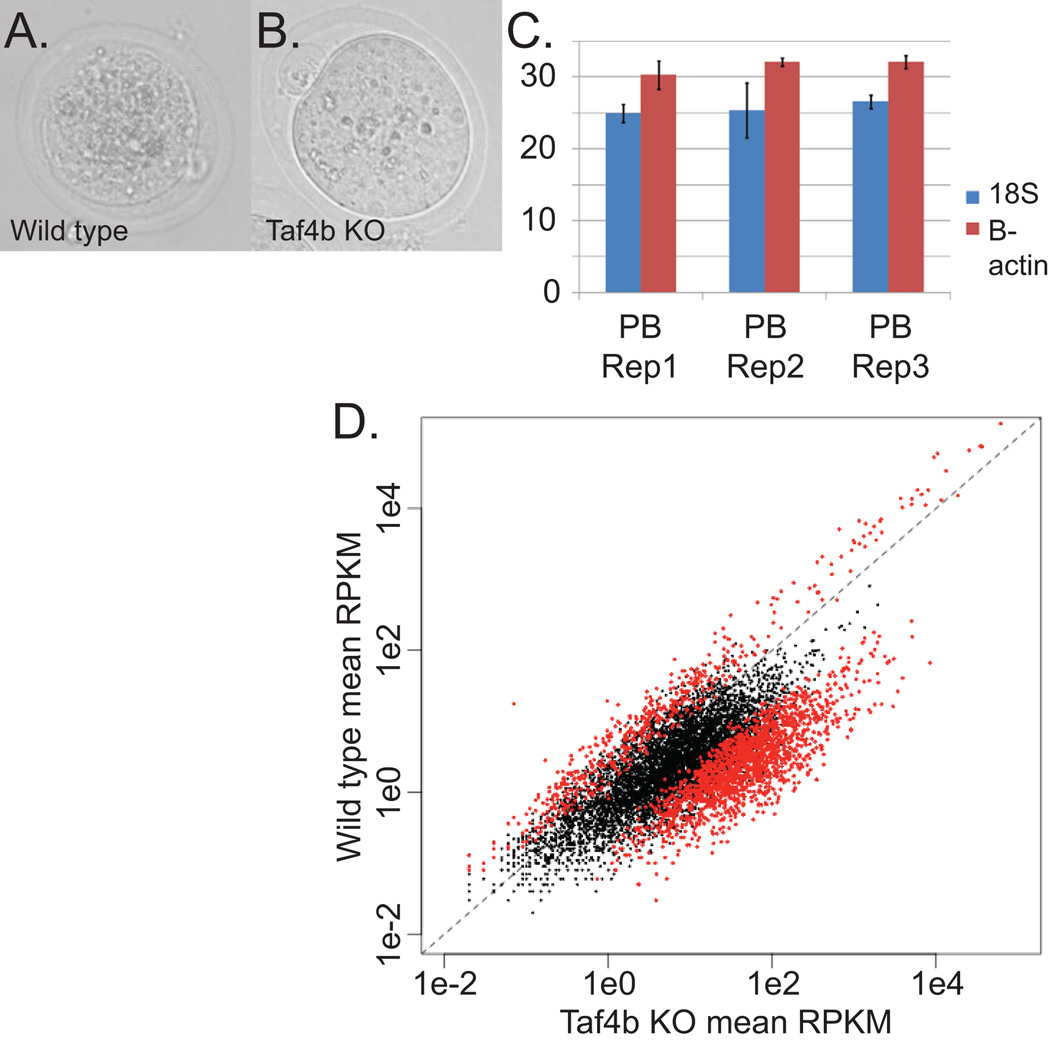
The zygote of sexually reproducing organisms contains a combination of parental genomes, and all subsequent cells of the embryo are derived from this original genotype. Although clonal, it is not known how much genetic variation exists in progeny of this original cell, or between cells of the same lineage resulting from this zygote. Oocytes in mammals, especially humans, have prolonged developmental histories and each may be quite different in terms of gene expression. It is clear that oocyte quality can differ significantly within a cohort, and the variation in early developmental success from each oocyte can be dramatic. Oocyte quality is ultimately best measured by success of the embryo, but other features, such as normalcy of the mRNA population, may be important criteria to identify such potential. Here we test the variation in steady-state levels of mRNAs in mouse oocytes to establish a baseline of “normal” variation, and compare it mRNA levels of individual oocytes of poor quality. We sequenced to saturation the mRNA from 5 wildtype oocyte samples (three individual oocytes, and 2 pools of 5 oocytes each from 2 wildtype mice) and 16 Taf4b-deficient oocyte samples (12 individual oocytes and 4 pools of 5 or 10 oocytes each from 2 Taf4b-deficient mice). The Taf4b-deficient mice are known to have oocytes that appear morphologically normal (Figure 1A and B), but are of poor quality with regards to successful embryogenesis. This genotype was selected as a model for human premature ovarian insufficiency (POI; Lovasco et al., 2010). Taf4b-null animals are viable as adults, but the oocytes they make die prematurely in adults, leading to a POI phenotype, and any oocytes that mature and are fertilized do not develop past the 2–4-cell stage (Falender et al., 2005; Lovasco et al., 2010).
Figure 1.
A, B) Photos of sequenced wildtype and Taf4b-knockout oocytes
C) qPCR was performed in triplicate on the amplified library for beta-actin and 18s rRNA, and the Ct values are reported here. Dil-Oo refers to oocyte samples diluted 100-fold (see text).
D) Knockout vs wildtype means: All genes above the filter are plotted with respect to the log of the average RPKM across all wildtype or knockout samples. Genes with a significant P-value and an FDR less than 0.05 are shown in red.
The hypothesis tested here is that the transcriptome of the Taf4b-deficient oocyte differs significantly from that of the wildtype oocyte. To properly assess this, we also needed to determine the variance between individual oocytes to ascribe significance to the comparison. This data set was generated by high throughput DNA sequencing following transcriptome amplification (Reich et al., 2011) and compared within and between genotypes to determine the variance. To test the fidelity of the amplification process for this protocol, prior to and independent of high-throughput DNA sequencing, oocytes from a wildtype mouse were isolated and pooled before lysing. Following DNase treatment, one oocyte-equivalent was isolated and the cDNA library was synthesized. The resulting library was diluted 100 times, the approximate volume of a single polar body, which is important if a polar body were to be used to determine the oocyte quality without harming the oocyte (Reich et al., 2011). Three samples from this pool were independently amplified, and each technical replicate was tested by qPCR as a measure of the fidelity of the amplification procedure (Reich et al., 2011). Overall, low technical variation was detected, providing confidence in the protocol (Figure 1C). We do not know what kinds of bias the amplification procedure may have, but based on these results, the amplification appears to be consistent. The starting material for a polar body is so limiting, however, that even with this cDNA amplification, qPCR is only able to consistently amplify some transcripts – most rare transcripts have high Ct values, thus the sensitivity of sequencing is therefore preferred.
In order to test the inter- and intra-genotype variation, we collected oocytes from Taf4b-null and wildtype oviducts after ovulation, mechanically and enzymatically stripped of all granulosa cells, and processed the cells for cDNA synthesis and amplification for sequencing as described (Reich et al., 2011). The libraries were sequenced on a HiSeq 2000, and the reads were mapped to the mouse genome (mm9) using TopHat (Trapnell et al, 2009), yielding an average of 219,207 (std. 138,190) mappable reads per sample. These reads were tested for differential expression using edgeR (Robinson, and Smyth, 2007). A total of 11,373 genes were detected across all 21 samples that were also above a filter threshold of greater than 20 raw counts across all 21 libraries, and a total of 3,242 genes were differentially expressed with a false discovery rate (FDR) of <0.05 (Supplemental Table 1). A large number of genes are upregulated in the Taf4b mutant samples, including 3,465 genes undetected in the wildtype samples; 1,037 of these genes achieve significance (Supplemental Table 1 and Figure 1D). The gene-by-gene average of the RPKM (Reads Per Kilobase of transcript per Million mapped reads) from one genetic background is very similar to the average RPKM from another background (Figure 1D). The log-transformed standard deviations of the RPKMs of wildtype and knockout samples (Supplemental Figure 2) closely mirrors the graph of the means of the RPKMs (Figure 1D), suggesting: a) as genes become more abundant, the variation increases, b) different genomic backgrounds have similar rates of variation, and c) assuming the qPCR results from (Figure 1C) represent the technical variability of all genes, then any bias introduced by the amplification process appears significantly less than the biological variability within a population.
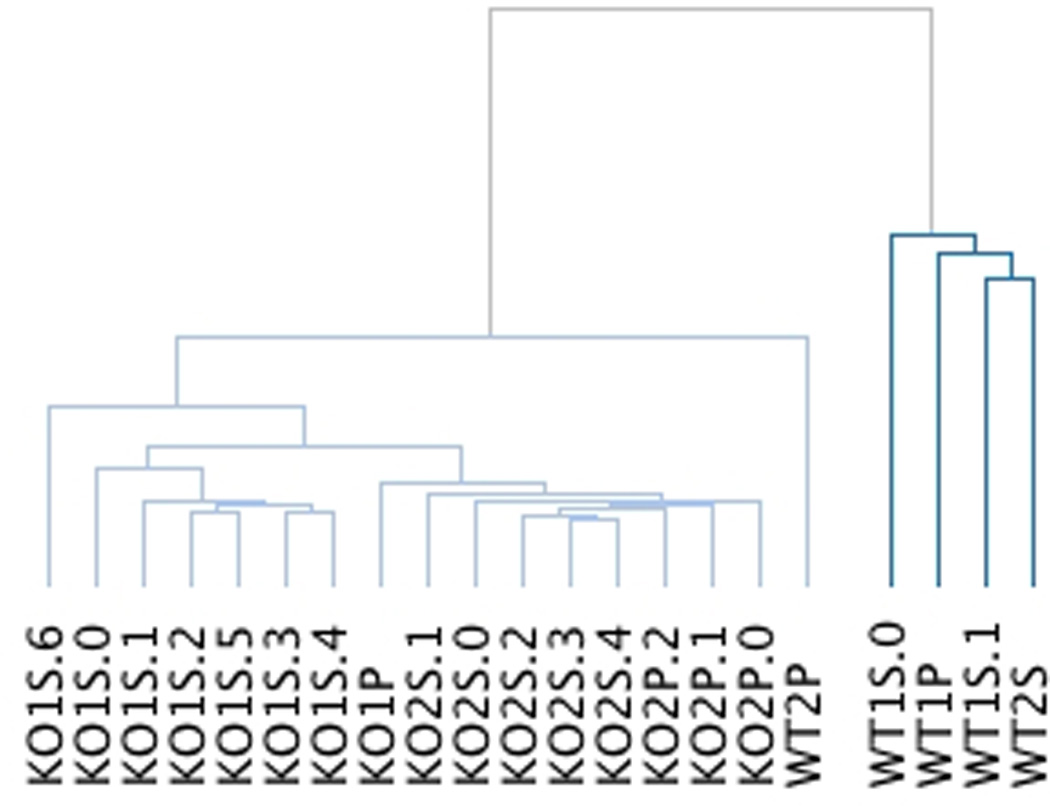
Although the gene-by-gene standard deviation of the RPKM scales linearly with the abundance of the gene, suggesting that samples within a background are similar, we compared how the entire gene set of a sample compared with another sample within the same genetic background and also across backgrounds. The 5 samples isolated from the two wildtype mice (WT1 and WT2) and 16 samples from the two Taf4b mutant mice (KO1 and KO2) clearly segregate by genotype into two main groups; within a group, the samples segregate by mouse to a great degree (Figure 2, and Supplemental Figure 1). Only one of the wildtype samples clustered together with the knockout samples, although the distance between this wildtype sample and all knockout samples (cophenetic distance) is larger than any of the other samples within this group; this indicates that its transcriptional profile is intermediate between the two genotypes.
Figure 2.

Dendogram of 5 wildtype samples and 16 Taf4b-knockout samples showing the high sample-to-sample relatedness within genotypes and even within individual mice (see Supplemental Figure 1 for full details). Each sample name also describes the type of sample and the biological replicate of that type from the same mouse. S=single oocyte and P=pool of oocytes; KO2S.5=knockout mouse #2, single oocyte biological replicate #5.
We conclude that the biological variability of transcriptomes can be quantified between single cells within a genotype, and the comparison between genotypes can reveal genes that are differentially expressed in a robust manner. This approach may help reveal oocyte quality by use of the polar body metric without harm to the oocyte (Reich et al., 2011).
Supplementary Material
The 3,242 genes were selected as significantly different in the two genotypes (FDR<=0.05). Clustering was done on both rows and columns by using (1 - Pearson correlation) as metrics and the average as linkage. Blue corresponds to values less than the mean-value of a given gene across all samples, red corresponds to values greater than the mean value of a given gene across all samples.
Knockout versus wildtype standard deviations. Same data as in Supplementary Table and Figure 1D, here expressed as comparison of log of standard deviations.
All genes with greater than 20 reads across all 21 libraries (11,373) were tested for differential expression with edgeR using TMM normalization, resulting in 3,243 genes with a P-value and FDR less than 0.05. The lengths of all isoforms of all genes were downloaded from ensembl.org and averaged to generate a typical transcript length. This length and the raw counts from the RNA-seq were used to generate the RPKM measurement for all genes. Even though two different normalization metrics were used (TMM and RPKM) for different parts of the data analysis, the two methods agree on which background is enriched for a particular gene, but not always on the scale of the enrichment.
Acknowledgements
We are grateful for the assistance of Erin Paul, Kim Seymour, Kathryn J. Grive and Kirsten Sigrist of the Brown University Transgenic Facility for multiple oocyte collections and Dr. Christoph Schorl of the Brown Genomics Facility for next generation sequencing. We are grateful for computational resources and services provided by the Center for Computation and Visualization at Brown University.
Grant Sponsorship: We are grateful for support of this research from NIH AG028753to NN, NIH 1RO1HD065445 to RNF, and NIH 2R01HD028152 to GMW and supported in part by the cyber-infrastructure enabled by National Science Foundation RII-C2 EPSCoR Grant No. EPS-1005789. We are also grateful for the support of the transgenic and genomic facilities at Brown that are supported by a type III COBRE award NCRR P30 RR031153.
References
- Falender AE, Shimada M, Lo YK, Richards JS. TAF4b, a TBP associated factor, is required for oocyte development and function. Dev Biol. 2005 Dec 15;288(2):405–419. doi: 10.1016/j.ydbio.2005.09.038. [DOI] [PubMed] [Google Scholar]
- Grøndahl ML, Yding Andersen C, Bogstad J, Nielsen FC, Meinertz H, Borup R. Gene expression profiles of single human mature oocytes in relation to age. Hum Reprod. 2010 Apr;25(4):957–968. doi: 10.1093/humrep/deq014. Epub 2010 Feb 10. [DOI] [PubMed] [Google Scholar]
- Lovasco LA, Seymour KA, Zafra K, O'Brien CW, Schorl C, Freiman RN. Accelerated ovarian aging in the absence of the transcription regulator TAF4B in mice. Biol Reprod. 2010 Jan;82(1):23–34. doi: 10.1095/biolreprod.109.077495. (2010). Epub 2009 Aug 14. [DOI] [PMC free article] [PubMed] [Google Scholar]
- Reich A, Klatsky P, Carson S, Wessel GM. The Transcriptome of a Human Polar Body Accurately Reflects its Sibling Oocyte. J. Biological Chemistry. 2011;286:40743–40749. doi: 10.1074/jbc.M111.289868. PMCID: PMC3220517. [DOI] [PMC free article] [PubMed] [Google Scholar]
- Robinson MD, Smyth GK. Moderated statistical tests for assessing differences in tag abundance. Bioinformatics. 2007 Nov 1;23(21):2881–2887. doi: 10.1093/bioinformatics/btm453. (2007). Epub 2007 Sep 19. [DOI] [PubMed] [Google Scholar]
- Trapnell C, Pachter L, Salzberg SL. TopHat: discovering splice junctions with RNA-Seq. Bioinformatics. 2009 May 1;25(9):1105–1111. doi: 10.1093/bioinformatics/btp120. (2009). Epub 2009 Mar 16. [DOI] [PMC free article] [PubMed] [Google Scholar]
Associated Data
This section collects any data citations, data availability statements, or supplementary materials included in this article.
Supplementary Materials
The 3,242 genes were selected as significantly different in the two genotypes (FDR<=0.05). Clustering was done on both rows and columns by using (1 - Pearson correlation) as metrics and the average as linkage. Blue corresponds to values less than the mean-value of a given gene across all samples, red corresponds to values greater than the mean value of a given gene across all samples.
Knockout versus wildtype standard deviations. Same data as in Supplementary Table and Figure 1D, here expressed as comparison of log of standard deviations.
All genes with greater than 20 reads across all 21 libraries (11,373) were tested for differential expression with edgeR using TMM normalization, resulting in 3,243 genes with a P-value and FDR less than 0.05. The lengths of all isoforms of all genes were downloaded from ensembl.org and averaged to generate a typical transcript length. This length and the raw counts from the RNA-seq were used to generate the RPKM measurement for all genes. Even though two different normalization metrics were used (TMM and RPKM) for different parts of the data analysis, the two methods agree on which background is enriched for a particular gene, but not always on the scale of the enrichment.


