Abstract
A single-arm interferometer based optical coherence tomography (OCT) system known as common-path OCT (CPOCT) is rapidly progressing towards practical application. Due in part to the simplicity and robustness of its design, Fourier Domain CPOCT (FD-CP-OCT) offers advantages in many endoscopic sensing and imaging applications. FD-CP-OCT uses simple, interchangeable fiber optic probes that are easily integrated into small and delicate surgical tools. The system is capable of providing not only high resolution imaging but also optical sensing. Here, we report progress towards practical application of FD-CP-OCT in the setting of delicate microsurgical procedures such as intraocular retinal surgery. To meet the challenges presented by the microsurgical requirements of these procedures, we have developed and initiated the validation of applicable fiber optic probes. By integrating these probes into our developing imaging system, we have obtained high resolution OCT images and have also completed a demonstration of their potential sensing capabilities. Specifically, we utilize multiple SLEDs to demonstrate sub 3-micron axial resolution in water; we propose a technique to quantitatively evaluate the spatial distribution of oxygen saturation levels in tissue; and we present evidence supportive of the technology’s surface sensing and tool guidance potential by demonstrating topological and motion compensation capabilities.
Index Terms: Optical tomography, Biomedical optical imaging, Optical fibers, Optical interferometry
I. Introduction
Optical coherence tomography (OCT) has recently emerged as a valuable 3-D imaging technology for medical applications [1–3]. One of the earliest uses of optical interferometic techniques in ophthalmology was to accurately measure the thickness of cornea [4, 5]. With additional technological and commercial refinements, OCT is extensively used in the assessment of ocular pathology with highest clinical utility in the area of diagnostic assessment of macular disease in the retina. The earlier interferometic technique used by Fujimoto et al [4] was based on femtosecond Michelson interferometry, whereas Fercher et al [5] used a simpler common-path inteferometric method. Since then the Michelson interferometer based OCT has emerged as the technique of choice. A key factor in the emergence of the Michelson interferometer was its use of a high peak power femtosecond laser that allowed for increased resolution and a higher signal to noise ratio. Since first application to clinical retina in the field of ophthalmology, OCT scanning has emerged as one of the most utilized diagnostic applications in the field [6]. Ophthalmological application has proven to be a particularly applicable field for OCT applications due in part to the relative transparency of relevant eye tissues such as the cornea and retina [7]. In the last decade numerous technological breakthroughs have been made and OCT now offers unparalleled resolution in real time [8–27]. One relatively unexplored yet promising application of OCT is in the area of endoscopic 3-D imaging and optical sensing. Endoscopic optical coherence tomography (EOCT) is however associated with significant technical challenge that leads to a choice between reduced imaging sensitivity or a significant increase in the level of technical complexity of the required system [28]. Ultrahigh resolution EOCT is even more difficult to implement because of the issues of polarization and dispersion mismatch (over a wide range of wavelengths) between the two arms of the Michelson interferometer [29]. However, each of these difficulties has been largely addressed via a strategic choice of components and ingenious system design.
Despite great progress in the development of Michelson interferometer based technologies there remains significant interest in further development of common-path interferometer based OCT technology. The common-path approach utilizes a simple interferometer design where the sample and reference arms share a common path. This allows a much simpler system design, lower associated costs and the ability to use interchangeable probes as well as the freedom to use any arbitrary probe arm length. A common-path interferometer based frequency-domain OCT (FDOCT) has been reported [30] and other common-path interferometer based approaches for time-domain OCT, using a free space interferometer, have also been demonstrated with limited success [31, 32]. In the last several years, there has been rapid development in the fiber optic based technologies that is applicable to both frequency-domain and time-domain common-path OCT systems [33–39].
The fiber optic common-path OCT is compatible with existing endoscopic medical instrumentation. In recent years we have been developing functional Fourier domain common path optical coherence tomography (FD-CP-OCT) for its potential application in the field of microsurgery with intraocular surgical applications relevant to retinal surgery as the model application [40, 41]. In this paper we will describe in detail the results of our recent progress towards practical FD-CP-OCT microsurgical application. Section II details an overview of FD-CP-OCT theory as well as the general experimental setup. In section III we briefly discuss a CP-OCT fiber optic probe design with integration of a simple surgical tool, in this case a surgical needle. Section IV details our experimental results following intraocular 3D, in vivo imaging of ocular tissue in a fish eye model. Section V details experimental results and a processing method to obtain ultra-high axial resolution. Section VI presents an analysis method and experimental results from oxygen saturation (SO2) measurement experiments. Finally, Section VII presents a method and demonstration of FD-CP-OCT based topological and motion compensation.
II. Fourier Domain Common Path OCT
A. System Configuration
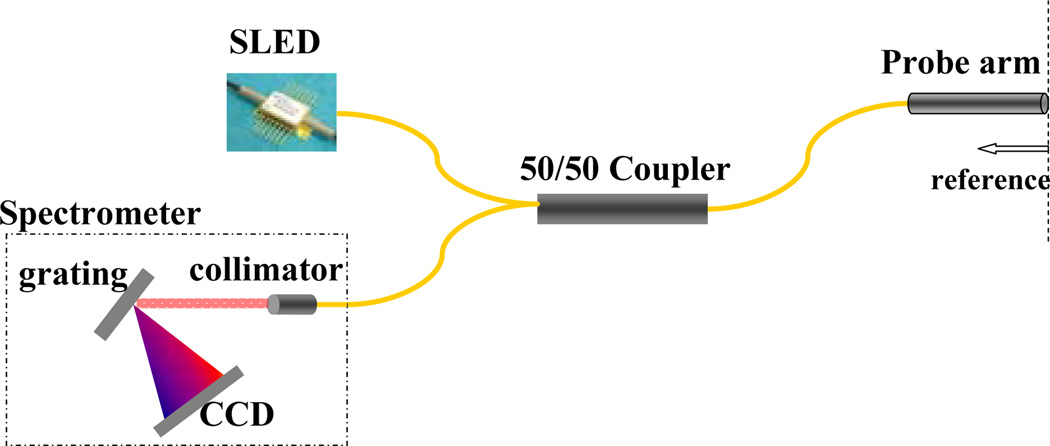
The schematic of a simple and cost effective FD-CP-OCT system is shown below in Fig. 1. The interrogation of a target starts from a broadband source which couples to one of the arms of a fiber coupler and exits out to the probe arm, which acts as both the sample and the reference arm. The reference signal is obtained from a partial reflector near the distal end of the probe arm. The reference and the signal couple back to the fiber and exit out of the 3rd arm of the fiber coupler to the optical spectrometer and the resultant spectrum is analyzed to obtain a longitudinal image. Commercial superluminescent diodes (SLED) from Exalos were used as broadband sources. The spectrometer was in-house built using a 2048 pixel Aviva line scan camera from e2v Technologies. The spectrometer is capable of up to 28K line scan per second.
Fig. 1.
Schematic diagram of a FD-CP-OCT system.
B. Signal to Noise Ratio (SNR) study
The FD OCT signal amplitude can be written as [42],
| (1) |
Speak is a dimensionless quantity. Here, S is spectrometer efficiency, η is detector quantum efficiency, τ is CCD exposure time, N is the number of CCD pixels. h is the Planck constant, υ0 is the center frequency of the light source spectrum. Ps is sample power, and Pr is reference power. In the system, optical energy incident onto each pixel is detected and digitized by CCD system. The summation of counts at all the pixels is proportional to the optical energy incident on the spectrometer. Npr and Nps are summations of counts corresponding to the reference power and the sample power, respectively. We can readily obatin Npr and Nps using Eq. (1).
However, Eq. (1) assumes reference and sample light are perfectly coherent, which is not practically valid. First, the experimental pulse spread function (PSF) is broader than the theoretical PSF, which means that the signal amplitude has to be diminished to conserve energy. Second, the interferometer is not an ideally sinusoidal signal modulator. For the above reasons, the measured peak amplitude of A-scan obtained by Fourier transforming the interferogram is much smaller. Taking the ratio into consideration, the SNR can be expressed as
| (2) |
where σ2noise is the noise. The main noise sources in FD OCT systems are receiver noise, shot noise and excess noise.
The excess noise of the CP- FD-OCT is given by
| (3) |
Here, V is the degree of polarization and δv' = Δveff/N. Δveff is the effective spectral line width [12].
Shot noise is given by
| (4) |
If we assume the noise originated from each CCD pixel is additive, independent and white, than they combine incoherently after FFT. In other words, they add in intensity instead of amplitude. The total noise after FFT is then given by
| (5) |
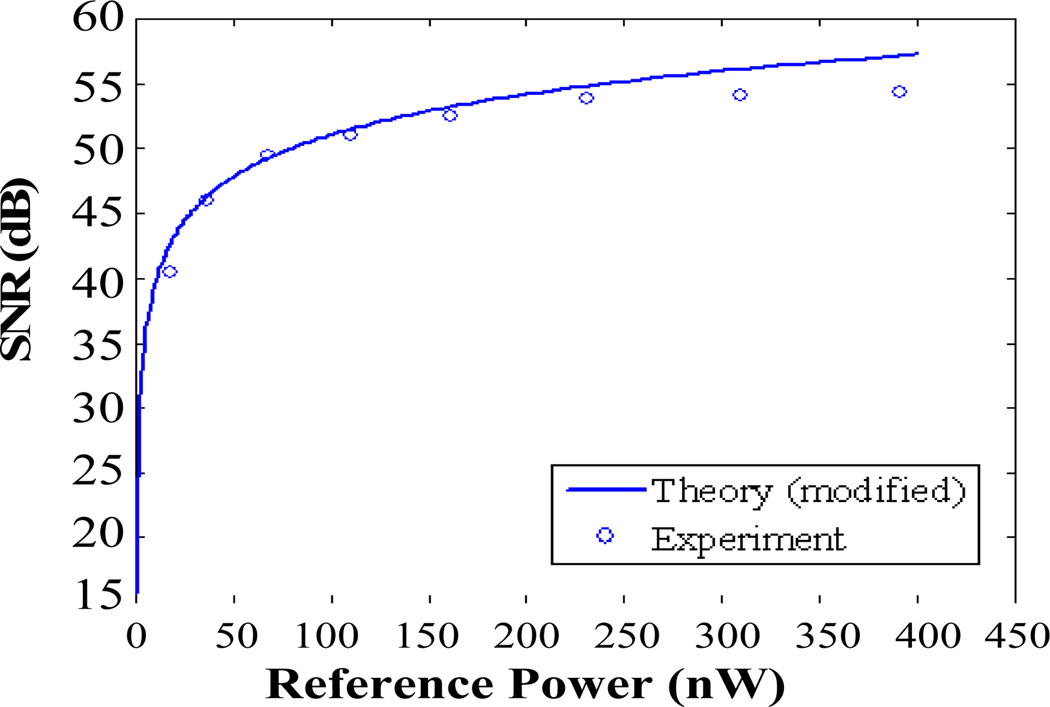
A mirror is used as a sample for analyzing SNR of the system. Only does a small fraction of light reflected by the mirror couple back to the probe. We changed the source power, while keeping the mirror and fiber probe fixed. The curve in Fig 2 shows SNR as a function of reference power calculated by Eq. (5), and the open circles are the measured value.
Fig. 2.
Theoretical and experimental SNR as function of reference power.
It is noted that the SNR calculated by Eq. (2) and experimental SNR match well in Fig. 2. This result shows our noise model is reasonable, but Eq. (1) overestimates the signal amplitude.
III. Common-Path Endoscopic Fiber Optic Probe
Endoscopic fiber optic probes for FD-CP-OCT, in order to be integrated into existing surgical catheters and needles for assisting microsurgeries, needs to be simple and small. In order to achieve these design objectives we have devised fiber optic probes that use Fresnel reflection at the distal end of the fiber as a reference. For operating in air, a simple end-cleaved fiber probe works well. However, for the cases where the optical probe needs to work in an intra-vitreous and/or intra-ocular environment, Fresnel reflection dramatically decreases from 3.59% to 0.24% due to the reduced refractive index difference between optical fiber and aqueous medium. For relatively high incident laser powers > 0.2mW, this in fact increases the SNR of the system and better OCT images can to be obtained. However, for low power levels < 0.2mW, a higher reference level is needed in order to maintain an appropriate level of SNR. To achieve this, we have coated the distal end of fiber with thin gold (Au) film. Thus, the reference amplitude does not depend on the reflectivity of the interface media even when the probe is submerged in the liquid or in contact with the tissue. Gold was chosen because it is chemically stable and bio-medically safe for medical applications. Here, no focusing lens was implemented with the Au-coated fiber probe (Au-FP) in order to limit the probe size to the current fiber diameter of 125µm, as well as not to introduce any unwanted reflections from between the components. We have experimentally measured the lateral resolution and the working distance of the bare fiber probe and these were found to be ~ 28 microns at 1 mm from the fiber probe tip and 3mm, respectively. Au-FP was fabricated using a standard sputtering process. Au-FPs were fabricated from standard single-mode optical fibers. The fiber was cleaved using an ultrasonic cleaver (FK11) and a thin-film gold-palladium (Au-Pd) alloy was deposited on the end-face using a standard sputtering technique (Denton Vacuum DESK II). The palladium (Pd) alloy helps the gold layer deposit evenly in a (few tens of nanometer thin) uniform coated layer without beading as could otherwise result from the surface tension of the pure gold.
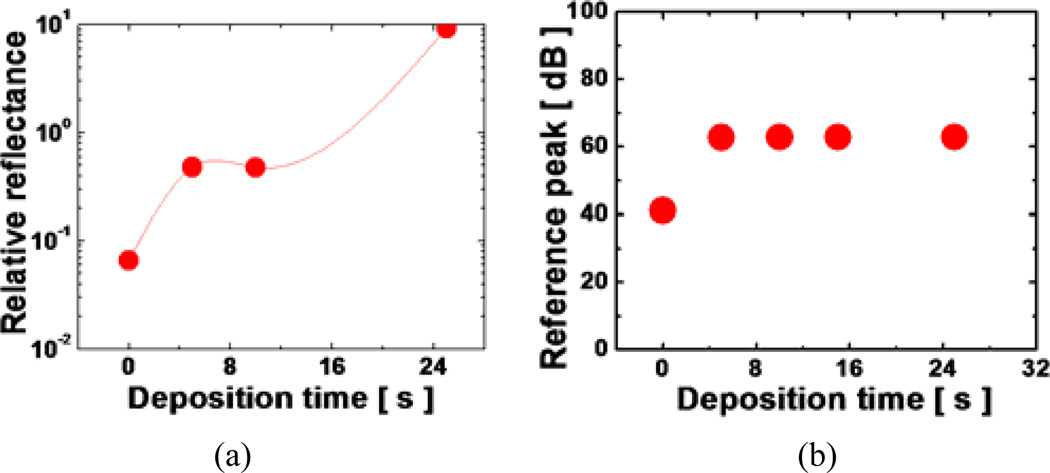
We performed Au-deposition for 0s (0s represents for normal bare fiber without coating), 5s, 10s, 15s, and 25s and the applied incident power of 1mW for testing. For less than or equal to 15s of Au-thin film deposition, we were able to achieve a stable level of reflectance in the water. As expected, the reflectance without any coating (0s) becomes ~1/15 compared to the value in the air from 3.59% to 0.24%. However, with more than 15s of deposition, the layer thickness became too thick and the metal layer acted as a highly reflective mirror. The resulting reflectance was too large and did not permit any light transmission. An ideal deposition time was found to be around 15s which provided an ideal thickness of the coated layer which resulted in approximately 1.7% reflection in the water which is more than 7 times greater than that without the coating. Afterwards, Au-FP was then integrated into a metallic hypodermic needle. B-mode lateral scanning was achieved simply by sweeping the whole probe using with a stepper motor.
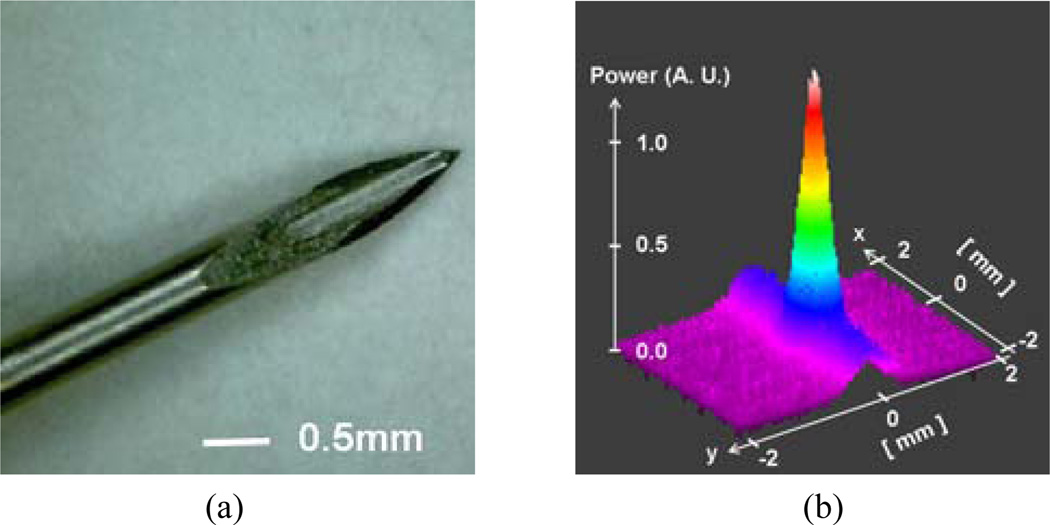
Fig. 3(a) is a magnified microscope image of a fiber optic probe integrated into a 24-gauge surgical needle where the diameters of the needle and fiber (cladding) are ~500µm and 125µm, respectively. A sample two-dimensional far-field beam profile of the fiber probe was measured by an infrared (IR) CCD camera as shown in Fig. 3(b) in which the correlation between the beam profile and the perfect Gaussian shape is greater than 0.9 and the ellipticity, which is the ratio between the smaller and larger beam widths, was larger than 0.95. The reflectance of the Au-FP in water is shown in Fig. 4(a) where it is normalized to the reflectance in the air (3.59%) for comparison. The result shows that the one can obtain the same amount of reference as a glass-air interface from the gold coated probe in water when the deposition time is greater than 15 seconds. The deposition time of gold linearly relates to the total film thickness. The corresponding reference level in the OCT system is shown in Fig. 4(b). The reference peak saturates for the deposition time greater than ~7 seconds to ~62dB above the noise level. Furthermore, the Au-coated probe showed no Fresnel reflection dependence on the interfacing medium. Uncoated fibers showed the same ~62dB peak in the air but it was dropped by more than 20dB in the water.
Fig. 3.
OCT probe: (a) OCT fiber probe integrated surgical needle (prototype); (b) output beam far field profile.
Fig. 4.
Characteristics of reference magnitude in aqueous medium: (a) ratio to the reflectance in the air; (b) reference amplitude level at 1mW source power.
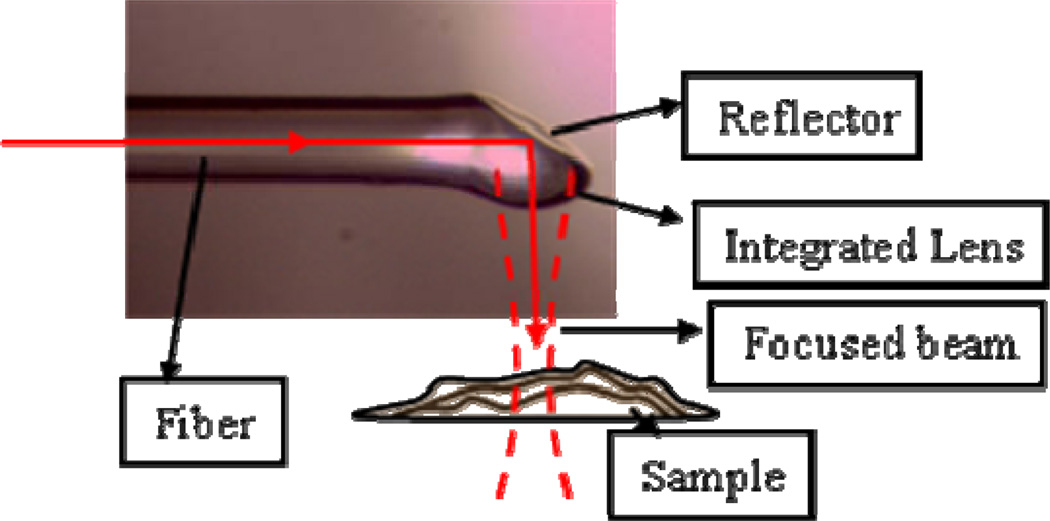
We have also demonstrated integrated side viewing probes as shown in Fig. 5. This design can also easily integrate into different microsurgical tools. The details of such probe design will be reported elsewhere. In addition, we are developing fiber bundle based probe system which would eliminate the need for the physical sweeping of the probe for the B-mode imaging.
Fig. 5.
Picture of a side viewing fiber probe with integrated lens.
IV. OCT Imaging
A. Intraocular Tissue Imaging
The CP-FDOCT system set-up for imaging is the same as that shown in Fig. 1. The source is a SLED light source centered near 0.8µm (40nm width), a fiber optic directional 2×1 coupler, a fiber probe, and a high resolution spectrometer. The integrated probe consists of a bare single mode fiber (the numerical aperture of the fiber is 0.14) having a core size of ~5.7µm and outer polymer buffer diameter of ~240µm which is inserted and bonded to a 25-gauge hypodermic surgical needle having inner diameter of 0.24mm, outer diameter of 0.5mm, and 1-½″ in length. For imaging the cornea, the subject eye was placed vertically to simulate a potential operating position. In order to reduce the strong surface reflection from the cornea and keep the sample from drying out, we submerged the sample in a solution of isotonic (0.9%) NaCl saline (index ~1.33). The specimen used were eyes from Spirinchus lanceolatus (or simply Shishamo) fish and Engraulis japonicus (or simply anchovy) fish.
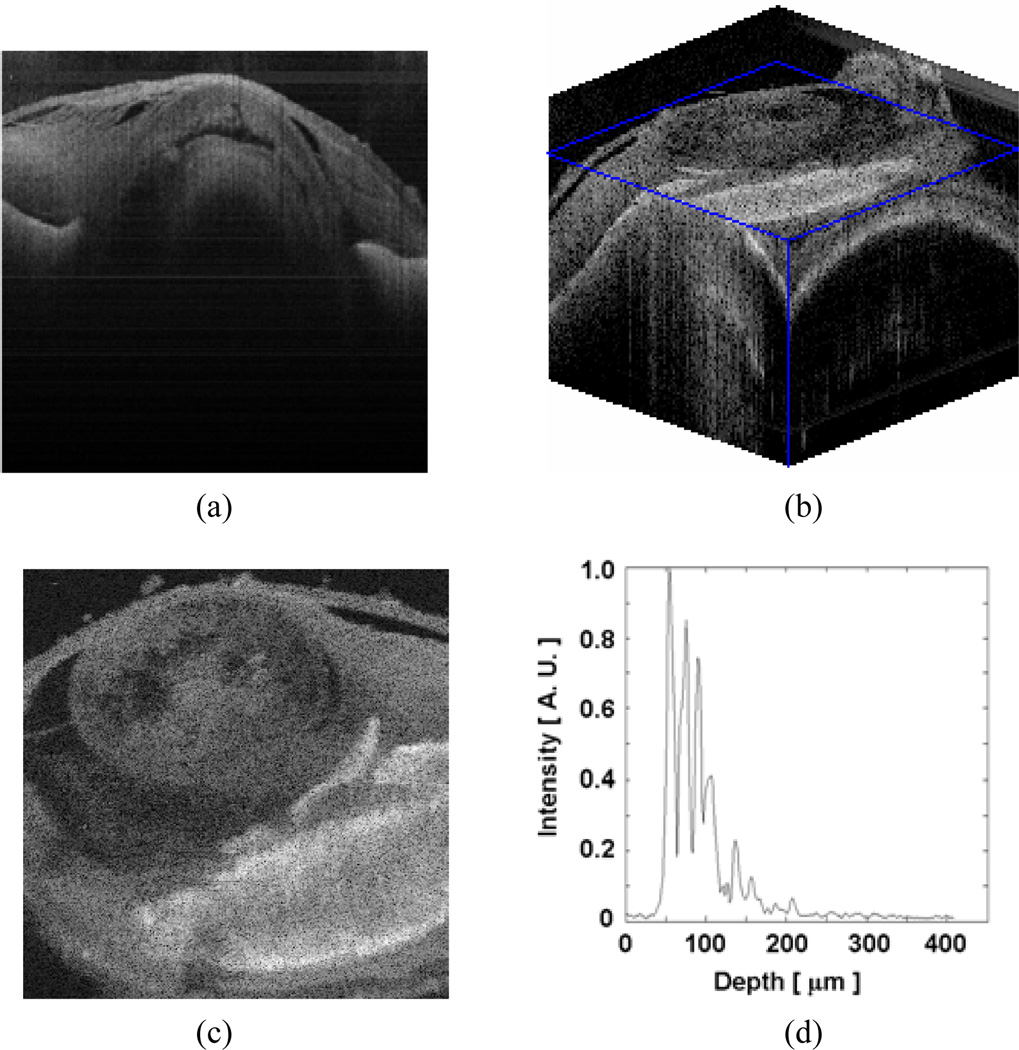
For the lateral scans (B-mode and C-mode), the probe was fixed to the two-dimensional linear translational stage with stepper motors in the×and y –axes, and with a high accuracy (step size between 1~5µm). The measured axial resolution (~8µm in air) in the A-mode scan matched well with the theoretical resolution determined by the source coherence length. With an eye of Spirinchus lanceolatus, we performed lateral B-scan of the cornea with 2µm step size. The anterior chamber (index ~1.336), lens and iris edge can be observed in Fig. 6(a) (image size: 3mm × 0.86mm). We can also clearly observe detailed features inside of the ocular tissue (e.g. cyctic spaces seen as dark colored spots). We then performed a 3D scan on an eye from Engraulis japonicus, with both B-scan and C-scan steps of 5µm. Fig. 6(b) displays the 3D sliced volume of 2000µm × 2000µm × 860µm, and Fig. 6(c) is an en face image reconstructed from the volume data at a depth of ~150µm from the anterior cornea. The lens structure and the iris are clearly visible. The retinal structures are evidenced by numerous peaks in Fig. 6(d). Retinal OCT is frequently used to assess retinal thickness and to evaluate pathology presenting as an altered pattern of reflective interfaces in clinical medicine.
Fig. 6.
Scanned OCT images of intraocular tissues: (a) Cornea (2-D, spirinchus lanceolatus); (b) Cornea (3-D, engraulis japonicus); (c) Cornea en face image reconstructed from b at depth=150µm; (d) retina (1-D, rat).
B. Polarization dependent imaging of birefringent beef sample
It is known that many tissues exhibit polarization dependent scattering and reflection [43]. This can lead to enhanced imaging for OCT systems that are capable of discriminating between different polarizations [44]. To test whether this principal is applicable to CP-OCT, we built a simple set-up in which to conduct preliminary testing. To control the polarization, fiber type circular retardation plates have been introduced and inserted between the bare fiber probe and the directional fiber coupler for manipulating the birefringence of the sample. The rest of the system is identical to the one presented in the previous section. The test tissue was a piece of fresh beef in this preliminary evaluation.
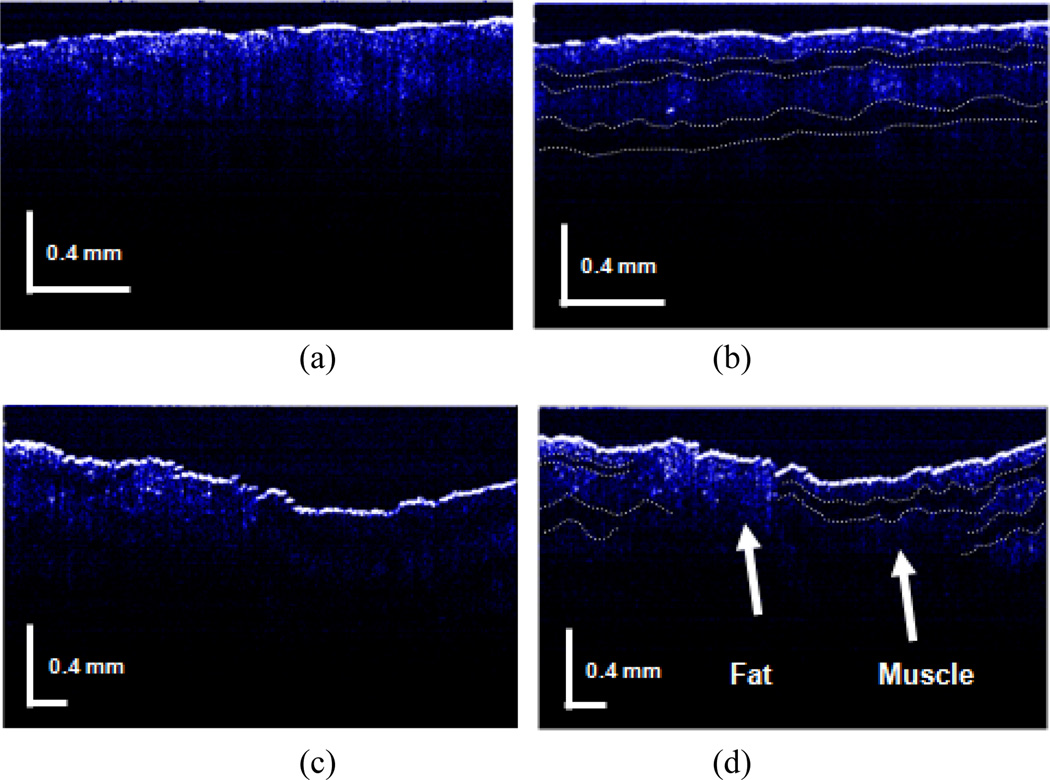
The tomograms of a fresh beef sample were compared in Fig. 7 for different polarizations and positions in the specimen. If the polarization was not discriminated, the OCT image would appear simply as a depth-resolved intensity profile. By controlling the polarization, we can obtain images that have different features depending on the collagen tissue characteristics. This is shown in Fig. 7(b) with dotted lined layers where clearer layered configuration for than that of Fig. 7(a) can be seen. In case of fat and muscle, they have different scattering features so that a larger signal contrast between them occurs in birefringence-matched case. This is shown in Fig. 7(d) where the clear interface between fat and muscle tissues can be seen compared to that in Fig. 7(c).
Fig. 7.
Polarization dependent FD CPOCT images of birefringent beef sample: (a) without polarization control (muscle only); (b) with polarization control (muscle only); (c) without polarization control (Fat and muscle interface); (d) with polarization control (Fat and muscle interface).
V. Simple High Resolution OCT using Multiple SLEDS
A. High Resolution CP OCT and signal processing
The main challenge of constructing an ultrahigh resolution OCT system is the dispersion compensation between reference and sample arm of the interferometer. This is because an extremely broadband source with a bandwidth larger than 100nm is required for a system and there is a large amount of dispersion between the two arms as a result. Both hardware and software compensations have been applied to make the axial resolution approach the theoretical value [45]. The hardware compensation requires extra optical components and precise alignment that together, complicate the system. When OCT is used to image retina, the dispersion induced by the eye varies between the subjects, hence the system requires the ability to adjust compensation for each subject. In terms of software compensation [46] using an iterative algorithm is usually time consuming and hence is not applicable for real time processing.
The shared sample and reference arm in CP OCT helps to circumvent the problem of dispersion mismatch, which makes it appropriate for high resolution OCT imaging. Nevertheless, the CP-OCT does not compensate for the dispersion arises from the sample and the extent to which this affect CP-OCT is same as that in the Michelson interferometer based OCT systems. We built an ultrahigh resolution FD CP OCT using three combined SLEDs [47] as the broadband source. There have been a number of reports that have used multiple SLEDs with different central wavelengths to increase the effective bandwidth and hence axial resolution. However due to the phase and amplitude dissimilarities between the SLEDs, optimum imaging results have not been obtained when used in conventional OCT systems. To solve problems caused by the asymmetrical and non-Gaussian shaped source spectrum, Wiener deconvolution [48, 49] and spectral shaping [50] were used to process the data. The resolution obtained in our three-source FD CP OCT without any dispersion compensation effort was 3.6µm (in air).
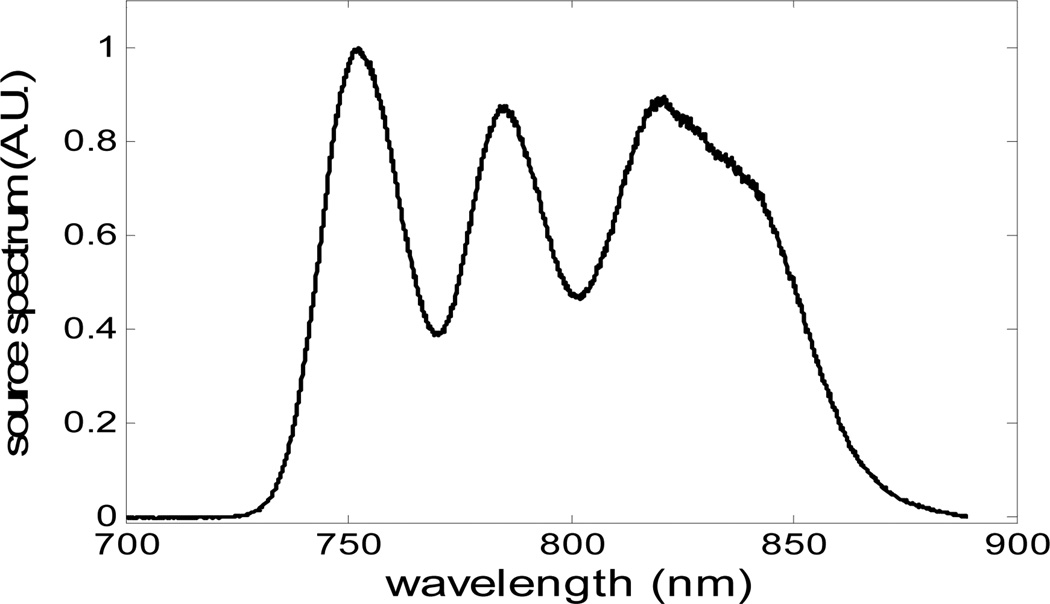
The single SLED source FD CP OCT described in Part II was replaced with a broadband source made up of three multiplexed SLEDs to obtain higher axial resolution. By adjusting the ratio of output power of each source, we are able to optimize the overall spectral shape of the source. Fig. 8 shows the spectrum of the combined source, with Full Width Half Maximum of 106nm and central wavelength of 800nm. The broad bandwidth of the combined source results in a very narrow PSF, however, the ripples within the band would cause sidelobes in PSF that would blur the image.
Fig. 8.
Source spectrum by combing three SLEDs.
In order to compare the differences in resolution, SNR and sidelobe suppression of the three signal processing methods considered, we applied three signal processing algorithms to extract the OCT signal from the interfered spectra. The methods compared include:
Standard signal processing procedure for FD OCT: The data is re-sampled to wave number space after reference power is subtracted from the interference data and Fast Fourier Transformation (FFT) is performed;.
Spectral shaping: The spectra were shaped to have a Gaussian envelope g(λ), which has the same central wavelength and the same e−2 bandwidth as source spectrum, g(λ) centers at 800nm and has FWHM bandwidth of 70nm. This is followed by the processing described in 1 to obtain OCT image;
Weiner deconvolution: Weiner filter W(k), designed to minimize the error between the restored and the original signal in the mean squared sense, is used to filter the interfered spectrum. W(k)= S*0(k)/[ |S0(k)|2+SNR−1], where S0(k) is the source spectrum, k is wave number k=2π/λ. The resulting filtered data was analyzed by the procedure described in 1.
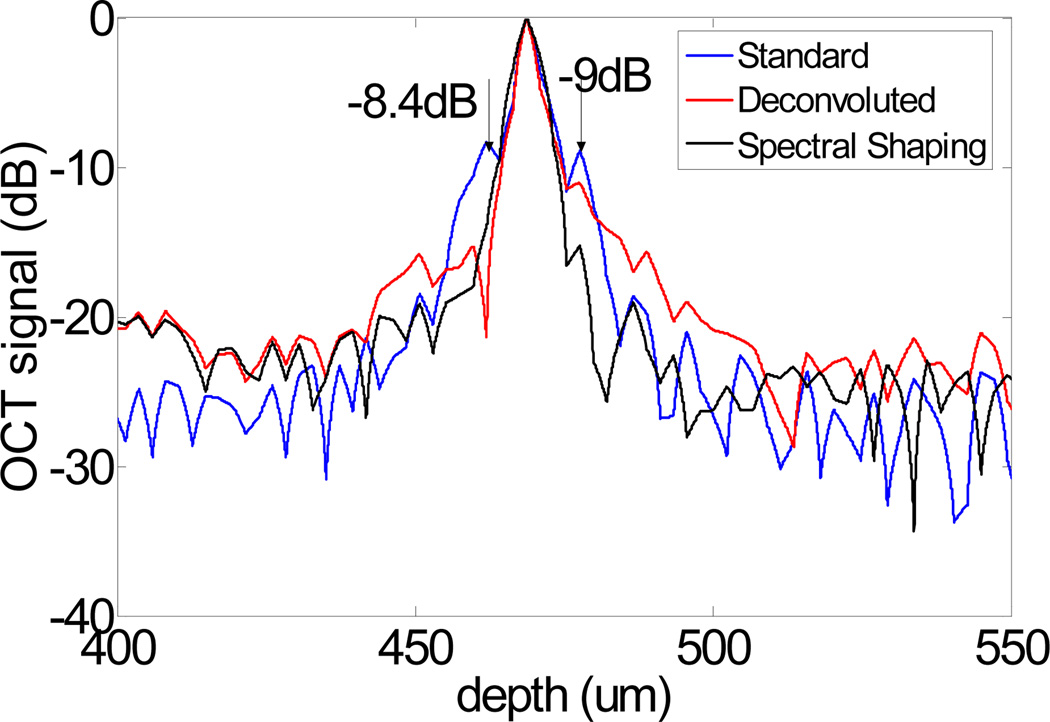
To characterize the resolution of our system and the different methods, we theoretically calculated the PSF by Fourier transforming the source spectrum S0(k), and experimentally measured the PSF by using a mirror as a sample and processed the data with the standard FD OCT signal processing procedure. The theoretical PSF has a 2.7 µm FWHM and the experimental PSF has a 3.6 µm FWHM. The spectra are also processed by the other two abovementioned methods to obtain OCT A-scans. The results are plotted in Fig. 9, which clearly show that the sidelobes can be effectively suppressed by the deconvolution and spectral shaping methods used.
Fig. 9.
Coherence function obtained from a mirror in air processed with different algorithms.
B. Results
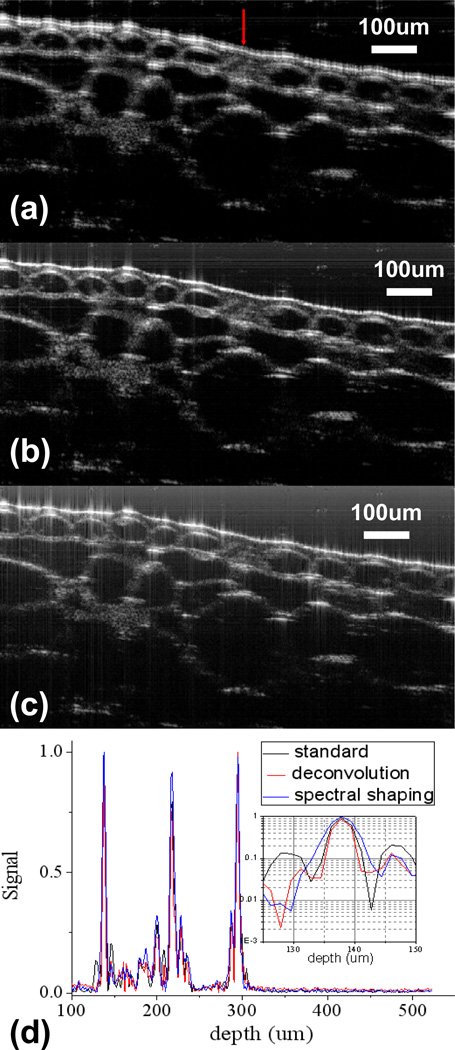
Fig. 10 shows the images of onion obtained by different signal processing methods. In addition, we also compared the A-scans obtained of onion by different methods in Fig. 10(d).
Fig. 10.
Oct images of an onion: (a) an image obtained by standard signal processing procedure for FD OCT; (b) an image obtained by spectral shaping; (c) an image obtained by deconvolution; (d)comparison of a-scan signal at lateral position indicated by the arrow in (a).
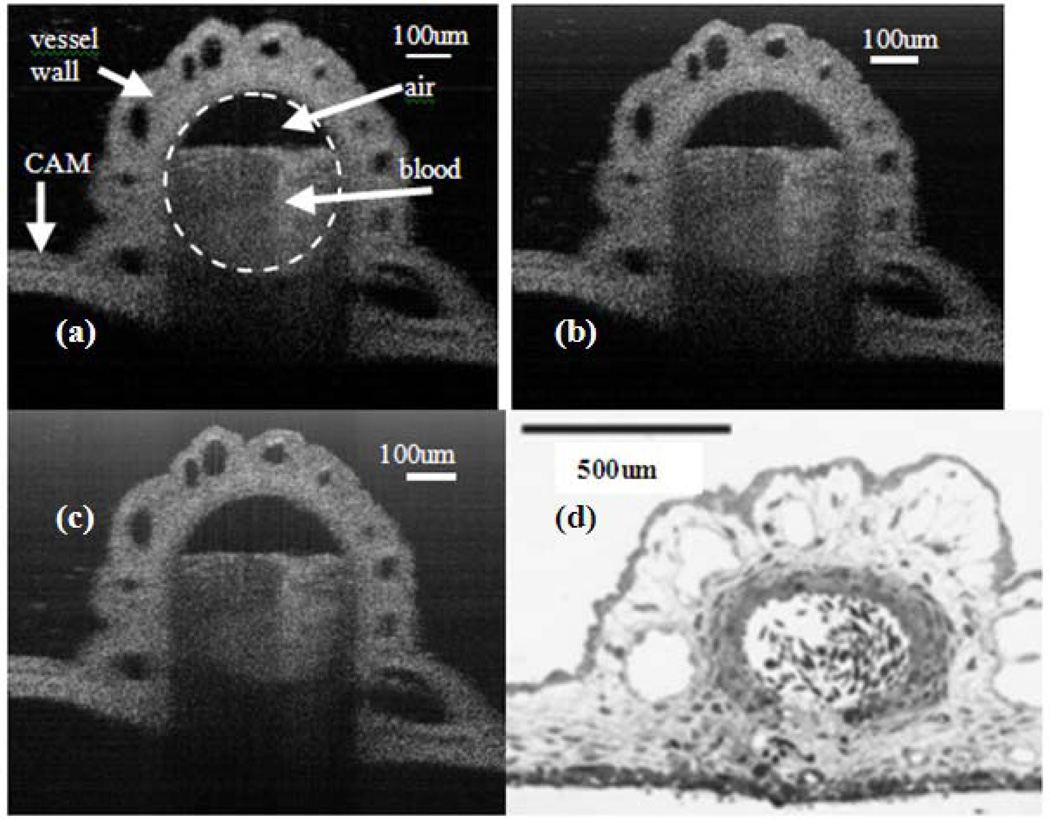
We also imaged a blood vessel in the chicken embryo chorioallantoic membrane (CAM) and the results are shown in Fig 11. CAM is commonly used as a model tissue for surgical retinal research [51]. As a reference, Fig.11(d) shows the histological cross-section of a blood vessel at CAM [51].
Fig. 11.
OCT images of a vessel at Cam (a) image obtained by standard signal processing procedure for FD OCT (b) image obtained by spectral shaping (c) image obtained by deconvolution (d) Histological cross-section of a blood vessel at CAM.
Notably, Fig. 10(a), (b) and (c) were obtained by using the same raw spectral data to form images, so were Fig. 11(a), (b) and (c). These results demonstrated that Weiner deconvolution and spectral shaping can effectively suppress sidelobes in scattering samples other than the specular surface. However, as shown in Fig. 11, Weiner deconvolution and spectral shaping did not improve the quality of vessel images to the extent that the onion images were improved. Onion possesses clear imaging boundaries that are highly reflective, while the vessel in CAM does not have these optically favorable boundaries.
C. Discussion
In this study, two signal processing algorithms are applied to deal with the non-Gaussian shape of the source spectrum, in addition to the standard FD OCT processing. Both of the methods effectively suppress the blur caused by source spectrum modulation. The drawback of deconvolution is an increased noise level. The spectral shaping method seems to provide a good balance between sidelobe suppression and SNR, but this comes at the expense of a small loss of resolution. The improvement in image quality also depends on the property of samples. A sample, such as onion, with high-reflectivity specular boundaries will have ghost signals if the data were analyzed directly by FFT. Weiner deconvolution and spectral shaping can improve this artifact and hence the image quality significantly. For samples lacking large changes in the reflectivity, such as the CAM vessel that was imaged, standard processing procedures are sufficient to obtain high resolution OCT images.
Whether or not the deconvolution can be effectively used on OCT image is questionable. Nevertheless, our goal of using the deconvolution algorithm is to suppress the sidelobes caused by the ripples in the source spectrum, in order to better identify the highly reflective boundaries. This objective has been achieved as shown in Fig.10 (c). However, there are several problems exist. The prerequisite of using Weiner deconvolution is that the noise in the system is additive and the spectrum is known. However, as in any other coherent imaging modalities, there exists speckle noise in OCT, which is not additive. Therefore, Fig. 10 (c) still contains speckled noise. A speckle reduction algorithm [52] might further improve the image quality. Moreover, the frequency dependency of SNR is not clear, because the noise spectrum also depends on the sample structure, which is unknown in prior. For simplicity, we use the same estimated signal to noise ratio for the whole spectrum. In other words, we assumed the white noise, which is not completely accurate as discussed before. This is why we have a broadened pedestal in our deconvoluted image, shown as vertical lines in at the vicinity of bright spots.
There are two factors that allow our system to remain almost free of chromatic dispersion. First, the reference and sample arms share the same optical path in our FD CP OCT, therefore there is no system induced dispersion mismatch, which is a common problem in OCTs with separated reference and sample arms. The other reason is that the probe located in close proximity to the site imaged. This decreases the mismatch caused by the media present between the probe tip and the sample to a negligible level. Based in part on these two factors, our FD CP OCT system was able to approach the theoretical resolution limit in the absence of a physical compensation scheme. The residual difference between theoretical and experimental resolution is in part, most likely due to remaining calibration error in the spectrometer.
VI. Functional OCT Sensing
A. Introduction
Hemoglobin oxygen saturation (SO2) level, the ratio of oxyhemoglobin (HbO2) to total hemoglobin (Hb), is potentially a relevant indicator of tissue perfusion. However, traditional blood oxygen monitoring devices such as pulse oxymeters or blood gas analyzers are usually non-local or invasive. OCT as a high resolution, high speed imaging modality, has the potential to measure localized blood oxygen saturation level via spectroscopic analysis of the sample’s spectral features [53].
In [54], D. Faber et al used a spectroscopic OCT technique to measure the absorption of non-scattering Hb and HbO2, by analyzing the spectra at the glass-liquid boundaries from A-scans of a Time Domain OCT, illuminated by a broadband Ti-Sapphire laser source. An extension of this work is reported in [55], the differential attenuation coefficients of whole-blood samples as a function of SO2 were determined by the same method used in [54]. However, in in vivo measurements, there is often not a clear boundary between blood and other tissues. C. Lu et al reported using a spectroscopic spectral domain OCT to measure SO2 [56]. To achieve this A-mode profiles were fit with exponential functions to derive the decay constants, at long (>800nm) and short (<800nm) wavelengths, respectively. The difference in decay constants was then used to determine the SO2 level. In vivo measurements of the wavelength dependent optical density of veins and arteries in human retina has been performed, with ultra-high resolution OCT [57].
B. Theory and Data analysis
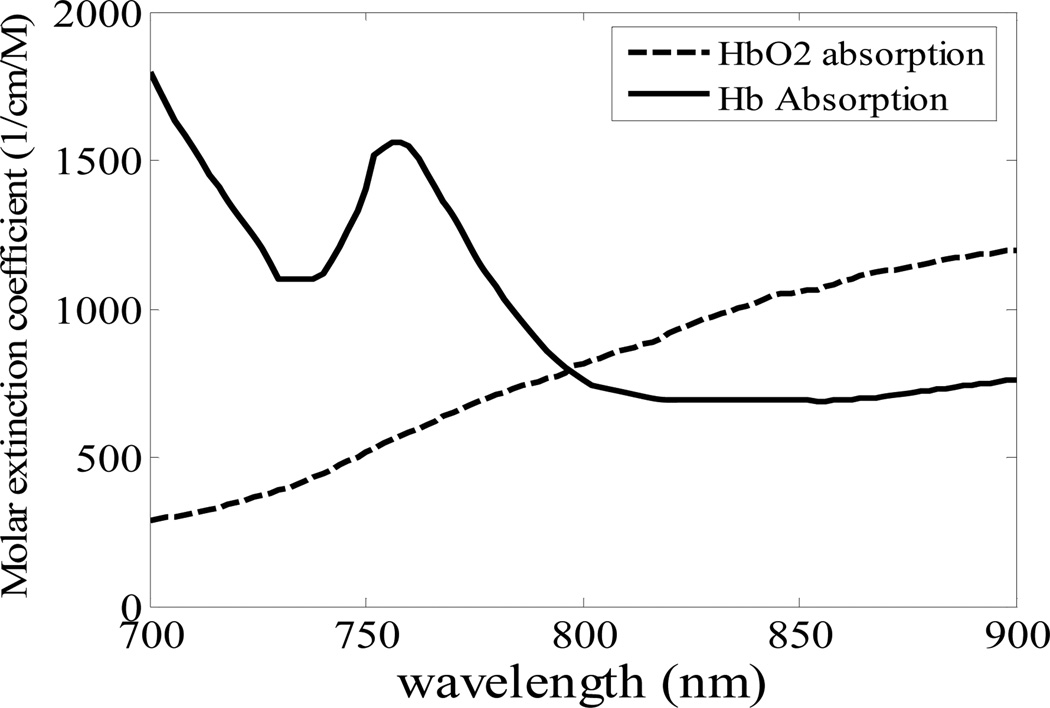
The underlying principle of oxygen saturation measurement with OCT is based on the differing light absorption properties of HbO2 and Hb. As shown in Fig. 12, the absorption spectra of HbO2 and Hb are different. HbO2 absorbs more light at longer wavelength (> 800nm) and Hb absorbs more light at shorter wavelength (< 800nm). In order to derive the localized SO2, we need to know how much spectral distortion blood causes in the long and short wavelength range, for each specific optical path length. The detected OCT interference signal in spectral domain OCT is
| (6) |
where, l is the delay between reference and sample light; k is wave vector (k=2π/λ); η is a constant; S0(k) is the source spectrum; rs(k,l) is the wavelength dependent path length resolved reflectance, which is used to extract SO2 level.
Fig. 12.
Molar extinction coefficient spectra of Hb and HbO2.
Morlet wavelet Transformation [53] can be used to get rs(k,l).
First, an inverse Fourier transform was performed on I(k) to get i0(l), which is the A-scan. Afterwards, Morlet wavelet Transformation is applied to i0(l). And then the result is normalized by source spectrum S0(k), as described in Eq (7),
| (7) |
in which 𝔽[ ] indicates to take Fourier transform. The Gaussian window size L determines the spatial resolution of r̂s(k,l), which is 14µm. Accordingly, the spectral resolution of this analysis is about 20nm, inversely proportional to L. r̂s(k,l) shows the sample reflectivity as a function of both wavelength and optical path length l.
Generally for a given k, r̂s(k,l) decays as increasing l exponentially, with an attenuation coefficient, which depends on the scattering coefficient αs(k), absorption coefficient αa(k), as well as the measurement apparatus. r̂s(k,l) can be expressed as,
| (8) |
For simplicity, we assume αs does not depend on wavelength. By averaging r̂s(k,l) in long (808nm and 848nm) and short (743nm to 766nm) wavelength range, we have r̂s_short(l), r̂s_long(l). They both depend on oxygen saturation level, because the blood absorption coefficient αa(k,l) is a function of SO2
| (9) |
, where αHbO2 is the wavelength dependent absorption coefficient of HbO2 and αHb is the absorption coefficient of Hb.
To get the difference between r̂s_short(l) and r̂s_long(l), we defined R(l) as following:
| (10) |
The difference between r̂s_short(l) and r̂s_long(l) is assumed to be much smaller than r̂s_short(l) and r̂s_long(l). In Eq. (10), factors independent of wavelength cancels out, hence R(l) reveals the absorption difference between long and short wavelength light, which could be considered as depth resolved relative SO2. Notably, the spectral distortion in Eq. (8) is cumulative. In other words, r̂s(k,l) is not only determined by light absorption in the vicinity of l, but also determined by absorption from the end of the probe to l. This makes it very difficult to explain the straightforward physical meaning of R(l).
The setup of our experiment has been described in part V. Data measured from a vessel in the CAM of a chicken embryo is used to extract SO2 information. The relative SO2 image is formed by laterally scanning the fiber probe above the surface of the sample to get R(l) at different lateral locations.
C. Result
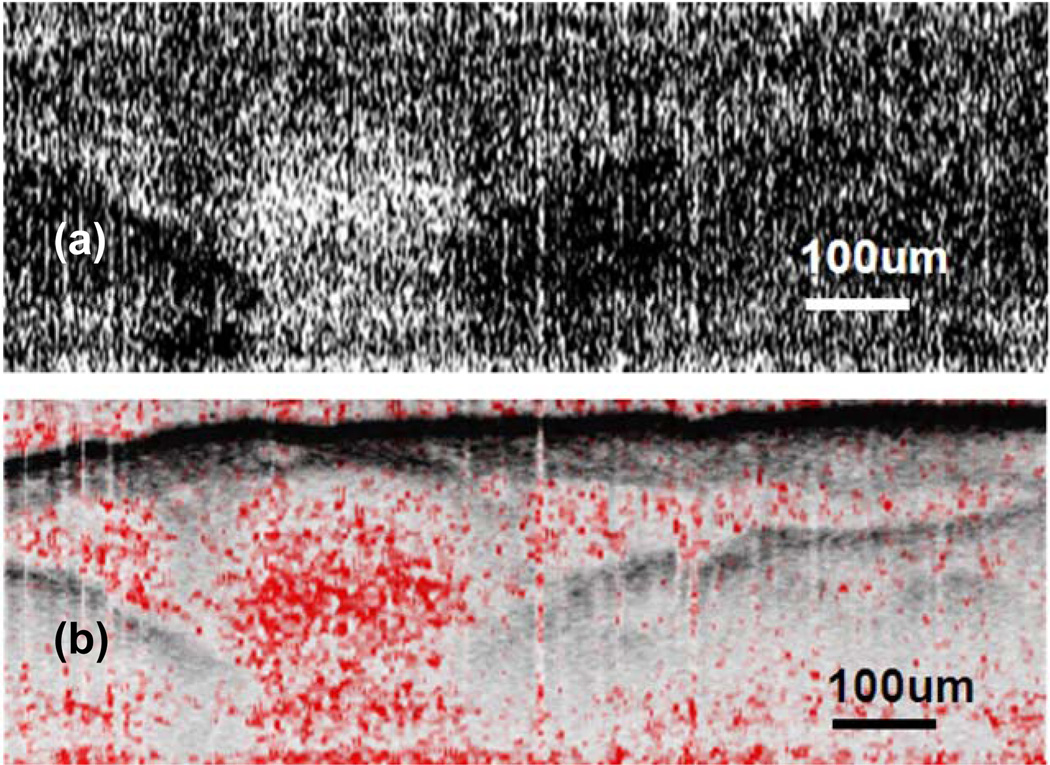
Fig. 13(a) shows the spatial variation of SO2. The value of R(lx, lz), is converted into the range of [0 1] and is assigned to every pixel as gray level. Pixels with larger brightness correspond to larger R value. In Fig. 13(b), we fuse SO2 image in Fig. 13(a) and OCT image together. Hue, Saturation, Value (HSV) color space in stead of Red Green Blue (RGB) space was used. H (hue) component is set as constant 0, which is red. S (saturation) is assigned with values of R of that pixel. When R is small, the colors are unsaturated and are simply shades of gray. When R is large, it becomes fully saturated red. V (value or brightness) is assigned by OCT signal amplitude. In Fig. 13(b), area enclosed by the vessel has larger R value compared with other part of the image. There is distinct difference in R for blood and other tissue. This verifies that our spectroscopic analysis correctly reveals oxygen saturation variation in living tissue samples.
Fig. 13.
(a) SO2 image (b) overlapped SO2 image and OCT image.
D. Discussion
2D relative SO2 imaging is presented in this work. As in Equation (3), the depth-wavelength resolved reflectance is a very complicated function. Therefore, calibration is a challenging task. First, an exponential decay assumption does not necessarily hold because of the random nature of scattering events in turbid tissue. Secondly, as previously noted the spectral distortion at depth l is determined by light absorption from the end of the probe to l, which is cumulative. Nevertheless, we have measured highly localized relative hemoglobin oxygen saturation levels in the chicken embryo, based on the SO2 dependent absorption spectrum for blood around 800nm. Here we have presented a 2D SO2 image obtained from OCT measurements for the first time. In so doing we have verifies the ability of FD-CP-OCT to distinguish between saturated and unsaturated hemoglobin.
VII. OCT-Guided Motion Control and Compensation
A. Motivation
Traditional intraocular microsurgery such as vitreoretinal surgery is guided by binocular surgical microscopes that provide 3-dimensional view however the surgeon’s operating view of intraocular tissues such as retinal is largely limited to the en face level and retinal surface detail. OCT imaging has the potential to extend the imaging field to the in-depth level and is thus a promising new modality of intraoperative microsurgical guidance that may lead to enhanced surgical abilities, less iatrogenic injury and better patient outcomes [16]. An advantage of OCT as compared to other potential intraocularimaging modalities is that it is more compact and has a much higher resolution. These are potential advantages for integration into micro surgical tools.
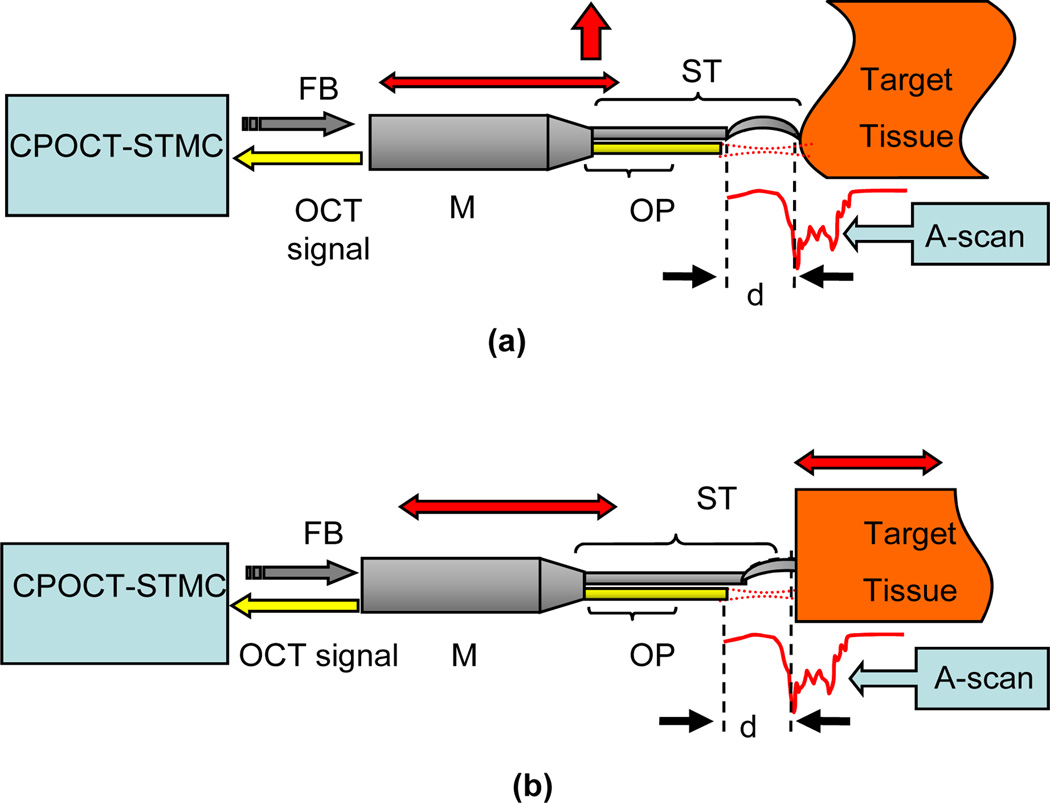
Conventional OCT systems have only 1~3mm coherence-gate-limited imaging depth which restricts its practical applications when the target tissue surface has a large topological variance [2]. Moreover, OCT imaging artifacts resulting from unavoidable motion inherent to the surgical tissue (e.g. vascular pulsation or respiratory induced motion) could misguide surgical efforts in not accounted for [58], therefore at the present time an experienced and highly dexterous surgeon is required in order to avoid related complications. A simple and efficient solution for these issues is an adaptive ranging technique based on depth-tracking, which first locates the subject tissue surface by OCT imaging and then analyzes the result for depth information in order to adjust the reference arm [59, 60]. By these methods the topological variance and motion effect can be compensated for and the surgical procedure can proceed on a virtual “plain and static” surface. The schematic of the CP-OCT surface topology and motion compensation (STMC) system is presented in Fig. 14. A CPOCT fiber-optic probe is integrated into a surgical tool like needle or micro-tweezers with is driven by mechanical module such as a computer controlled actuator or robotic arm. Every A-scan measurement is input into the CPOCT-STMC system and analyzed for the surface position. The system then feeds back the control signal to correct the tool’s position.
Fig. 14.
Schematic of CPOCT-STMC system: (a) Topology compensation;. (b) Motion compensation (here we mainly consider the axial motion). ST: surgical tool; OP: CP-OCT probe; M: mechanical module; FB: feedback control signal.
CP-OCT is a nearly ideal approach for these types of compensation because the reference and sample signals share the same path, thus the reference offset can be changed by adjusting the probe position without synchronizing the reference arm.
B. Schematic of CP-OCT STMC
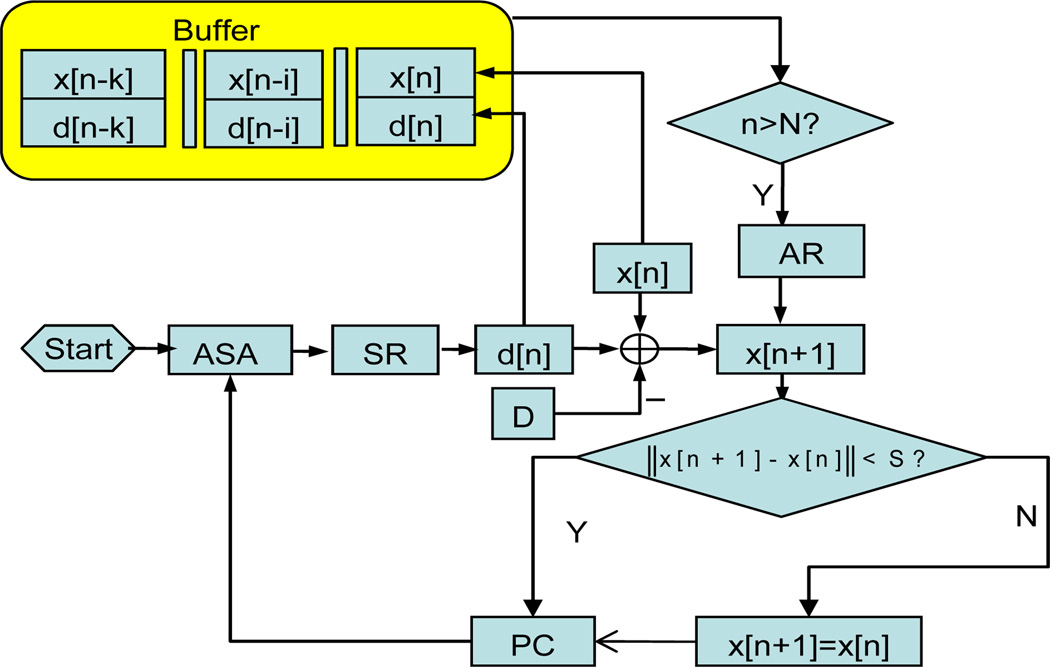
Fig. 15 shows the CPOCT-STMC flowchart while the experimental setup is mainly based on Fig. 14. The CP-OCT probe is driven by high precision motorized actuators (Newport 850G). The whole system is controlled and coordinated by LabView program through GPIB control. The probe- sample distance is set to a fixed value of D. Each A-scan is processed by a depth-tracking algorithm to find the actual probe-sample distance, noted as d[n]. In this setup, there is potential error caused by random scattering particles suspended between probe and sample, so rogue jumps can happen. To eliminate these unwanted events, a temporal comparison critic is applied prior to starting the actuator. This is done by defining a safe distance S, which is pre-estimated according to observed properties of the specific target’s topology and motion as well as the mechanical module’s temporal response. The k-order autoregressive (AR) predictor is applied to actively track the rhythmic motion of the tissue target [61]:
| (11) |
where, y[n − i] = d[n − i] x[n − i] are the tissue target position. Before starting the predictive tracking, k values of y[n] is acquired and registered in a memory buffer then used to determine the model coefficients αi by the least square regression. AR tracking starts at a pre-set step number N (N>k). The B-scan image is reconstructed according to the probe position for each A-scan.
Fig. 15.
CPOCT-STMC flowchart. ASA: A-scan acquisition; SR: surface recognition; AR: autoregressive predictor; PC: probe control.
C. Topological Compensation
To evaluate the topological compensation property, we made a phantom sample possessing highly curved surfaces consisting of 8-layers semitransparent tape. Fig. 16(a) is obtained by conventional fixed-reference OCT while Fig. 16(b) by CPOCT-STMC system. The motion trace of the scanning probe is indicated by the arrows. The conventional OCT has a working depth of ~1 mm, therefore the image fades with imaging depth. In the STMC mode, the scanning probe can penetrate the surface geometry while acquiring useful A-scan information at significantly greater depths. The solid line on Fig. 15(b) shows the moving trace of the probe, which correlates with the surface geometry very well.
Fig. 16.
Images of a phantom sample by CPOCT-STMC system: (a) Traditional OCT with limited imaging depth; (b) Topological compensation with extended imaging depth. The bar indicates 500 micron.
D. Motion Compensation
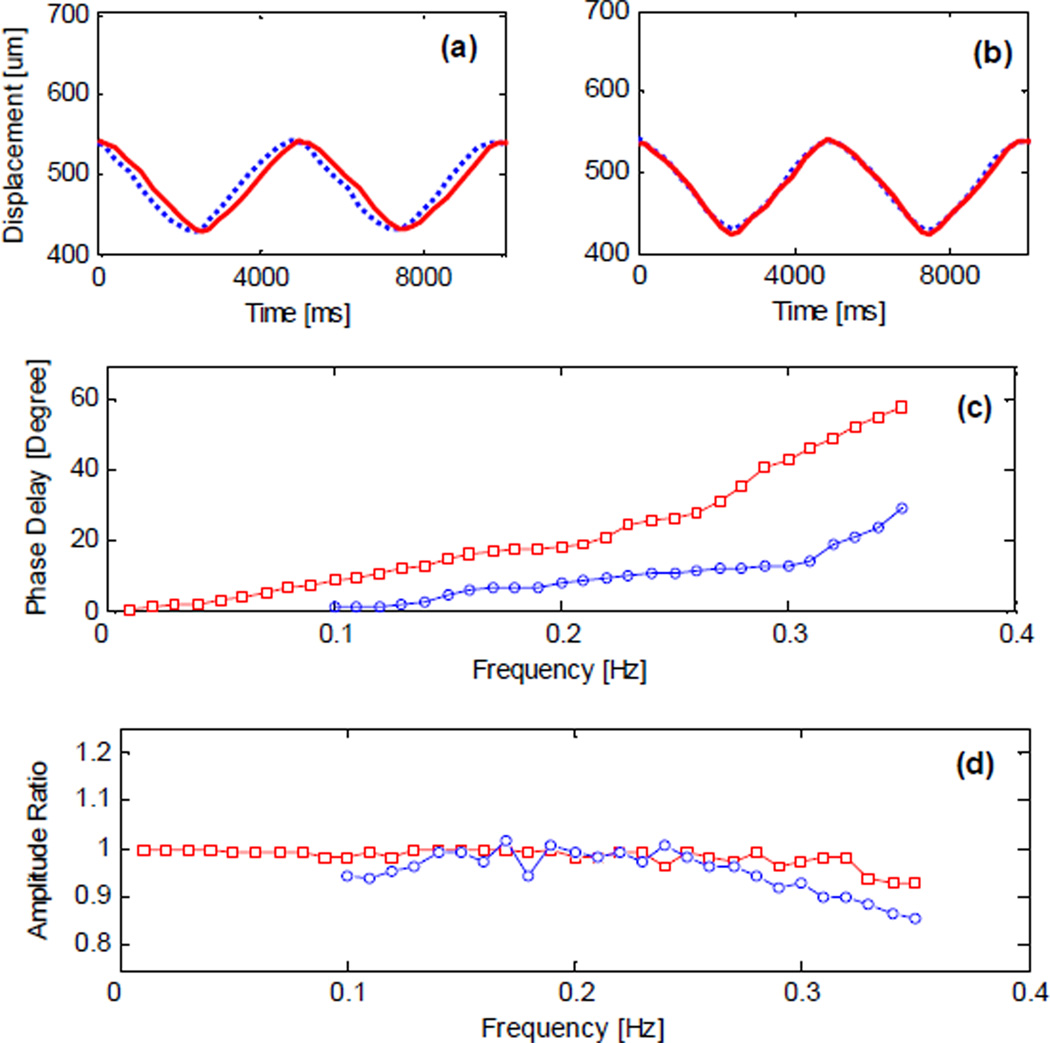
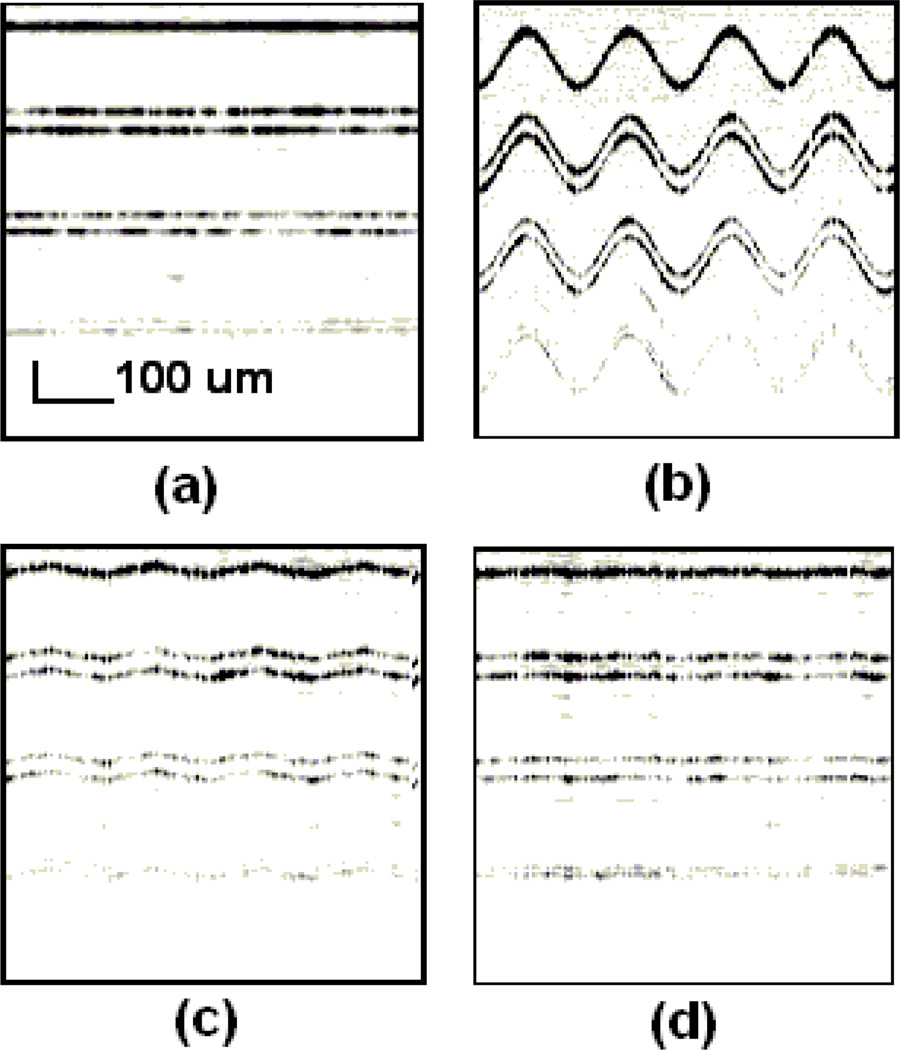
Fig. 17 presents the testing of SMTC temporal response to periodic motion where a phantom sample is periodically moving back and forth in the axial direction at an amplitude of 110µm. The period of target motion is set to be 5 second due to limited actuator speed (500µm/s). Apparent phase delay of approximately 20 degrees between the response and the motion can be seen in Fig. 17(a). When AR predictor is applied, as in Fig. 17(b), this phase delay is significantly decreased to about 5 degrees. The advantages of AR predictor is further investigated in Fig. 17(c) by slowing down the phase delay increase with frequency. A faster mechanical module can improve the STMC response speed to capture real tissue motion in real time. Fig. 18 illustrates the phase difference effect on the image. A phantom sample is made of three semitransparent layers and scanned by a conventional OCT probe while static and while moving at a 10 second period. From Fig. 18(b), we can see a fluctuating surface that is apparently artifact caused by sample motion. This is a critical problem for microsurgery as stated previously. Fig. 18(c) and (d) shows the result of re-imaging with the STMC system with and the diminished artifact signal.
Fig. 17.
CPOCT-STMC motion compensation properties. (a) and (b): Response to a target motion without/with AR predictor. Doted line: target motion; solid line: system response. (c) and (d) Phase difference and amplitude response to rhythmic motion. Square mark: without predictor; circle mark: with predictor.
Fig. 18.
Motion compensation of the CPOCT-SMTC system. (a) and (b) Traditional B-scan image of static / periodical moving phantom. (c) and (d) STMC B-scan image of periodically moving phantom without/ with AR predictor.
VIII. Conclusion
We have developed a simple all-fiber endoscopic FD-CP-OCT for biological imaging and sensing, which eventually is targeted for use in the setting of delicate microsurgical procedures such as intraocular retinal surgery. We have demonstrated that this system can achieve extremely high axial resolution < 3 microns without any external dispersion compensation. We have achieved this simply by combining multiple SLEDs using cascaded fiber optic couplers. We have demonstrated that its probe can be easily integrated into surgical tools that provide high resolution in vivo imaging and that these can be used in aqueous media similar to those of vitreous by optimizing a semitransparent, gold thin film layer with 1.7% reference reflectance. We have also developed a spectroscopic signal processing method that allows measurement of relative spatial varying oxygen saturation level in tissue. The high spatial resolution of OCT ensures this spectroscopic analysis is highly localized. Finally we have successfully demonstrated the feasibility of this system for the assessment of motion and topological compensation.
Acknowledgment
This work was supported in part by the NIH grants BRP 1R01 EB 007969-01 and R21 1R21NS063131-01A1, and NSF grant NSF101485.
Biographies
Jin U. Kang (M’00) received the Ph.D. degree in electrical engineering and optical sciences from the University of Central Florida, Orlando, in 1996. He was a Research Engineer with the U.S. Naval Research Laboratory, Washington, DC from 1996–1998. He is currently a Professor and Chair of the Department of Electrical and Computer Engineering, The Johns Hopkins University, Baltimore, MD. His current research interests include fiber optic sensors and imaging systems, novel fiber laser systems, and bio-photonics.
Jae-Ho Han (M’03–S’06) received the B.S. and M.S. degree in electronic engineering and radio engineering from Korea University, Seoul, Korea, in 1998 and 2000, respectively, and since 2005 has been working toward the Ph.D. degree in electrical and computer engineering at the Johns Hopkins University, Baltimore, MD.
While working toward the M.S. degree, he was a member of the Microwave Photonics Laboratory, where he worked in microwave waveguides and optoelectronic device packaging. In 2000, he joined the Telecommunication Laboratory of LG Cable, Anyang, Korea, where he was engaged in the research and development of high-speed optoelectronic devices and optical transmission systems. His current research interests include characterization and reliability of semiconductor laser and its application to biomedical technology.
Xuan Liu (S’09) received the B.S. degree in Electronics Engineering and M.S. degree in Physics in 2005 and 2007, respectively, from Tsinghua University, Beijing, since 2007 has been working toward the PhD degree in Electrical and Computer Engineering in the Johns Hopkins University, Baltimore, MD.
Kang Zhang (S’06) received B. S degree in Physics from Nankai University, Tianjin, China in 2007 and M.S degree in Electrical and Computer Engineering from Johns Hopkins University, Baltimore MD, in 2009. He is now a PhD candidate in the department of Electrical and Computer Engineering of Johns Hopkins University.
Chul Gyu Song received the B.S. degree in biomedical engineering from Yonsei University in 1989, and the M.S. and Ph.D. degrees in electrical engineering in 1991 and 1998, respectively. He worked as a senior researcher at Samsung Medical Center and Samsung Advanced Institute of Technology from 1994 to 1999. He is currently a visiting associate professor in ECE at the Johns Hopkins University, and Professor of Electronics Engineering at the Chonbuk National University, Korea. His research interests include Neuro rehabilitation engineering, Polarization Sensitive OCT and Biomedical Signal Processing.
Peter Gehlbach received a B.A. in Biology in 1982 and an M.D. in 1986 from the University of Vermont; a Ph.D. in Cellular & Integrative Physiology in 1995 from the University of Minnesota; completed Ophthalmology Residency at Washington University in St. Louis in 1999 and retina training at Oregon Health Sciences University in 2002. He is an Associate Professor in Ophthalmology at the Wilmer Eye Institute, Johns Hopkins University School of Medicine and Associate Professor at the Whitaker Biomedical Engineering Institute, Johns Hopkins University. Dr. Gehlbach is an academic retina surgeon who is the current Director of the Retina Fellowship Training Program at the Wilmer Eye Institute. He has clinical research interests in the area of ocular surgery innovation and retinal therapeutics and basic research interests in retinal angiogenesis and ischemia/reperfusion injury.
Contributor Information
Jin U. Kang, Department of Electrical and Computer Engineering, Johns Hopkins University, Baltimore, MD 21218 USA (phone: 410-516-8186; fax: 410-516-5566; jkang@jhu.edu)
Jae-Ho Han, Department of Electrical and Computer Engineering, Johns Hopkins University, Baltimore, MD 21218 USA.
Xuan Liu, Department of Electrical and Computer Engineering, Johns Hopkins University, Baltimore, MD 21218 USA.
Kang Zhang, Department of Electrical and Computer Engineering, Johns Hopkins University, Baltimore, MD 21218 USA.
Chul Gyu Song, Department of Electronics Engineering, Chonbuk National University, South Korea.
Peter Gehlbach, Wilmer Eye Institute, Johns Hopkins Hospital, Baltimore, MD, USA.
References
- 1.Huang D, Swanson EA, Lin CP, Schuman JS, Stinson WG, Chang W, Hee MR, Flotte T, Gregory K, Puliafito CA, et al. Optical coherence tomography. Science. 1991;vol. 254:1178–1181. doi: 10.1126/science.1957169. [DOI] [PMC free article] [PubMed] [Google Scholar]
- 2.Low A, Tearney G, Bouma B, Jang I. Technology insight: optical coherence tomography—current status and future development. Nat. Clin. Pract. Cardiovasc. Med. 2006;vol. 3:154–162. doi: 10.1038/ncpcardio0482. [DOI] [PubMed] [Google Scholar]
- 3.Fujimoto James G, Brezinski Mark E, Tearney Guillermo J, Boppart Stephen A, Bouma Brett, Hee Michael R, Southern James F, Swanson Eric A. Optical biopsy and imaging using optical coherence tomography. Nature Med. 1995;vol. 1:970–972. doi: 10.1038/nm0995-970. [DOI] [PubMed] [Google Scholar]
- 4.Fujimoto JG, De Silvestri S, Ippen EP, Puliafito CA, Margolis R, Oseroff A. Femtosecond optical ranging in biological systems. Opt. Lett. 1986;vol. 11:150–152. doi: 10.1364/ol.11.000150. [DOI] [PubMed] [Google Scholar]
- 5.Fercher AF, Mengedoht K, Werner W. Eye length measurement by interferometry with partially coherent light. Opt. Lett. 1988;vol. 13:186–188. doi: 10.1364/ol.13.000186. [DOI] [PubMed] [Google Scholar]
- 6.Hee MR, Izatt JA, Swanson EA, Huang D, Schuman JS, Lin CP, Puliafito CA, Fujimoto JG. Optical coherence tomography of the human retina. Arch. Ophthalmol. 1995;vol. 113:325–332. doi: 10.1001/archopht.1995.01100030081025. [DOI] [PubMed] [Google Scholar]
- 7.Drexler W, Fujimoto JG. Optical coherence tomography: Technology and applications. Springer; 2008. [Google Scholar]
- 8.Tearny GJ, Brezinski ME, Bouma BE, Boppart SA, Pitris C, Southern JF, Fujimoto JG. In Vivo endoscopic optical biopsy with optical coherence tomography. Science. 1997;vol. 276:2037–2039. doi: 10.1126/science.276.5321.2037. [DOI] [PubMed] [Google Scholar]
- 9.Drexler W, Morgner U, Kartner FX, Pitris C, Boppart SA, Li XD, Ippen EP, Fujimoto JG. In vivo ultrahigh resolution optical coherence tomography. Opt. Lett. 1999;vol. 24:1221–1223. doi: 10.1364/ol.24.001221. [DOI] [PubMed] [Google Scholar]
- 10.Brezinski ME, Fujimoto JG. Optical coherence tomography: high-resolution imaging in nontransparent tissue. IEEE J. Sel. Top. Quantum Electron. 1999;vol. 5:1185–1192. [Google Scholar]
- 11.Swanson EA, Huang D, Hee MR, Fujimoto JG, Lin CP, Puliafito CA. High-speed optical coherence domain reflectometry. Opt. Lett. 1992;vol. 17:151–153. doi: 10.1364/ol.17.000151. [DOI] [PubMed] [Google Scholar]
- 12.Rollins AM, Izatt JA. Optimal interferometer designs for optical coherence tomography. Opt. Lett. 1999;vol. 24:1484–1486. doi: 10.1364/ol.24.001484. [DOI] [PubMed] [Google Scholar]
- 13.Fujimoto JG. Optical coherence tomography for ultrahigh resolution in vivo imaging. Nature Biotech. 2003;vol. 21:1361–1367. doi: 10.1038/nbt892. [DOI] [PubMed] [Google Scholar]
- 14.Izatt JA, Hee MR, Swanson EA, Lin CP, Huang D, Schuman JS, Puliafito CA, Fujimoto JG. Micrometer-scale resolution imaging of the anterior eye in vivo with optical coherence tomography. Arch. Opthalmol. 1994;vol. 112:1584–1589. doi: 10.1001/archopht.1994.01090240090031. [DOI] [PubMed] [Google Scholar]
- 15.Bush J, Davis P, Marcus MA. All-fiber optic coherence domain interferometric techniques. Proc. SPIE. 2000:4204A–4208A. [Google Scholar]
- 16.Bouma BE, Tearny GJ. Handbook of Optical Coherence Tomography. New York: Marcel Dekker; 2002. [Google Scholar]
- 17.Wang Y, Xie X, Wang X, Ku G, Gill KL, O’Neal DP, Stoica G, Wang LV. Photoacoustic Tomography of a Nanoshell Contrast Agent in the in Vivo Rat Brain. Nano Lett. 2004;vol. 4:1689–1692. [Google Scholar]
- 18.Wang RK, Elder JB. Propylene glycol as a contrasting agent for optical coherence tomography to image gastrointenstinal tissues. Lasers Surg. Med. 2002;vol. 30:201–208. doi: 10.1002/lsm.10013. [DOI] [PubMed] [Google Scholar]
- 19.Lee TM, Oldenburg AL, Sitafalwalla S, Marks DL, Luo W, Toublan FJ, Suslick KS, Boppart SA. Engineered microsphere contrast agents for optical coherence tomography. Opt. Lett. 2003;vol. 28:1546–1548. doi: 10.1364/ol.28.001546. [DOI] [PubMed] [Google Scholar]
- 20.Sokolov K, Aaron J, Hsu B, Nida D, Gillenwater A, Follen M, MacAulay C, Adler-Storthz K, Korgel B, Descour M, Pasqualini R, Arap W, Lam W, Richards-Kortum R. Optical systems for in vivo molecular imaging of cancer. Technol. Cancer Res. Treat. 2003;vol. 2:491–504. doi: 10.1177/153303460300200602. [DOI] [PubMed] [Google Scholar]
- 21.Schmitt JM, Knuttel A, Yadlowsky M, Eckhaus MA. Optical-coherence tomography of a dense tissue: statistics of attenuation and backscattering. Phys. Med. Biol. 1994;vol. 39:1705–1720. doi: 10.1088/0031-9155/39/10/013. [DOI] [PubMed] [Google Scholar]
- 22.Kim SJ, Bressler NM. Optical coherence tomography and cataract surgery. Curr. Opin. Ophthalmol. 2009;vol. 20:46–51. doi: 10.1097/icu.0b013e3283199162. [DOI] [PubMed] [Google Scholar]
- 23.Gossage JKKW, Xu W, Ranger-Moore J, Saboda K, Brooks CA, Duckett LD, Salache SJ, Warneke JA, Alberts DS. Investigating sundamaged skin and actinic keratosis with optical coherence tomography: a pilot study. Technol. Cancer Res. Treat. 2003;vol. 2:525–535. doi: 10.1177/153303460300200605. [DOI] [PubMed] [Google Scholar]
- 24.Jackle S, Gladkova N, Feldchtein F, Terentieva A, Brand B, Gelikonov G, Gelikonov V, Sergeev A, Fritscher-Ravens A, Freund J, Seitz U, Soehendra S, Schrodern N. In vivo endoscopic optical coherence tomography of the human gastrointestinal tract-toward optical biopsy. Endoscopy. 2000;vol. 32:743–749. doi: 10.1055/s-2000-7711. [DOI] [PubMed] [Google Scholar]
- 25.Jackle S, Gladkova N, Feldchtein F, Terentieva A, Brand B, Gelikonov G, Gelikonov V, Sergeev A, Fritscher-Ravens A, Freund J, Seitz U, Schroder S, Soehendra N. In vivo endoscopic optical coherence tomography of esophagitis, Barrett's esophagus, and adenocarcinoma of the esophagus. Endoscopy. 2000;vol. 32:750–755. doi: 10.1055/s-2000-7705. [DOI] [PubMed] [Google Scholar]
- 26.Hart I, Li XD, Chudoba C, Ghanta RK, Ko TH, Fujimoto JG, Ranka JK, Windeler RS. Ultrahigh-resolution optical coherence tomography using continuum generation in an air–silica microstructure optical fiber. Opt. Lett. 2001;vol. 26:608–610. doi: 10.1364/ol.26.000608. [DOI] [PubMed] [Google Scholar]
- 27.Ding Z, Ren H, Zhao Y, Nelson JS, Chen Z. High-resolution optical coherence tomography over a large depth range with an axicon lens. Opt.Lett. 2002;vol. 27:243–245. doi: 10.1364/ol.27.000243. [DOI] [PubMed] [Google Scholar]
- 28.Sergeev AM, Gelikonov VM, Gelikonov GV, Feldchtein FI, Kuranov RV, Gladkova ND, Shakhova NM, Snopova LB, Shakhov AV, Kuznetzova IA, Denisenko AN, Pochinko VV, Chumakov YP, Streltzova OS. In vivo endoscopic OCT imaging of precancer and cancer states of human mucosa. Opt. Express. 1997;vol. 1:432–440. doi: 10.1364/oe.1.000432. [DOI] [PubMed] [Google Scholar]
- 29.Chen Y, Li X, Cobb M, Liu X, Thariani R. Full dispersion compensation in real-time optical coherence tomography involving a phase/frequency modulator, presented at the CLEO, CThT76. 2004 [Google Scholar]
- 30.Vakhtin AB, Kane DJ, Wood WR, Peterson KA. Common-path interferometer for frequency-domain optical coherence tomography. Appl. Opt. 2003;vol. 42:6953–6958. doi: 10.1364/ao.42.006953. [DOI] [PubMed] [Google Scholar]
- 31.Beddows R, James SW, Tatam RP. Improved Performance Interferometer Designs for Optical Coherence Tomography. International Conference on Optical Fibre Sensors. 2002:527–530. [Google Scholar]
- 32.Casaubieilh P, Ford HD, Tatam RP. Optical fibre Fizeau-based OCT, presented at the 2nd European Workshop on Optical Fibre Sensors. Proc. SPIE. 2004;vol. 5502:338–341. [Google Scholar]
- 33.Liu Xuan, Li Xiaolu, Kim Do-Hyun, Ilev Ilko, Kang Jin U. Fiber-optic Fourier-domain common-path OCT. Chin. Opt. Lett. 2008;vol. 6:899–901. [Google Scholar]
- 34.Sharma U, Fried NM, Kang Jin U. All-fiber common-path optical coherence tomography: sensitivity optimization and system analysis. IEEE J. Sel. Top. Quantum Electron. 2005;vol. 11:799–805. [Google Scholar]
- 35.Tumlinson Alexandre R, Barton Jennifer K, Povazay Boris, Sattman Harald, Unterhuber Angelika, Leitgeb Rainer A, Drexler Wolfgang. Endoscope-tip interferometer for ultrahigh resolution frequency domain optical coherence tomography in mouse colon. Opt. Express. 2006;vol. 14:1878–1887. doi: 10.1364/oe.14.001878. [DOI] [PubMed] [Google Scholar]
- 36.Tan KM, Mazilu M, Chow TH, Lee WM, Taguchi K, Ng BK, Sibbett W, Herrington CS, Brown CTA, Dholakia K. In-fiber common-path optical coherence tomography using a conical-tip fiber. Opt. Express. 2009;vol. 17:2375–2384. doi: 10.1364/oe.17.002375. [DOI] [PubMed] [Google Scholar]
- 37.Sharma U, Kang JU. Common-path optical coherence tomography with side-viewing bare fiber probe for endoscopic optical coherence tomography. Rev. Sci. Instrum. 2007;vol. 78:113102. doi: 10.1063/1.2804112. [DOI] [PubMed] [Google Scholar]
- 38.Li X, Li X, Han J-H, Liu X, Kang JU. Signal-to-noise ratio analysis of all-fiber common-path optical coherence tomography. Appl. Opt. 2008;vol. 47:4833–4840. doi: 10.1364/ao.47.004833. [DOI] [PubMed] [Google Scholar]
- 39.Vergnole S, Lamouche G, Dufour M, Gauthier B. Common path swept-source OCT interferometer with artifact removal. Proc. SPIE. 2008;vol. 6847 68472W-68472W-8. [Google Scholar]
- 40.Han J, Balicki M, Zhang K, Liu X, Handa J, Taylor R, Kang JU. Common-Path Fourier-Domain Optical Coherence Tomography with a Fiber Optic Probe Integrated into a Surgical Needle. CLEO, CMCC2. 2009 [Google Scholar]
- 41.Zhang Kang, Wang Weichao, Han Jaeho, Kang Jin U. A Surface Topology and Motion Compensation System for Microsurgery Guidance and Intervention based on Common-Path Optical Coherence Tomography, to be published in. IEEE Trans. Biomed. Eng. 2009;vol. 56(no. 9):2318–2321. doi: 10.1109/TBME.2009.2024077. [DOI] [PMC free article] [PubMed] [Google Scholar]
- 42.Leitgeb R, Hitzenberger CK, Fercher AF. Performance of fourier domain vs. time domain optical coherence tomography. Opt. Express. 2003;vol. 11:889–894. doi: 10.1364/oe.11.000889. [DOI] [PubMed] [Google Scholar]
- 43.Sun C-W, Wang C-Y, Yang CC, Kiang Y-W, Lu C-W, Hsu I-Jen, Lin CW. Polarization-dependent characteristics and polarization gating intime-resolved optical imaging of skeletal muscle tissues. IEEE J. Sel. Top. Quantum Electron. 2001;vol. 7:924–930. [Google Scholar]
- 44.Wang Z, Pan H, Yuan Z, Liu J, Chen W, Pan Y. Assessment of Dermal Wound Repair after Collagen Implantation with Optical Coherence Tomography. Tissue Eng. C. 2008;vol. 14:35–45. doi: 10.1089/tec.2007.0285. [DOI] [PubMed] [Google Scholar]
- 45.Cense B, Nassif NA, Chen TC, Pierce MC, Yun S, Park BH, Bouma BE, Tearney GJ, de Boer JF. Ultrahigh-resolution high-speed retinal imaging using spectral-domain optical coherence tomography. Opt. Express. 2004;vol. 11:2435–2447. doi: 10.1364/opex.12.002435. [DOI] [PubMed] [Google Scholar]
- 46.Wojtkowski M, Srinivasan VJ, Ko TH, Fujimoto JG, Kowalczyk A, Duker JS. Ultrahigh-resolution, high-speed, Fourier domain optical coherence tomography and methods for dispersion compensation. Opt. Express. 2004;vol. 12:2404–2422. doi: 10.1364/opex.12.002404. [DOI] [PubMed] [Google Scholar]
- 47.Ko TH, Adler DC, Fujimoto JG, Mamedov D, Prokhorov V, Shidlovski V, Yakubovich S. Ultrahigh resolution optical coherence tomography imaging with a broadband superluminescent diode light source. Opt. Express. 2004;vol. 12:2112–2119. doi: 10.1364/opex.12.002112. [DOI] [PubMed] [Google Scholar]
- 48.Schmitt Joseph M, Liang Zhou. Deconvolution and Enhancement of Optical Coherence Tomograms. SPIE. 2007;vol. 2981:46–57. [Google Scholar]
- 49.Liu Y, Liang Y, Mu G, Zhu X. Deconvolution methods for image deblurring in optical coherence tomography. J. Opt. Soc. Am. A. 2009;vol. 26:72–77. doi: 10.1364/josaa.26.000072. [DOI] [PubMed] [Google Scholar]
- 50.Tripathi R, Nassif N, Nelson JS, Park BH, de Boer JF. Spectral shaping for non-Gaussian source spectra in optical coherence tomography. Opt. Lett. 2002;vol. 27:406–408. doi: 10.1364/ol.27.000406. [DOI] [PubMed] [Google Scholar]
- 51.Leng T, Miller JM, Bilbao KV, Palanker DV, Huie P, Blumenkranz MS. The chick chorioallantoic membrane as a model tissue for surgical retinal research and simulation. Retina. 2004;vol. 24:427–434. doi: 10.1097/00006982-200406000-00014. [DOI] [PubMed] [Google Scholar]
- 52.Marks Daniel L., Ralston Tyler S, Boppart Stephen A. Speckle reduction by I-divergence regularization in optical coherence tomography. J. Opt. Soc. Am. A. 2005;vol. 22:2366–2371. doi: 10.1364/josaa.22.002366. [DOI] [PubMed] [Google Scholar]
- 53.Morgner U, Drexler W, Kärtner FX, Li XD, Pitris C, Ippen EP, Fujimoto JG. Spectroscopic optical coherence tomography. Opt. Lett. 2000;vol. 25:111–113. doi: 10.1364/ol.25.000111. [DOI] [PubMed] [Google Scholar]
- 54.Faber DJ, Mik EG, Aalders MCG, van Leeuwen TG. Light absorption of (oxy-)hemoglobin assessed by spectroscopic optical coherence tomography. Opt. Lett. 2003;vol. 28:1436–1438. doi: 10.1364/ol.28.001436. [DOI] [PubMed] [Google Scholar]
- 55.Faber DJ, Mik EG, Aalders MCG, van Leeuwen TG. Toward assessment of blood oxygen saturation by spectroscopic optical coherence tomography. Opt. Lett. 2005;vol. 30:1015–1017. doi: 10.1364/ol.30.001015. [DOI] [PubMed] [Google Scholar]
- 56.Lu CW, Lee CK, Tsai MT, Wang YM, Yang CC. Measurement of the hemoglobin oxygen saturation level with spectroscopic spectral-domain optical coherence tomography. Opt. Lett. 2008;vol. 33:416–418. doi: 10.1364/ol.33.000416. [DOI] [PubMed] [Google Scholar]
- 57.Kagemann L, Wollstein G, Wojtkowski M, Ishikawa H, ownsend KA, Gabriele ML, Srinivasan VJ, Fujimoto JG, Schuman JS. Spectral oximetry assessed with high-speed ultra-high-resolution optical coherence tomography. J. Biomed. Opt. 2007;vol. 12:041212. doi: 10.1117/1.2772655. [DOI] [PMC free article] [PubMed] [Google Scholar]
- 58.Yun SH, Tearney GJ, de Boer JF, Bouma BE. Motion artifacts in optical coherence tomography with frequency domain ranging. Opt. Express. 2004;vol. 12:2977–2998. doi: 10.1364/opex.12.002977. [DOI] [PMC free article] [PubMed] [Google Scholar]
- 59.Iftimia N, Bouma B, Boer J, Park B, Cense B, Tearney G. Adaptive ranging for optical coherence tomography. Opt. Express. 2004;vol. 12:4025–4034. doi: 10.1364/opex.12.004025. [DOI] [PMC free article] [PubMed] [Google Scholar]
- 60.Maguluri G, Mujat M, Park B, Kim K, Sun W, Iftimia N, Ferguson R, Hammer D, Chen T, Boer J. Three dimensional tracking for volumetric spectral-domain optical coherence tomography. Opt. Express. 2007;vol. 15:16808–16817. doi: 10.1364/oe.15.016808. [DOI] [PubMed] [Google Scholar]
- 61.Yuen SG, Novotny PM, Howe RD. Quasiperiodic Predictive Filtering for Robot-Assisted Beating Heart Surgery. International Conference on Robotics and Automation (ICRA) 2008:3875–3880. [Google Scholar]


