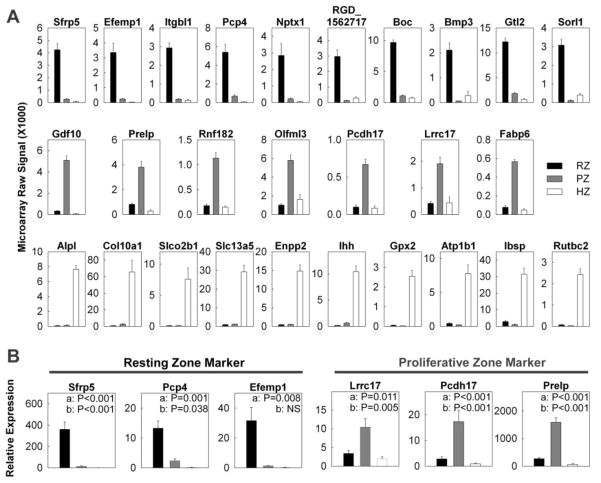
Figure 1. Changes in gene expression (mean ± SEM) of spatial markers across the tibial growth plate of 1 wk old rats.
Different zones of the growth plate cartilage were micro-dissected. (A) The relative expression of mRNA in each zone was measured by expression microarray (Affymetrix Rat Genome Array 230 2.0). The data was background corrected and normalized using the MAS5 statistical algorithm. (B) The relative expression of Sfrp5, Pcp4, Efemp1, Lrrc17, Pcdh17, and Prelp was verified using quantitative real-time PCR. RZ, resting zone; PZ, proliferative zone; HZ, hypertrophic zone.

