

Abstract
The structural and functional properties of active site mutants of cytochrome c oxidase from Paracoccus denitrificans (PdCcO) were investigated with resonance Raman spectroscopy. Based on the Fe-CO stretching modes and low frequency heme modes, two conformers (α- and β-forms) were identified that are in equilibrium in the enzyme. The α-conformer, which is the dominant species in the wild type enzyme, has a shorter heme a3 iron-CuB distance and a more distorted heme, as compared to the β-conformer, which has a more relaxed and open distal pocket. In general, the mutations caused a decrease in the population of the α-conformer, which is concomitant with a decreased in the catalytic activity, indicating that the α-conformer is the active form of the enzyme. The data suggest that the native structure of the enzyme is in a delicate balance of intramolecular interactions. We present a model in which the mutations destabilize the α-conformer, with respect to the β-conformer, and raise the activation barrier for the inter-conversion between the two conformers. The accessibility of the two conformers in the conformational space of CcO plausibly plays a critical role in coupling the redox reaction to proton translocation during the catalytic cycle of the enzyme.
INTRODUCTION
Cytochrome c oxidase (CcO), the terminal enzyme in the electron transfer chain, catalyzes the four electron reduction of oxygen to water and harnesses the redox energy to translocate protons across the inner membrane of mitochondria in eukaryotic cells or the plasma membrane in aerobic bacteria, thereby contributing to the proton motive force utilized for ATP synthesis. For the reduction of each oxygen molecule, four protons are translocated across the membrane and four more are utilized in the generation of the two water molecules. The catalytic site consists of a binuclear center comprised of a heme group (heme a3) and a copper atom (CuB), which is only ~5Å away from the heme iron atom (Figure 1). Electrons required for the oxygen chemistry are donated from cytochrome c to the binuclear copper center (CuA) from which they transfer to the CuB-heme a3 binuclear center via another heme group (heme a), close to the catalytic site (Figure 1).
Figure 1. The catalytic site of PdCcO, consisting of Heme a and the Heme a3-CuB binuclear center.
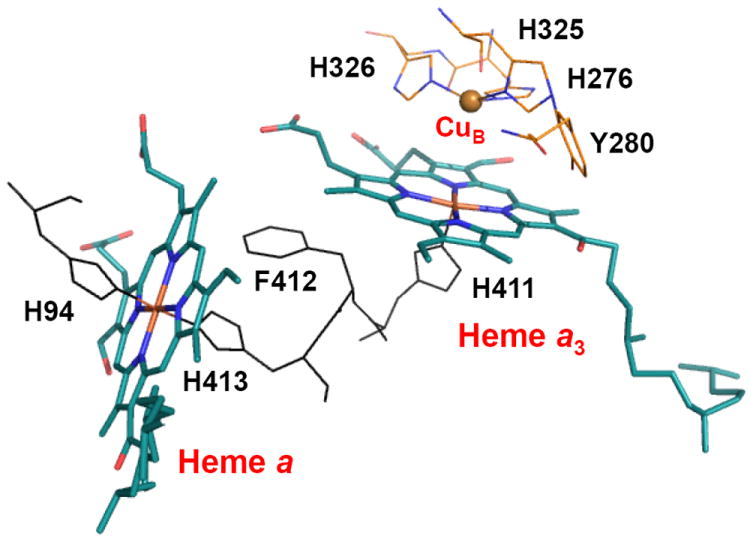
H276, one of the three histidine ligands to CuB, is covalently linked to Y280 via a post-translational modification. The structure was rendered from PDB: 3EHB with PyMOL (DeLano Scientific, CA).
The catalytic site of the bovine enzyme (bCcO) [1-7] shares high structural similarity with that of the bacterial oxidases [8-12], suggesting that the enzymes use a common mechanism to execute the oxygen reduction chemistry. Among the bacterial enzymes, the CcO from Paracoccus denitrificans (PdCcO) is one of the most studied systems. Site-directed mutagenesis studies of PdCcO have provided insightful information regarding the functional roles of specific residues and the proton translocation pathways [13-16]. In contrast to the 13 subunits of the bCcO, in which 3 are expressed in the mitochondria and the other 10 are expressed in the nucleus of the cell, PdCcO has only 4 subunits that are all expressed in the cytoplasm and subsequently integrated into the cytoplasmic membrane. Subunits I, II and III comprise the enzyme core, which is functionally and structurally similar to the 3 mitochondrial encoded subunits from bCcO.
CO has been found to be a very useful structural probe for the active site of CcO. Based on the Fe-C-O related vibrational modes, two distinct conformers of CO-bound CcO have been identified in isolated oxidases [17-23], as well as in oxidases within myocytes [24] and mitochondria [25, 26]. The two conformers have been termed the α-form, in which the Fe-CO stretching mode (νFe-CO) and C-O stretching mode (νC-O) are detected at ~517-520 and ~1963-1966 cm-1, respectively, and the β-form, in which the modes are located at ~493-495 and ~1950-1955 cm-1, respectively [23, 24]. It was found that the two conformers are inter-convertible in the pH range of 6-9 with a pKa of ~7.4 [17, 20]; in addition, the relative populations of the two conformers are sensitive to mutations in residues in the vicinity of the binuclear center [20]. It has been postulated that the two conformers are distinguishable by the distance between the heme a3 iron and CuB, which is sensitive to the protonation state of ionizable group(s) near the heme a3-CuB binuclear center [17, 20, 23]. This hypothesis is supported by energy minimization studies, which demonstrated that a small increase in the heme a3 iron-CuB distance resulted in the relaxation of the bent Fe-CO moiety to a linear structure [17].
In the work presented here, each of seven residues near the heme a and heme a3-CuB binuclear center in PdCcO, highlighted in Figure 2 and listed in Table 1, was mutated and investigated by resonance Raman spectroscopy. To determine how the structural properties of the oxygen binding site are modulated by the mutations and how they impact the function, the spectra of the νFe-CO modes and the low frequency heme modes of the CO-derivatives are compared to the catalytic activities. The data reveal that the enzymatic activity is correlated well with the population of the α-conformer of the enzyme.
Figure 2.
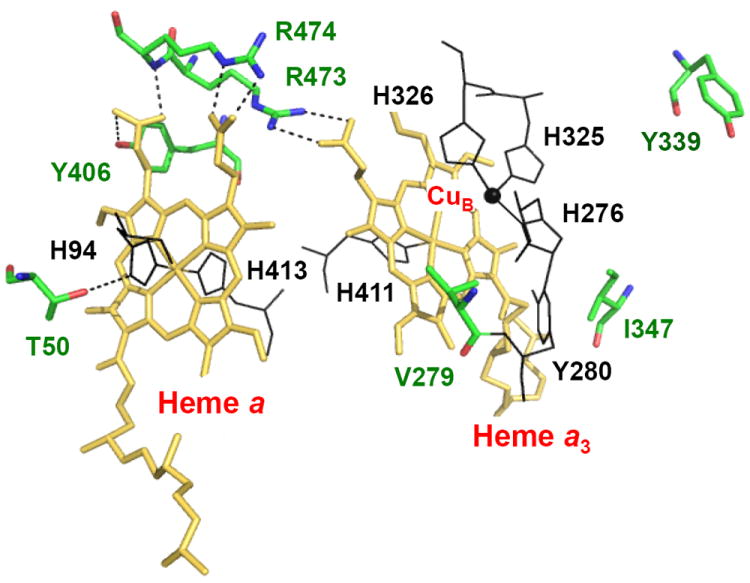
The seven residues mutated in PdCcO in this study. The mutation sites are labeled in green. The structure was rendered from PDB: 3EHB with PyMOL (DeLano Scientific, CA).
Table 1. The populations of the α-conformer and the relative activities of the PdCcO mutants.
The fractional populations of the α-conformer were determined from the intensities of the 521 and 490 cm-1 bands. The % activities were calculated by using the activity of the wild type enzyme (WT) as a reference.
| Mutant | α-form | % Activity |
|---|---|---|
| R473Q | 0.0 | 16 |
| I347Q | 0.29 | 16 |
| V279I | 0.33 | 50 |
| T50N | 0.44 | 50 |
| Y339F | 0.46 | 64 |
| R474Q | 0.48 | 41 |
| Y406F | 0.62 | 40 |
| WT | 0.78 | 100 |
| T50A | 1.0 | 90 |
MATERIALS AND METHODS
Protein Preparation
The mutants were prepared as previously described [27]. The stock enzyme solutions were diluted to ~40 μM with 100 mM phosphate buffer at pH 7.5 with 0.01% n-dodecyl-β-maltoside. To obtain ferrous enzymes, sodium dithionite solution prepared under anaerobic condition was injected into the sealed Raman cuvette containing the ferric samples pre-purged with argon gas for 15 min. The complete reduction of the enzymes was confirmed by optical absorption measurements. Brief purging with CO gas for ~1 min converted the ligand-free ferrous samples to the CO-bound ferrous states.
Activity Measurements
The oxygen uptake rate was determined by a Clark-type oxygen electrode. The reaction was initiated by adding the enzyme into the reaction mixture, which included 50 mM pH 6.5 phosphate buffer, 0.05% n-decyl-β-maltoside, 2.9 mM ascorbate, 34 uM horse heart cytochrome c (Sigma, Type VI), 0.6 mM TMPD, and 1.1 mg/mL asolectin.
Resonance Raman Measurements and Data Analysis
The apparatus for the equilibrium resonance Raman spectroscopic measurements has been previously described [28]. Briefly, the 413.1 nm line from a Kr+ laser was utilized as an excitation source to obtain the spectra of the CO-bound enzymes. Since the CO-bound species are extremely vulnerable to photodissociation, the laser power was kept low (~0.1-0.2 mW). The typical spectral acquisition time was 8-24 min. To quantify the 345, 356, 490, 521, 677 and 751 cm-1 bands in the spectra of the CO- bound species, each of the bands was fitted by a Lorentzian function (which best-fitted the data) by using the GRAMS/32 AI Software (Galactic Industries Corporation, Salem, NH, USA). In the first round of the fitting procedure, the peak maximum and width of the six bands were found to be similar among all the examined mutants. Thus, averages on the peak widths were calculated and used in the second round of fitting to obtain the final peak areas.
RESULTS
Resonance Raman Spectra of the CO-adducts
The resonance Raman spectra of the CO-adducts of eight mutants of PdCcO, including R473Q, I347Q, V279I, T50N, A, Y339F, R474Q and Y406F as indicated in Figure 2, were examined with 413.1 nm excitation. As the Soret transition of the CO-bound heme a3 moiety is located at ~430 nm, whereas that of heme a is at ~442 nm, the resonance Raman spectra are dominated by the vibrational modes originating from the CO-heme a3 [29]. Figure 3 shows the resonance Raman spectra of the wild type and three representative mutants (R473Q, V279I and Y339F) of PdCcO. The spectra of all of the mutants studied in this work are shown in Figure S1 in the Supplementary Information. The data indicate that the mutations introduce changes throughout the spectra in the 300-800 cm-1 window, with the largest changes in three regions: (1) the νFe-CO region in the 480-530 cm-1 range, (2) the ν7 and ν15 regions in the 670-755 cm-1 range, and (3) the ν8 region in the 340-360 cm-1 range.
Figure 3. Resonance Raman spectra of the CO-adducts of the wild type (WT) and representative mutants of PdCcO.
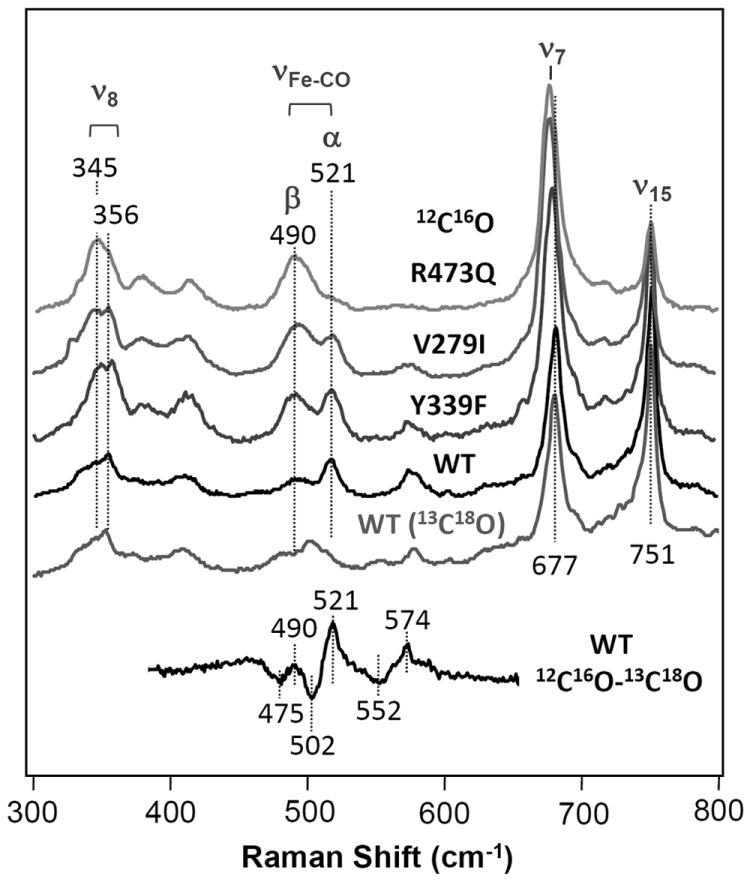
The top four spectra were obtained with 12C16O.
The Fe-C-O related vibrational modes have been shown to be valuable probes of heme structure, as they are sensitive to electrostatic and steric interactions between the heme-bound CO and its surrounding environment. To identify the Fe-C-O related modes in the spectrum of the wild type and mutants of PdCcO, 12C16O-13C18O isotope substitution experiments were carried out. As shown in Figure 3, the 12C16O-13C18O difference spectrum revealed three CO isotope sensitive modes at 490/475, 521/502 and 574/552 cm-1, for 12C16O/13C18O derivatives, respectively. The frequencies of these modes are similar to those of the Rhodobacter sphaeroides CcO (RsCcO) [17], in which two distinct Fe-CO stretching modes (νFe-CO) at 494 and 517 cm-1 (associated with the β- and α-conformer, respectively) and a Fe-C-O bending mode (δFe-C-O) at 575 cm-1 were identified. Accordingly, we assign the 490 and 521 cm-1 bands of PdCcO to the νFe-CO modes of the β- and α-conformers, respectively, and the 574 cm-1 band to the δFe-C-O mode. As compared to the wild type protein, the relative intensity of the α-conformer with respect to the β-conformer is reduced in all mutants except T50A. As listed in Table 1, the fractional intensities of the α-conformer are of the following order: T50A > wild type (WT) > Y406F > R474Q, Y339F > V279I, I347Q > R473Q, in which WT is dominated by the α-conformer, while R473Q is dominated by the β-conformer. As previous studies indicate that the α-form is associated with a shorter heme a3 iron-CuB distance [17, 20, 23], the data suggest that all the mutants (except T50A) are associated with a more relaxed binuclear center, in which the heme a3 iron-CuB distances are lengthened.
Similar to the Fe-C-O related modes, the frequencies and intensities of the modes in the ν7 and ν15 region (670-755 cm-1) are sensitive to the mutations. In WT, the intensity of the ν15 band at 751 cm-1 is ~20% larger than that of the ν7 band at 677 cm-1, while at the other extreme, in R473Q the intensity of the ν15 band is only ~ 30% of that of the ν7 band. The much stronger intensity of the depolarized ν15 band as compared to the polarized ν7 band in WT is surprising. Recent studies conducted by Schweitzer-Stenner and coworkers suggest that the ν15 band is a depolarized B1g mode of a planar heme with D4h symmetry; they showed that, if there is an in-plane distortion of the heme macrocycle, lowering the symmetry of the heme, the B1g mode can be transformed into an A1 mode, thereby gaining intensity in the resonance Raman spectrum [30]. Accordingly, we attribute the high relative intensity of the ν15 band in the WT of PdCcO to an in-plane distortion of the heme a3, due to the interaction between the heme with its protein environment. The relatively lower intensities of the ν15 band of the mutants imply a more relaxed heme, consistent with the conclusion drawn from the νFe-CO data.
In the ν8 region (340-360 cm-1), significant changes were also observed upon the mutations. The WT spectrum shows a band with a maximum at 356 cm-1 and a shoulder at ~345 cm-1. The mutations increase the intensity of the ~345 cm-1 shoulder; for instance, in R473Q, the band is dominated by the 345 cm-1 band. The major band in this region has been assigned as the fully symmetric ν8 mode [31]. However, γ6 is also located in this region. Studies conducted by Czernuszewicz et al. showed that, in Nickel octaethylporphyrin (NiOEP), the ν8 mode splits into two, which they attributed to two distinct orientations of the ethyl sidechain group of the heme [31]. They also demonstrated that the γ6 mode is very weak with Soret excitation, although it can be significantly enhanced with visible excitation. Based on these observations, we assign the two bands at 345 and 356 cm-1 to the ν8 modes of the heme a3 group with two distinct orientations of the peripheral groups.
To correlate the changes in the three Raman spectral regions introduced by the mutations, we plot the relative intensities of the 521/490, 751/677 and 356/345 cm-1 pairs on a fractional scale in Figure 4. The data demonstrate that the changes in the ratio of the α- and β-conformers correlate well with those in the heme modes. They indicate that the WT protein is dominated by the α-conformer, in which the CuB is in close proximity to the heme a3 iron and the heme is distorted; the mutations promote the conversion of the α-conformer to the β-conformer, in which the heme a3 iron-CuB distance is longer, the porphyrin macrocycle of the heme is more symmetric and the peripheral groups attached to it have different conformations.
Figure 4. The fractional intensities of the 521 (green squares), 356 (black triangles) and 751 (grey circles) cm-1 bands obtained from the fitting analysis of the 521/490, 356/345 and 751/677 cm-1 pairs.
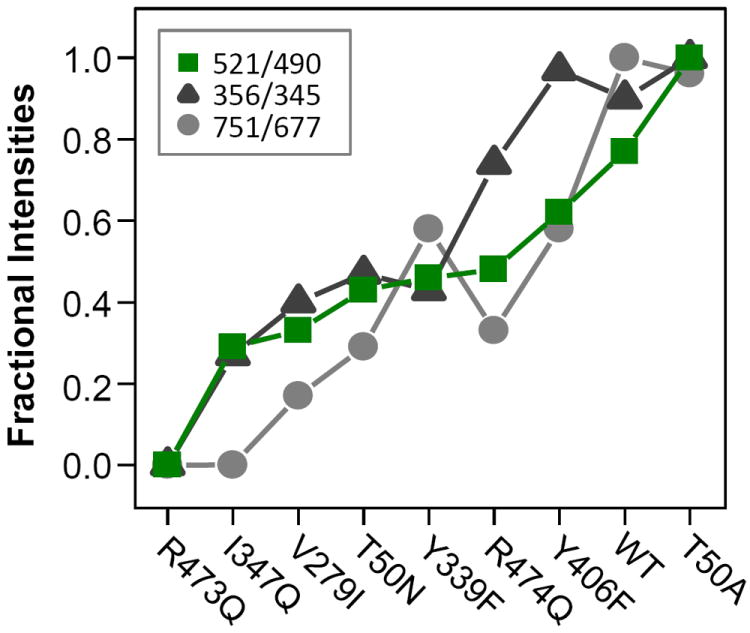
The catalytic activities of the various mutants of PdCcO with respect to the wild type enzyme (red stars) are indicated as comparisons.
Catalytic activities and proton pumping efficiencies of the Mutants
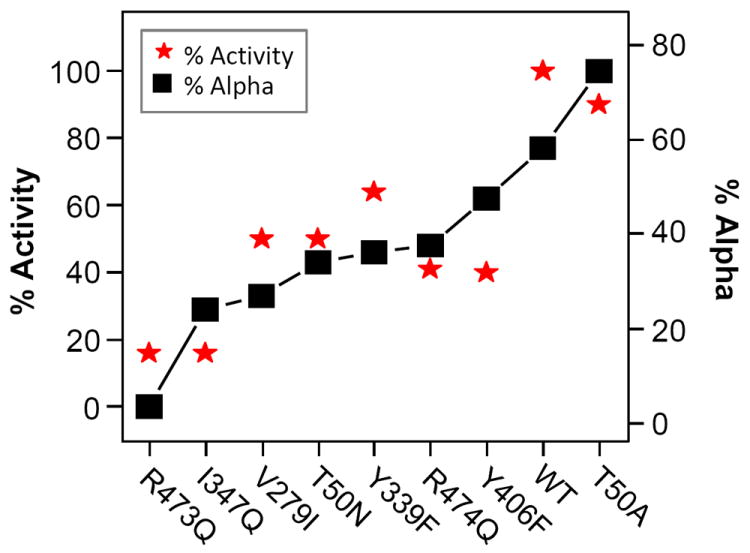
The catalytic activity and pumping efficiency of each mutant was measured and compared to the resonance Raman data. The data show that, as compared to the WT, all the mutants show reduced activity varying from 16 to 90% as listed in Table 1; and all mutants are competent in proton pumping, with 1 proton pumped per electron utilized by the oxygen reaction. In Figure 5, the relative activity of each mutant with respect to the wild-type protein is overlaid with the percentage of the population of the α-conformer. A rough correlation between the two parameters were observed, indicating that the α- and β-conformers are in equilibrium and that the α-conformer is the active form of the enzyme with proton pumping capability, while the β-conformer is inactive in catalyzing the oxygen reaction and pumping protons.
Figure 5. An overlay of the percentage of the enzymatic activity of each of the mutants studied in this work with respect to the wild-type activity (left scale) and the percentage of the population of the α-conformer (right scale).
DISCUSSION
To understand the how each mutation of PdCcO may perturb the structure of the binuclear center, thereby modulating the relative population of the α- versus the β-conformer, we examined the crystallographic structure of PdCcO (PDB: 3EHB) [32]. As shown in Figure 6a, R473, R474 and Y406 are part of the elaborate H-bonding network linking the two hemes to a CuB ligand, H326, via the propionate groups of the heme a and heme a3, as well as a number of water molecules, which are well conserved in the crystal structures of PdCcO, bCcO (PDB: 2ZXW) [1] and RsCcO (PDB: 2GSM) [10]. The mutations in these residues cause significant reduction in the population of the α-conformer, presumably due to the disruption of the H-bonding network. In contrast, the mutation in T50 residue, which forms an H-bond with an axial ligand (H94) of heme a, to alanine causes a slight increase in the population of the α-conformer, as compared to the WT, indicating that the disruption of the H-bond due to the T50A mutation may introduce conformational changes to the heme a, which are transmitted to the heme a3-CuB center via either the heme propionate groups or the axial ligand, H411, of heme a3. Likewise, the mutation of T50 to asparagine disturbs the H-bond, thereby promoting the population of the β-conformer.
Figure 6. The mutated residues near the heme a (a) and the CuB binding site (b).
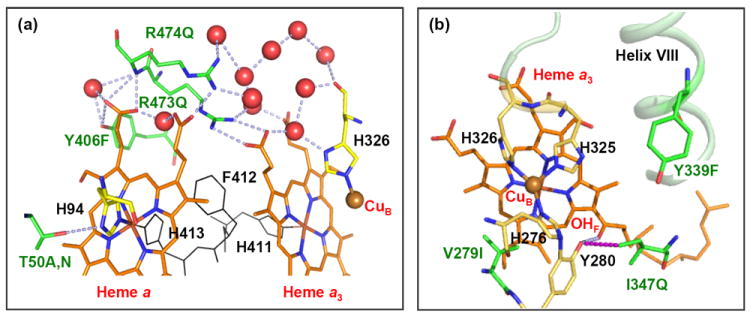
The identity of each mutant is labeled in green. The H-bonding network linking the mutated residues and their surrounding environment is indicated by blue dotted lines. The “OHF” in (b) indicates the OH group of the farnesyl sidechain of heme a3. The red spheres represent water molecules. The structure was rendered from PDB: 3EHB with PyMOL (DeLano Scientific, CA).
While the mutations in the aforementioned four polar residues perturb the heme a3-CuB binuclear center via disrupting the native H-bonding interactions, the other three residues we examined, V279, I347 and Y339, located in the CuB site, do not directly interact with the surrounding environment (Figure 6b). V279 has its sidechain pointing into the catalytic site, and is next to Y280 (in sequence), which is covalently linked to a CuB ligand, H276. Its mutation to a bulkier isoleucine may affect the heme a3-CuB center directly, thereby destabilizing the α-conformer. Similarly, I347 is 4 Å from the sidechain OH group of Y280, which forms an H-bond (shown in light blue) with the OH group of the farnesyl sidechain of heme a3; its mutation to a polar glutamine could introduce a non-native H-bond between the two functional groups, thereby affecting the structure of the binuclear center, accounting for the significant decrease in the population of the α-conformer. On the other hand, Y339 is in Helix VIII, which via a loop region is connected to another helix containing two CuB ligands, H325 and H326. The mutation of Y339 to a non-polar phenylalanine may affect the position of the helix, thereby perturbing the binuclear center. Taken together, the data indicate that structural integrity of the heme a3-CuB binuclear center is intricately controlled by a delicate balance of the various intramolecular interactions.
Based on our studies of the CO derivatives of PdCcO, the structural properties of the two different conformations have been determined. In the α-conformer the heme structure has an in-plane distortion, the CuB distance is short; the short CuB-Fe distance affects the structure and bonding properties of both the Fe-CO and Cu-CO adducts. In the β-conformer these tight interactions present in the α-conformer are relaxed as the Fe-CuB distance is lengthened. The variation of these conformers with mutations near the catalytic site indicates that these conformations are delicately poised in the active enzyme. The understanding of these conformers is important as it has been suggested that distinct conformational states are required for regulating proton entry and departure at the active site during the proton pumping process [5, 11, 33-40], and also for capturing the energy released in the oxygen reduction chemistry [41-43]
The discovery of the α and β-forms of the CO-complex of CcO was first made by Alben and coworkers in low temperature photolysis studies of bovine mitochondria with FTIR [18, 24-26]. The presence of the two conformers of CcO was later confirmed in several different preparations of mammalian oxidases, including rat heart myocytes and opossum heart tissue slices [24]. Similar conformers of the CO-adduct of bacterial CcO were identified in RsCcO with FTIR by Gennis and coworkers [19-21]. They observed that the ratio of the two forms is sensitive to mutations in the vicinity of the binuclear center and pH [20]. Additional studies carried out with room temperature resonance Raman spectroscopy showed that the α and β conformers of RsCcO are associated with νFe-CO at 519 and 493 cm-1, respectively and that the two forms were also pH-sensitive [23].
From the results reported here on the correlation of the α-form with the catalytic activity, and the past results on the two forms of the enzyme, it is evident that there is an equilibrium between the α- and the β-conformers. In the WT, the α-form is lower in energy; hence it is the dominant species. All the mutations (except T50A) lead to the destabilization of the α-conformer, with respect to the β-conformer. To account for these observations we postulate the model illustrated in Figure 7. In the wild-type enzyme, in which the α-conformer has the lower energy, the β-form is accessible owing to a relatively low barrier. Similarly, the barrier to return to the α-form is low making both forms accessible so as to attain full catalytic activity. In the mutants, in which the β-form has the lower energy, the activation barrier for the inter-conversion between the two conformers is high, accounting for the reduction in their catalytic activity during the multiple turnover of the oxygen reaction. In T50A, the population of the α-conformer is higher than that of WT, but its catalytic activity is only 90% of the WT, suggesting that the α-conformer has a lower energy than the β-conformer, but we postulate that the energy barrier separating the two conformers is higher, and the catalytic activity is at least partially rate-limited by the conversion of the inactive β-conformer to the active α-conformer. This model presented here accounts for the observations that both forms co-exist in functional intact cells [24] and mitochondria [25, 26], highlighting their functional significance.
Figure 7. The postulated equilibrium between the α and β-conformers of the wild type (black curve) and mutant (green curve) of PdCcO.
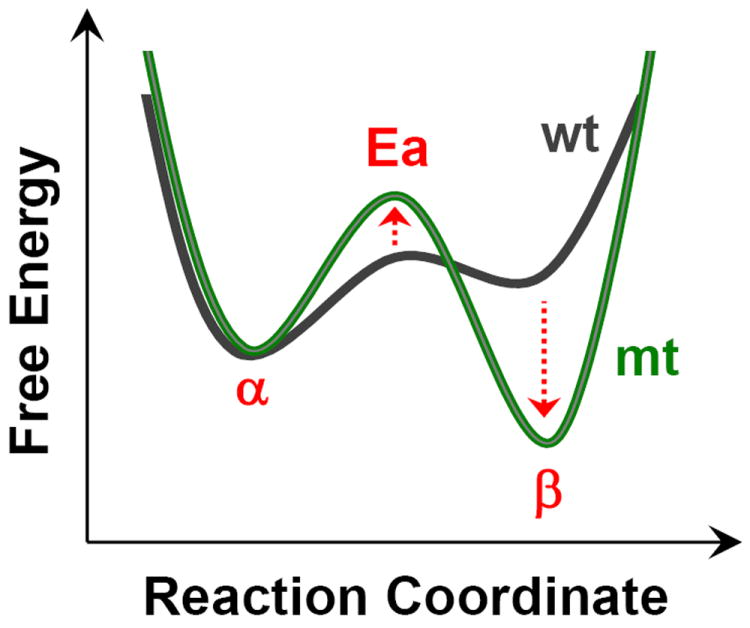
The mutations studied in this work (except T50A) stabilize the β-conformer respect to the α-conformer and raise the activation barrier between the two conformers (for details, see the text).
It is noteworthy that in most oxidases, the α-conformer is the dominant species, and when mutants were made in which the β-form became dominant, the activity of the enzymes was typically lost, indicating that the α-conformer, not the β-conformer, is the active form of the enzyme, as we concluded in this work for PdCcO. However, in cbb3 oxidase, the β-conformer is the major species, but the enzyme is fully active [44]. We propose that in cbb3 oxidase, the inactive β-conformer has a lower energy, but the energy barrier separating the α- and β-conformers is low; hence the enzyme can freely access the active α-conformation, accounting for its full catalytic activity.
In addition to the α- and β-forms of the CO-adduct of CcOs, multiple forms of the enzyme have been reported in other states of the enzyme as well. Brunori and coworkers showed that the ferric derivative of the enzyme can exist in two conformations: the as-purified “resting” form and the “pulsed” form (resulting from the turnover of the enzyme with oxygen [45, 46], or from the oxidation of the enzyme in the absence of oxygen [40]). The “resting” and “pulsed” forms of the enzyme were found to exhibit very different kinetic ligand binding and electron transfer properties, and were thought to persist throughout the reaction cycle and are regulated by oxygen binding to the heme a3 and the electron flux between the redox centers [40]. Furthermore, the OH intermediate formed at the end of turnover, which is able to pump proton during its subsequent reduction, has been proposed to be the pulsed form of the enzyme, which subsequently relaxes to the resting form, which is incapable of pumping protons [41, 43, 47]. Although the structural differences between the “resting” and “pulsed” forms of the enzyme remain to be resolved, it has been postulated that the heme a3 axial ligation states in the two enzyme forms are distinctive [41, 48, 49], implying that, like the α/β forms of the CO-adduct, the “resting” and “pulsed” forms of the enzyme may be associated with different heme a3-CuB distances.
Along similar lines, the crystallographic data of RsCcO revealed significant structural differences between the oxidized and reduced forms of the enzyme: with respect to the oxidized form, the porphyrin plane of the heme a3 in the reduced form rotates ~6-8° about the carbonyl group of the A ring propionate sidechain; the heme a3 iron-CuB distance increases from 4.9 to 5.4 Å (although this was in-part associated with the movement of the iron out of the heme plane upon the reduction of the heme a3 iron); the H-bond between the OH group of the farnesyl sidechain and Y288 lengthens from 2.6 to 4.1 Å due to the rotation of the farnesyl sidechain; in addition, several residues in the helices VIII, IX and X exhibits significant conformational changes [11].
The observations of two conformers in the various CcO enzymes suggest that the fluctuations between the two conformers may play an important role in regulating the coupling between the redox chemistry and proton translocation.
CONCLUSIONS
Our studies of the CO derivatives of PdCcO showed that the enzyme coexists in two distinct conformers. In the α–conformer, the porphyrin ring of the heme a3 has symmetry lower than D4h due to an in-plane distortion; in addition, the heme a3-CuB distance is short, thereby impacting the bonding properties of the Fe-C-O moiety. In the β–conformer, the protein structure is relaxed, the Fe-CuB distance is lengthened and the symmetry of the heme is increased. The variation in the relative population of the two conformers upon the mutations near the heme a and the heme a3-CuB binuclear center indicates that the native structure of the enzyme and the energy barrier separating the two conformers are delicately controlled by various intramolecular interactions. The ability for the enzyme to adopt two conformers may be required for capturing the energy released in the oxygen reduction chemistry for proton pumping [5, 11, 33-43].
Supplementary Material
Acknowledgments
This work was supported by the National Institutes of Health Grant GM 074982.
Abbreviations
- CcO
Cytochrome c oxidase
- bCcO, PdCcO, and RsCcO
bovine, Paracoccus denitrificans, and Rhodobacter spaeroides Cytochrome c Oxidase, respectively
- νFe-CO, νC-O, δFe-C-O
Fe-CO, C-O stretching modes and Fe-C-O bending modes, repectively
Footnotes
Publisher's Disclaimer: This is a PDF file of an unedited manuscript that has been accepted for publication. As a service to our customers we are providing this early version of the manuscript. The manuscript will undergo copyediting, typesetting, and review of the resulting proof before it is published in its final citable form. Please note that during the production process errors may be discovered which could affect the content, and all legal disclaimers that apply to the journal pertain.
References
- 1.Aoyama H, Muramoto K, Shinzawa-Itoh K, Hirata K, Yamashita E, Tsukihara T, Ogura T, Yoshikawa S. Proc Natl Acad Sci U S A. 2009;106:2165–2169. doi: 10.1073/pnas.0806391106. [DOI] [PMC free article] [PubMed] [Google Scholar]
- 2.Shimokata K, Katayama Y, Murayama H, Suematsu M, Tsukihara T, Muramoto K, Aoyama H, Yoshikawa S, Shimada H. Proc Natl Acad Sci U S A. 2007;104:4200–4205. doi: 10.1073/pnas.0611627104. [DOI] [PMC free article] [PubMed] [Google Scholar]
- 3.Tsukihara T, Aoyama H, Yamashita E, Tomizaki T, Yamaguchi H, Shinzawa-Itoh K, Nakashima R, Yaono R, Yoshikawa S. Science. 1995;269:1069–1074. doi: 10.1126/science.7652554. [DOI] [PubMed] [Google Scholar]
- 4.Tsukihara T, Aoyama H, Yamashita E, Tomizaki T, Yamaguchi H, Shinzawa-Itoh K, Nakashima R, Yaono R, Yoshikawa S. Science. 1996;272:1136–1144. doi: 10.1126/science.272.5265.1136. [DOI] [PubMed] [Google Scholar]
- 5.Tsukihara T, Shimokata K, Katayama Y, Shimada H, Muramoto K, Aoyama H, Mochizuki M, Shinzawa-Itoh K, Yamashita E, Yao M, Ishimura Y, Yoshikawa S. Proc Natl Acad Sci U S A. 2003;100:15304–15309. doi: 10.1073/pnas.2635097100. [DOI] [PMC free article] [PubMed] [Google Scholar]
- 6.Yoshikawa S, Shinzawa-Itoh K, Nakashima R, Yaono R, Yamashita E, Inoue N, Yao M, Fei MJ, Libeu CP, Mizushima T, Yamaguchi H, Tomizaki T, Tsukihara T. Science. 1998;280:1723–1729. doi: 10.1126/science.280.5370.1723. [DOI] [PubMed] [Google Scholar]
- 7.Yoshikawa S, Shinzawa-Itoh K, Tsukihara T. J Inorg Biochem. 2000;82:1–7. doi: 10.1016/s0162-0134(00)00137-9. [DOI] [PubMed] [Google Scholar]
- 8.Abramson J, Riistama S, Larsson G, Jasaitis A, Svensson-Ek M, Laakkonen L, Puustinen A, Iwata S, Wikstrom M. Nat Struct Biol. 2000;7:910–917. doi: 10.1038/82824. [DOI] [PubMed] [Google Scholar]
- 9.Iwata S, Ostermeier C, Ludwig B, Michel H. Nature. 1995;376:660–669. doi: 10.1038/376660a0. [DOI] [PubMed] [Google Scholar]
- 10.Qin L, Hiser C, Mulichak A, Garavito RM, Ferguson-Miller S. Proc Natl Acad Sci U S A. 2006;103:16117–16122. doi: 10.1073/pnas.0606149103. [DOI] [PMC free article] [PubMed] [Google Scholar]
- 11.Qin L, Liu J, Mills DA, Proshlyakov DA, Hiser C, Ferguson-Miller S. Biochemistry. 2009;48:5121–5130. doi: 10.1021/bi9001387. [DOI] [PMC free article] [PubMed] [Google Scholar]
- 12.Svensson-Ek M, Abramson J, Larsson G, Tornroth S, Brzezinski P, Iwata S. J Mol Biol. 2002;321:329–339. doi: 10.1016/s0022-2836(02)00619-8. [DOI] [PubMed] [Google Scholar]
- 13.Pfitzner U, Odenwald A, Ostermann T, Weingard L, Ludwig B, Richter OM. J Bioenerg Biomembr. 1998;30:89–97. doi: 10.1023/a:1020515713103. [DOI] [PubMed] [Google Scholar]
- 14.Calhoun MW, Thomas JW, Gennis RB. Trends Biochem Sci. 1994;19:325–330. doi: 10.1016/0968-0004(94)90071-x. [DOI] [PubMed] [Google Scholar]
- 15.Gennis RB. Proc Natl Acad Sci U S A. 1998;95:12747–12749. doi: 10.1073/pnas.95.22.12747. [DOI] [PMC free article] [PubMed] [Google Scholar]
- 16.Ferguson-Miller S, Babcock GT. Chem Rev. 1996;96:2889–2908. doi: 10.1021/cr950051s. [DOI] [PubMed] [Google Scholar]
- 17.Das TK, Tomson FL, Gennis RB, Gordon M, Rousseau DL. Biophys J. 2001;80:2039–2045. doi: 10.1016/S0006-3495(01)76177-2. [DOI] [PMC free article] [PubMed] [Google Scholar]
- 18.Fiamingo FG, Jung DW, Alben JO. Biochemistry. 1990;29:4627–4633. doi: 10.1021/bi00471a018. [DOI] [PubMed] [Google Scholar]
- 19.Mitchell DM, Muller JD, Gennis RB, Nienhaus GU. Biochemistry. 1996;35:16782–16788. doi: 10.1021/bi961722z. [DOI] [PubMed] [Google Scholar]
- 20.Mitchell DM, Shapleigh JP, Archer AM, Alben JO, Gennis RB. Biochemistry. 1996;35:9446–9450. doi: 10.1021/bi960392f. [DOI] [PubMed] [Google Scholar]
- 21.Shapleigh JP, Hill JJ, Alben JO, Gennis RB. J Bacteriol. 1992;174:2338–2343. doi: 10.1128/jb.174.7.2338-2343.1992. [DOI] [PMC free article] [PubMed] [Google Scholar]
- 22.Uno T, Nishimura Y, Tsuboi M, Kita K, Anraku Y. J Biol Chem. 1985;260:6755–6760. [PubMed] [Google Scholar]
- 23.Wang J, Takahashi S, Hosler JP, Mitchell DM, Ferguson-Miller S, Gennis RB, Rousseau DL. Biochemistry. 1995;34:9819–9825. doi: 10.1021/bi00031a001. [DOI] [PubMed] [Google Scholar]
- 24.Fiamingo FG, Altschuld RA, Alben JO. J Biol Chem. 1986;261:12976–12987. [PubMed] [Google Scholar]
- 25.Alben JO, Moh PP, Fiamingo FG, Altschuld RA. Proc Natl Acad Sci U S A. 1981;78:234–237. doi: 10.1073/pnas.78.1.234. [DOI] [PMC free article] [PubMed] [Google Scholar]
- 26.Fiamingo FG, Altschuld RA, Moh PP, Alben JO. J Biol Chem. 1982;257:1639–1650. [PubMed] [Google Scholar]
- 27.Riistama S, Laakkonen L, Wikstrom M, Verkhovsky MI, Puustinen A. Biochemistry. 1999;38:10670–10677. doi: 10.1021/bi990885v. [DOI] [PubMed] [Google Scholar]
- 28.Rousseau DL. J Raman Spectrosc. 1981;10:94–99. [Google Scholar]
- 29.Argade PV, Ching YC, Rousseau DL. Biophys J. 1986;50:613–620. doi: 10.1016/S0006-3495(86)83500-7. [DOI] [PMC free article] [PubMed] [Google Scholar]
- 30.Hagarman A, Wallace CJ, Laberge MM, Schweitzer-Stenner R. Journal of Raman Spectroscopy. 2008;39:1848–1858. [Google Scholar]
- 31.Czernuszewicz RS, Li XY, Spiro TG. Journal of the American Chemical Society. 2002;111:7024–7031. [Google Scholar]
- 32.Durr KL, Koepke J, Hellwig P, Muller H, Angerer H, Peng G, Olkhova E, Richter OM, Ludwig B, Michel H. J Mol Biol. 2008;384:865–877. doi: 10.1016/j.jmb.2008.09.074. [DOI] [PubMed] [Google Scholar]
- 33.Behr J, Hellwig P, Mantele W, Michel H. Biochemistry. 1998;37:7400–7406. doi: 10.1021/bi9731697. [DOI] [PubMed] [Google Scholar]
- 34.Chan SI, Li PM. Biochemistry. 1990;29:1–12. doi: 10.1021/bi00453a001. [DOI] [PubMed] [Google Scholar]
- 35.Larsen RW, Pan LP, Musser SM, Li ZY, Chan SI. Proc Natl Acad Sci U S A. 1992;89:723–727. doi: 10.1073/pnas.89.2.723. [DOI] [PMC free article] [PubMed] [Google Scholar]
- 36.Quenneville J, Popovic DM, Stuchebrukhov AA. J Phys Chem B. 2004;108:18383–18389. [Google Scholar]
- 37.Sharpe MA, Ferguson-Miller S. J Bioenerg Biomembr. 2008;40:541–549. doi: 10.1007/s10863-008-9182-6. [DOI] [PMC free article] [PubMed] [Google Scholar]
- 38.Wikstrom M. Nature. 1984;308:558–560. doi: 10.1038/308558a0. [DOI] [PubMed] [Google Scholar]
- 39.Wikstrom M, Verkhovsky MI, Hummer G. Biochim Biophys Acta. 2003;1604:61–65. doi: 10.1016/s0005-2728(03)00041-0. [DOI] [PubMed] [Google Scholar]
- 40.Wilson MT, Peterson J, Antonini E, Brunori M, Colosimo A, Wyman J. Proc Natl Acad Sci U S A. 1981;78:7115–7118. doi: 10.1073/pnas.78.11.7115. [DOI] [PMC free article] [PubMed] [Google Scholar]
- 41.Bloch D, Belevich I, Jasaitis A, Ribacka C, Puustinen A, Verkhovsky MI, Wikstrom M. Proc Natl Acad Sci U S A. 2004;101:529–533. doi: 10.1073/pnas.0306036101. [DOI] [PMC free article] [PubMed] [Google Scholar]
- 42.Rousseau DL. Nature. 1999;400:412–413. doi: 10.1038/22664. [DOI] [PubMed] [Google Scholar]
- 43.Verkhovsky MI, Jasaitis A, Verkhovskaya ML, Morgan JE, Wikstrom M. Nature. 1999;400:480–483. doi: 10.1038/22813. [DOI] [PubMed] [Google Scholar]
- 44.Wang J, Gray KA, Daldal F, Rousseau DL. J Amer Chem Soc. 2002;117:9363–9364. [Google Scholar]
- 45.Antonini E, Brunori M, Colosimo A, Greenwood C, Wilson MT. Proc Natl Acad Sci U S A. 1977;74:3128–3132. doi: 10.1073/pnas.74.8.3128. [DOI] [PMC free article] [PubMed] [Google Scholar]
- 46.Brunori M, Colosimo A, Rainoni G, Wilson MT, Antonini E. J Biol Chem. 1979;254:10769–10775. [PubMed] [Google Scholar]
- 47.Brunori M, Giuffre A, Sarti P. J Inorg Biochem. 2005;99:324–336. doi: 10.1016/j.jinorgbio.2004.10.011. [DOI] [PubMed] [Google Scholar]
- 48.Brudvig GW, Stevens TH, Morse RH, Chan SI. Biochemistry. 1981;20:3912–3921. doi: 10.1021/bi00516a039. [DOI] [PubMed] [Google Scholar]
- 49.Morgan JE, Blair DF, Chan SI. J Inorg Biochem. 1985;23:295–302. doi: 10.1016/0162-0134(85)85038-8. [DOI] [PubMed] [Google Scholar]
Associated Data
This section collects any data citations, data availability statements, or supplementary materials included in this article.