Abstract
In this study, we determined the molecular mechanism of γ-tocotrienol (GTT) in preventing cellular aging by focusing on its anti-apoptotic effect in stress-induced premature senescence (SIPS) model of human diploid fibroblasts (HDFs). Results obtained showed that SIPS exhibited senescent-phenotypic characteristic, increased expression of senescence-associated β-galactosidase (SA β-gal) and promoted G0/G1 cell cycle arrest accompanied by shortening of telomere length with decreased telomerase activity. Both SIPS and senescent HDFs shared similar apoptotic changes such as increased Annexin V-FITC positive cells, increased cytochrome c release and increased activation of caspase-9 and caspase-3 (P < 0.05). GTT treatment resulted in a significant reduction of Annexin V-FITC positive cells, inhibited cytochrome c release and decreased activation of caspase-9 and caspase-3 (P < 0.05). Gene expression analysis showed that GTT treatment down regulated BAX mRNA, up-regulated BCL2A1 mRNA and decreased the ratio of Bax/Bcl-2 protein expression (P < 0.05) in SIPS. These findings suggested that GTT inhibits apoptosis by modulating the upstream apoptosis cascade, causing the inhibition of cytochrome c release from the mitochondria with concomitant suppression of caspase-9 and caspase-3 activation. In conclusion, GTT delays cellular senescence of human diploid fibroblasts through the inhibition of intrinsic mitochondria-mediated pathway which involved the regulation of pro- and anti-apoptotic genes and proteins.
1. Introduction
Replicative senescence is the final in vitro state reached by all primary cells in culture and is characterized by decreased total cell numbers and loss of proliferation capacity, in which they remain alive and metabolically active [1]. It has been widely used to identify aging-associated molecular changes in human cells and correlated with the in vivo aging process [2]. Recently, the term stress-induced premature senescence (SIPS) was introduced to represent an irreversible growth arrest of proliferative cells induced by exogenous oxidative agents.
The imbalance between cellular oxidants and antioxidants leads to oxidative damage to cellular macromolecules thus contributing to the decline in cellular functions and finally progressive organism aging [3]. Vitamin E in particular alpha-tocopherol protects biological membrane from oxidation by acting as a radical chain-breaking molecule. Other biological functions of vitamin E that are unrelated to its antioxidant properties include its roles in cellular signaling, gene expression, immune response, and apoptosis are now considered to be of importance [4].
Recently, an isomer of vitamin E, the tocotrienols have gained increasing interest due to their stronger antioxidant effects and a nonantioxidant activity profile that differs from tocopherols [5]. Tocotrienols were found not only to have antioxidant function, but also modulate signal transduction and gene expression. In cellular aging, tocotrienols have been observed to decrease biomarkers of senescent cells, reduced damaged DNA, decreased cells in G0/G1 phase, and promoted cells to enter S phase [6]. However, the mechanism of action in delaying aging is not fully understood.
Other reports have also shown that tocotrienol administration reduced oxidative protein damage and consequently extended the mean life span of C. elegans [7]. γ-Tocotrienol at low concentration protected against H2O2-induced cell loss in fibroblast cell lines derived from different age groups. γ-Tocotrienol was also able to protect against H2O2-induced telomere shortening and telomerase activity loss [8].
Accumulating evidence suggested that dysregulation of apoptosis is associated with the aging process. Oxidative stress and DNA damage, both being important factors in the aging process, induce apoptosis. Previous study had shown that apoptosis was upregulated during aging in various cells [9]. Other report showed that apoptotic changes were increased in senescent endothelial cells [10].
In the present study, we determined the binding of Annexin V-FITC to phosphatidylserine (PS) on plasma membrane. FITC-conjugated Annexin V is widely used to detect apoptotic cells in a diverse range of cell types and in response to many different proapoptotic stimuli [11]. It has been reported that PS translocation to the outer leaflet of plasma membrane is the early and widespread event during apoptosis of cells from numerous lineages and is inhibited by overexpression of apoptosis repressor proteins such as Bcl-2 [11, 12].
Caspases are a family of proteases that play major roles in apoptosis process. Caspase-3, caspase-6, and caspase-7, known as executioner caspases, are located down stream of the caspase-8 or caspase-9 activation cascade. Activation of executioner caspases is responsible for the proteolytic cleavage of a broad range of proteins [13].
Bax, a member of the Bcl-2 protein family, is involved in controlling apoptotic events. High level of Bcl-2 inhibits apoptosis by preventing cytochrome c release while high level of Bax induces apoptosis by binding to the mitochondrial membrane and increases membrane permeability allowing the release of cytochrome c [14]. The mitochondrial outer membrane permeability induced either by Bax- or Bak-dependent proapoptotic drugs, or by H2O2 results in the intracytosolic release of cytochrome c but the subsequent caspase activation is required to induce the translocation of apoptosis-inducing factor (AIF) into the cytosol. Therefore, mitochondrial response to several proapoptotic stimuli was suggested as a selective process leading to a hierarchical ordering of the effectors involved in cell death induction [15].
To date, there have been very few studies on the antiapoptotic effects of tocotrienol on normal fibroblasts in vitro. In the present study, we first established the SIPS model of primary HDFs by comparing the cellular senescence markers between SIPS and replicative senescent HDFs. We then determined the molecular apoptotic events involved in SIPS and the effects of γ-tocotrienol in modulating the apoptosis pathway and thus delaying cellular aging.
2. Results
2.1. Characterization of HDFs Stress-Induced Premature Senescence (SIPS)
Control young HDFs displayed the normal spindle shape characteristic of fibroblast cells, while prolonged exposure to 20 μM H2O2 resulted in HDFs exhibiting senescence features such as cells were enlarged and flattened with increased size of nucleus. Less spindle-shaped cells were present and accumulation of granular cytoplasmic inclusions was observed in SIPS and control senescent HDFs (Figure 1(a)). SA-β-galactosidase staining was also positive in SIPS and control senescent cells (Figure 1(b)). The percentage of SA-β-gal positive cells was markedly increased in SIPS and control senescent cells as compared to control young HDFs (P < 0.05) (Figure 1(c)).
Figure 1.
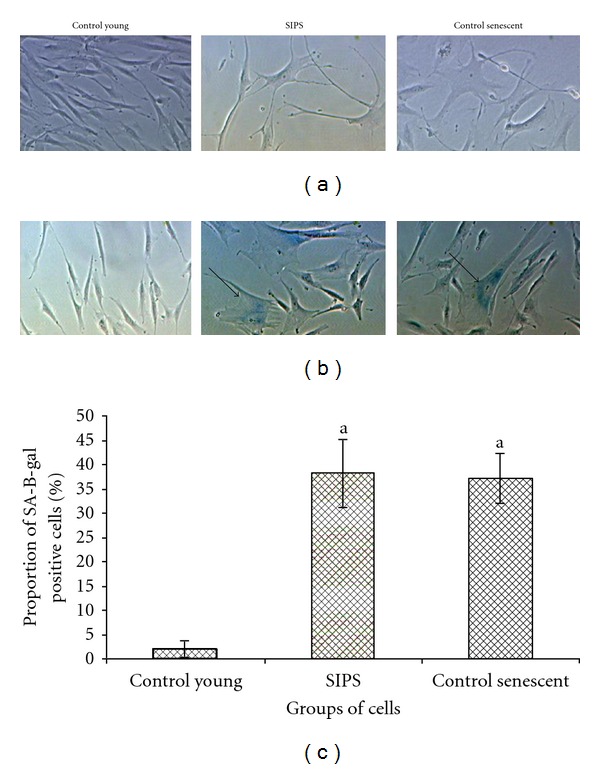
Morphological changes in HDFs in culture (a). Senescence-associated β-galactosidase staining. Positive blue stains of SA β-gal appeared in SIPS and control senescent HDFs as indicated by arrows. Micrographs are shown at 100x magnification (b). Quantitative analysis of positive β-galactosidase stained cells (c). Data are expressed as means ± SD, n = 6. adenotes P < 0.05 compared to control young.
Analysis on cell cycle profile showed that HDFs population in G0/G1 phase was significantly increased while S phase and G2/M phase cells decreased in SIPS as compared to control young HDFs (Figures 2(a) and 2(b)) (P < 0.05). Similar increase and decrease in G0/G1 phase and S phase cells, respectively, were observed in control senescent HDFs (P < 0.05).
Figure 2.
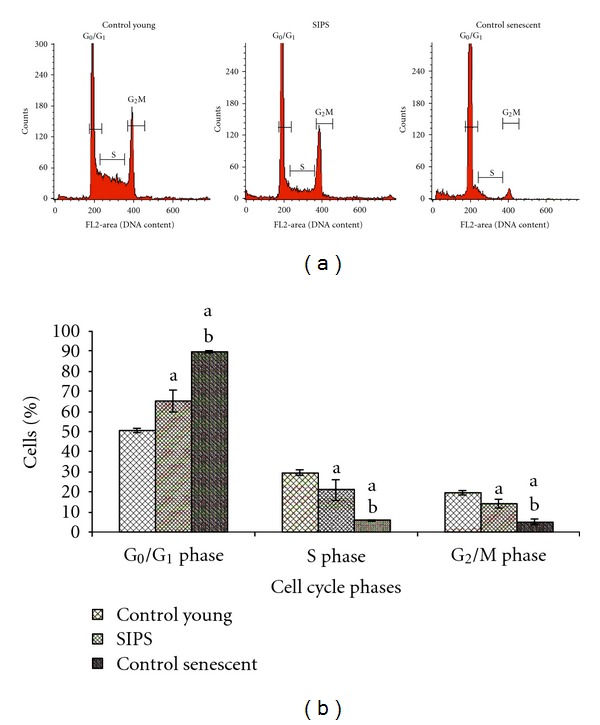
Flow cytometry analysis of cell cycle progression in young, SIPS, and control senescent HDFs (a). Quantitative analysis of cell cycle progression in control young HDFs, SIPS, and control senescent HDFs. Cell population in the G0/G1 phase was significantly increased while S phase cells decreased in SIPS and control senescent HDFs (b). adenotes P < 0.05 compared to control young HDFs, b P<0.05 compared to SIPS. Comparison was done between HDFs in the same phase of cell cycle. Data is presented as mean ± SD, n = 6.
Shortening of telomere length was observed in SIPS and control senescent HDFs as compared to young HDFs (P < 0.05) (Figures 3(a) and 3(b)). Similarly, decreased telomerase activity was observed both in SIPS and control senescent HDFs (Figures 4(a) and 4(b)).
Figure 3.
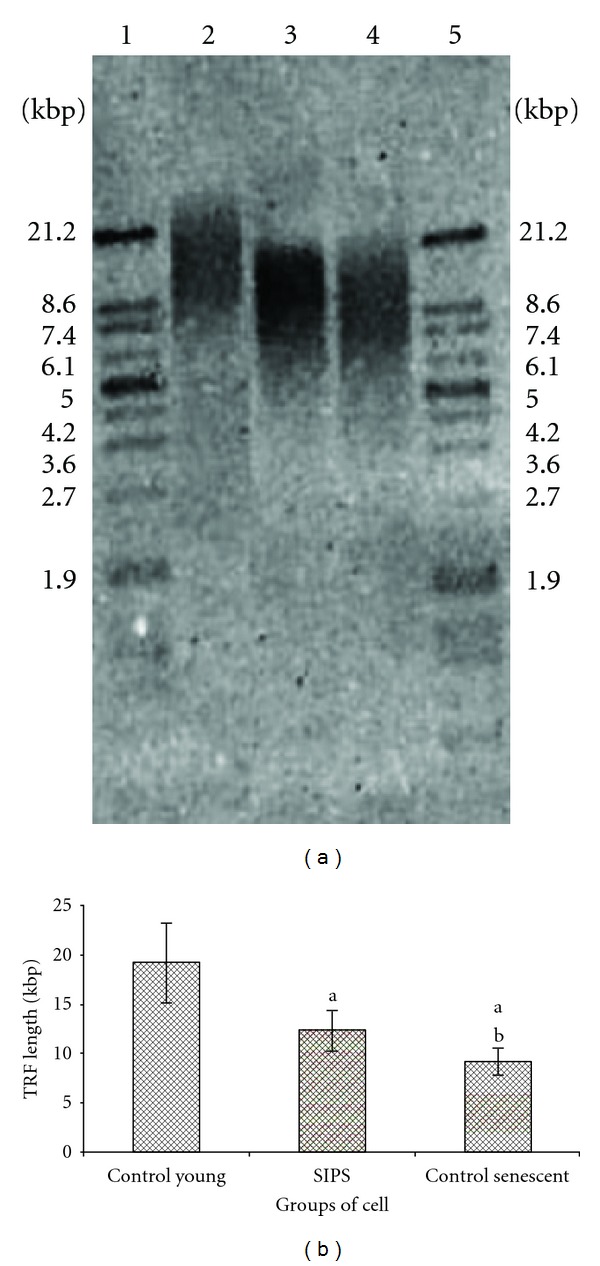
Representative Southern blot analysis of control young HDFs, SIPS, and control senescent HDFs. Telomeric DNA was shown as wide smears in all lanes. The telomere length was represented by mean terminal restriction fragment (TRF) value. Lane 1; molecular weight marker, lane 2; control young HDFs, lane 3; SIPS, lane 4; senescent HDFs, lane 5; molecular weight marker (a). Terminal restriction fragment, (TRF length) of young HDFs, SIPS, and control senescent HDFs. Shortening of telomere length was observed in SIPS and control senescent HDFs (b). adenotes P < 0.05 compared to young HDFs, b P<0.05 compared to SIPS. Data is presented as mean ± SD, n = 6.
Figure 4.
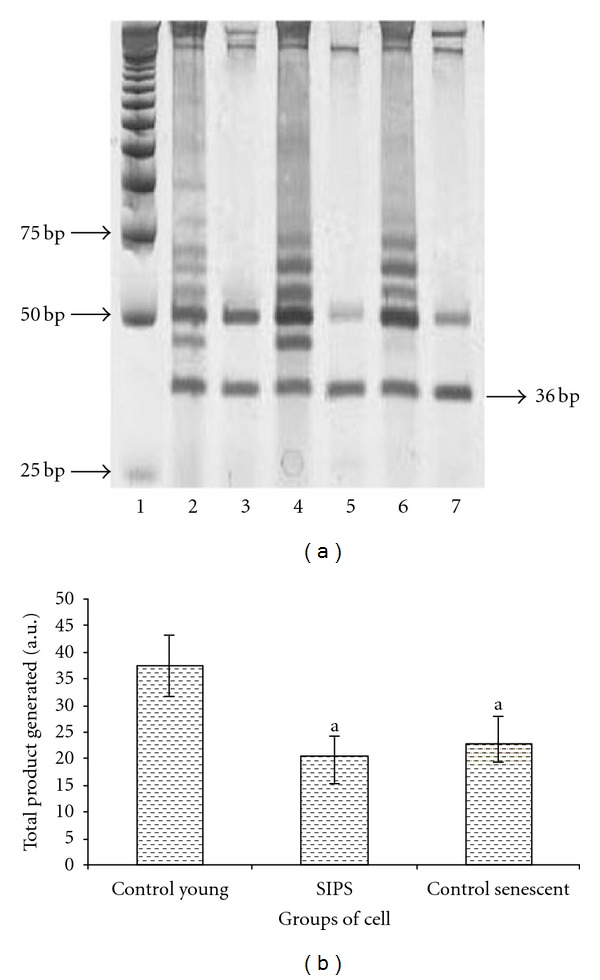
Representative PCR analysis for telomerase activity of control young, SIPS, and control senescent HDFs. Lane 1, molecular weight marker, lane 2, control young, lane 3, control young (heat treated), lane 4, SIPS, lane 5, SIPS (heat treated), lane 6, control senescent, and lane 7, control senescent (heat treated). Band at 36 bp represents the internal control for the assay (a). Telomerase activity (Total Product Generated, TPG) of control young, SIPS, and control senescent HDFs. Reduction in telomerase activity was observed in SIPS and control senescent HDFs (b). adenotes P < 0.05 compared to control young HDFs. Data is presented as mean ± SD, n = 6.
2.2. Apoptotic Changes Detected by Annexin V-FITC
Figure 5(a) shows the contour diagram of FITC-Annexin V/PI double staining by flow cytometry analysis. The three quadrants represent different cells conditions: the upper right quadrant (R1) indicates nonviable, late apoptotic, and necrotic cells (FITC+/PI+), lower left quadrant (R2) indicates viable cells (FITC−/PI−), and lower right quadrant (R3) indicates early apoptotic cells (FITC+/PI−) which is demonstrated by Annexin V binding and cytoplasmic membrane integrity. The percentage of cells at early apoptotic stage was significantly increased in SIPS and control senescent cells as compared to control young HDFs (P < 0.05) (Figure 5(b)). GTT treatment in SIPS significantly decreased the percentage of early apoptotic cells as compared to SIPS alone (P < 0.05).
Figure 5.
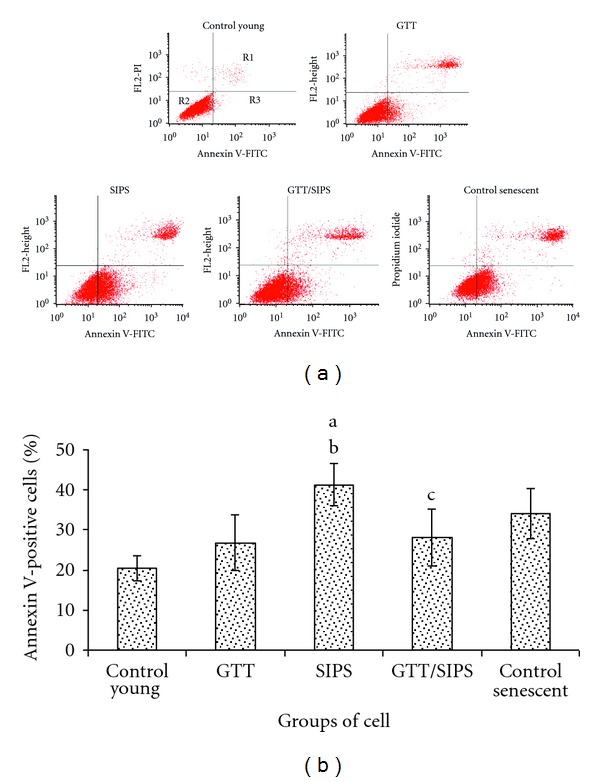
Contour diagram of FITC-Annexin V/PI double staining by flow cytometry. The three quadrants represent different cells conditions: the upper right quadrant (R1); nonviable, late apoptotic and necrotic cells (FITC+/PI+), lower left quadrant (R2); viable cells (FITC−/PI−), and lower right quadrant (R3); early apoptotic cells (FITC+/PI−) (a). Percentage of cells at early apoptotic stage demonstrated by FITC+/PI− (b). Data are expressed as means ± SD, n = 6. adenotes P < 0.05 compared to control young, b P<0.05 compared to GTT, and c P<0.05 compared to SIPS.
2.3. Activation of Caspase-3, Caspase-8, and Caspase-9
Significant activation of caspase-8 and caspase-9 was observed in SIPS and control senescent cells as compared to control young and GTT-treated control HDFs (P < 0.05) (Figure 6(b)) while caspase-3 was significantly activated in SIPS, but not in control senescent cells. GTT treatment of SIPS inhibited caspase-3 and caspase-9 activation with no notable inhibition observed in caspase-8 activation (P < 0.05). In addition, GTT-treated control HDFs showed suppression of caspase-9 activation as compared to untreated young HDFs (P < 0.05).
Figure 6.

Flow cytometry analysis of active caspase-3, caspase-8, and caspase-9 with FITC/PI double staining in HDFs (a). Quantitative analysis of apoptotic cells population for active caspase-3, caspase-8, and caspase-9. (b). Data are expressed as means ± SD, n = 6. adenotes P < 0.05 compared to control young, b P < 0.05 compared to GTT, c P < 0.05 compared to SIPS, and d P < 0.05 compared to control senescent cells.
2.4. Cytochrome c Release
Cytochrome c release was increased in SIPS and control senescent cells as compared to control young cells and GTT-treated control HDFs (P < 0.05) (Figure 7). SIPS cells released 47.7% of cytochrome c from the mitochondria into the cytosol as compared to control young HDFs (1%) and control senescent cells (79.5%). Cytochrome c release decreased significantly to 36.5% in SIPS treated with GTT as compared to SIPS alone (P < 0.05).
Figure 7.
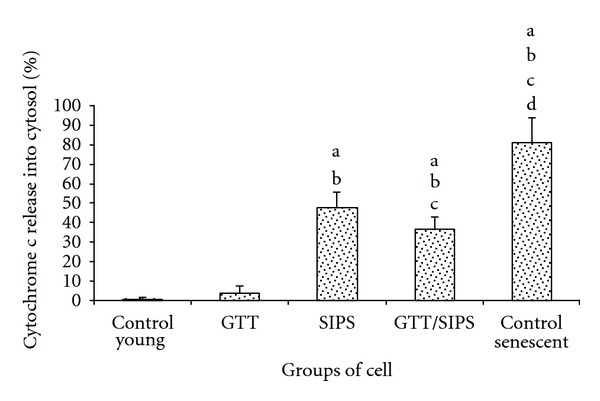
Percentage of mitochondria cytochrome c release in HDFs. Data are presented as means ± SD; n = 6. adenotes P < 0.05 compared to control young, b P < 0.05 compared to GTT, c P < 0.05 compared to SIPS, and d P < 0.05 compared to control senescent cells.
2.5. Analysis of Apoptotic-Associated Genes Expression
Proapoptotic gene, BAX was markedly increased in SIPS and control senescent cells as compared to control young and GTT-treated control HDFs (P < 0.05) (Figure 8(a)). SIPS treated with GTT; however, showed a significant downregulation of BAX (P < 0.05). No significant difference was observed in the expression of another proapoptotic gene, BID in all treatment groups (Figure 8(b)).
Figure 8.
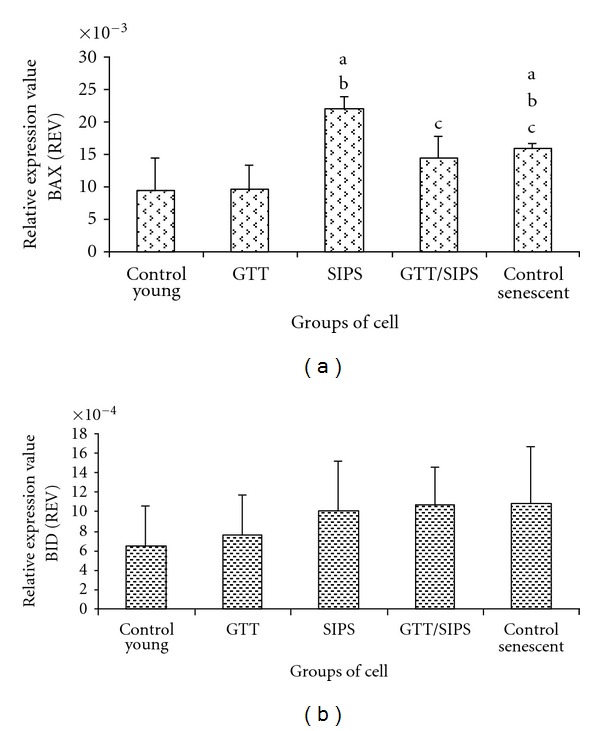
Relative expression value of proapoptotic genes BAX (a) and BID (b). Data are expressed as means ± SD, n = 6. adenotes P < 0.05 compared to control young, b P < 0.05 compared to GTT, and c P < 0.05 compared to SIPS.
Analysis of antiapoptotic genes showed that GTT treatment to control HDFs caused a significant upregulation of BCL2A1 mRNA (P < 0.05) while no change was observed in other treatment groups (Figure 9(a)). Analysis on the expression of another antiapoptotic gene, BCL2L1 showed no significant change observed in all treatment groups (Figure 9(b)).
Figure 9.
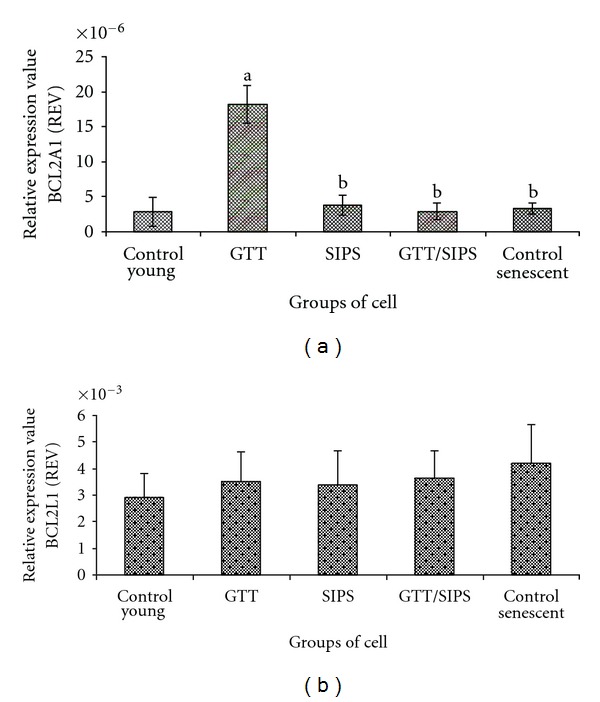
Relative expression value of antiapoptotic genes BCL2A1 (a) and BCL2L1 (b). Data are expressed as means ± SD, n = 6. adenotes P < 0.05 compared to control young and b P < 0.05 compared to GTT.
2.6. Analysis of Bax and Bcl-2 Protein Expression
The ratio of Bax/Bcl-2 protein expression in SIPS and control senescent cells was markedly increased as compared to untreated control young and GTT-treated control HDFs (P < 0.05) (Figure 10). Treatment with GTT in SIPS considerably reversed the effect of H2O2 in Bax/Bcl-2 protein expression whereby the ratio was significantly decreased as compared to SIPS alone (P < 0.05).
Figure 10.
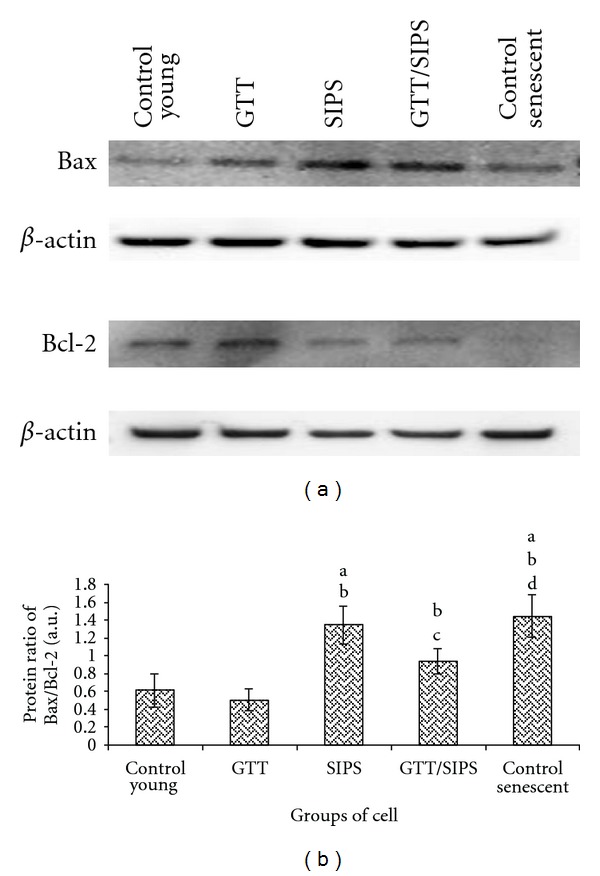
Representative Western blot of proapoptotic protein (Bax) and antiapoptotic protein (Bcl-2) in HDFs (a). Comparison of Bax/Bcl-2 protein ratio and in different treatment groups (b). Data are expressed as means ± SD, n = 6. adenotes P < 0.05 compared to control young, b P < 0.05 compared to GTT, c P < 0.05 compared to SIPS and d P < 0.05 compared to control senescent cells.
3. Discussion
The present study explored the molecular mechanism of GTT in inhibiting apoptosis and delaying cellular aging in H2O2-induced premature senescence (SIPS) of HDFs. Our results confirmed that SIPS demonstrated senescence characteristics as evidenced by senescent-like morphological changes, a significant increase in senescence-associated marker SA-β-galactosidase activity, promoted G0/G1 cell cycle arrest, shortening of telomere length, and decreased telomerase activity. Similar changes were observed for cultures at late stages (replicative senescent cells).
Both SIPS and senescent HDFs shared similar apoptotic changes as shown by increase in Annexin V-FITC positive cells, cytochrome c release, and activation of caspase-9 and caspase-3. These findings were supported by previous studies which reported that premature senescence of fibroblasts can be triggered by induction with acute sublethal doses of H2O2 [16, 17] or prolonged low dose of H2O2 [1].
In this study, we exposed young HDFs to prolonged low dose of H2O2 which mimics the oxidative stress in vivo to induce premature senescence state instead of acute induction with sublethal doses of H2O2. Exposure of prolonged low dose of H2O2 to the embryonic human lung HDFs was found not only induced irreversible cell cycle arrest and senescent-like morphology, but also caused accumulation of damaged DNA accompanied by telomere shortening [1].
The initial step to develop SIPS model is to find doses that are subcytotoxic to the cells. We found that doses of H2O2 30–80 μM slowed down cells growth rate which leads to cell death after 1 week culture while concentrations of H2O2 above 100 μM triggered cell death within 24 h culture (data not shown). Thus, the higher H2O2 concentration used, the higher the proportion of cells undergoing apoptosis and cell death was observed. Our results confirmed that induction of H2O2 for 2 weeks induced the premature senescence state of young HDFs, where they demonstrated senescence characteristics as evidenced by senescent-like morphological changes and a significant increase in senescence-associated marker SA-β-galactosidase activity which was similar to replicative senescent cells. Previously, human foreskin fibroblasts which were exposed to H2O2 for 7 days demonstrated positive staining for SA-β-gal [18] indicating cellular senescence. Therefore, based on these findings we decided to use the dose of 20 μM H2O2 for 2 weeks to induce SIPS in HDFs.
One of the mechanisms mediating the development of senescent phenotype is telomere shortening. In this study, we found that both SIPS and senescent cells demonstrated shortening of telomere length with concomitant reduction in telomerase activity. We further determined cell cycle progression which showed that SIPS cells were mainly at G0/G1 phase and decrease cell population in S phase indicating they might enter the irreversible growth arrest state followed by apoptosis. The reduction in S phase cells in SIPS suggested a slowing down of cellular proliferation which was similar to that of senescent cells. Previous in vitro study reported that H2O2-induced premature senescence and spontaneous senescent fibroblasts activated the apoptosis pathway as evidenced by activation of caspases in both groups of fibroblasts [19]. Human fibroblasts showed increased number of dead cells with increasing passage and increase in DNA fragmentation and mitochondrial dysfunction represented by loss of mitochondrial membrane potential, increased caspase-3, and increased cytochrome c positive cells [20]. Further identification of the molecular apoptotic changes in SIPS and senescent HDFs showed that Annexin V-FITC positive cells were increased both in SIPS and replicative senescent HDFs confirming early apoptotic changes occurred in both groups of cells.
Characterization of the apoptotic events in stress-induced premature senescence of HDFs showed that in SIPS, caspase-3 was activated not only by the activation of caspase-9 but also by caspase-8. These findings are consistent with a study done by Nagase et al. [21] and suggested that apoptosis pathway is activated during stress-induced cellular aging of HDFs. The activation of caspase-3, -8, and-9 indicated that both cell-surface-death receptor pathway and the intrinsic mitochondrial pathway are involved in inducing cell death during stress-induced premature senescence of HDFs [19].
We further investigated the involvement of mitochondrion-initiated pathway for both SIPS and senescent HDFs by determining the percentage of cytochrome c release from the mitochondria to the cytosol. We found that both SIPS and replicative senescent HDFs displayed significantly high percentage of cytochrome c release.
The induction of cytochrome c release can be achieved through various mechanisms, including the involvement of pro- and antiapoptotic proteins such as Bcl-2 family proteins. The 2 classes of proteins are localized to intracellular membranes, particularly mitochondria, and have been shown to interact with each other [22]. Activation of Bax protein resulted in rapid cell death, and this can be inhibited by death-inhibiting proteins; Bcl-2 and Bcl-xL.
Further evaluation of the transcriptional and translational processes involving the expression of Bax and Bcl-2 proteins, the regulators of apoptotic pathway showed that Bax/Bcl-2 protein ratio was increased in SIPS and senescent HDFs indicating activation of apoptotic pathway and inhibition of antiapoptotic pathway with H2O2 induction.
Our data on gene expression analysis showed that BAX expression was significantly increased in SIPS and senescent HDFs while another key proapoptotic gene, BID was not affected by H2O2 induction. As for the antiapoptotic genes BCL2A1 and BCL2L1, our results did not show any significant changes in the expression of both genes in SIPS and cellular senescence of HDFs.
Based on these findings we suggested that both SIPS and replicative senescent HDFs undergo apoptosis. Therefore, further study was carried out to determine the specific stage that GTT intervenes in the apoptosis cascade and thus delaying aging.
Flow cytometry analysis showed that GTT treatment decreased the percentage of Annexin V-FITC positive cells suggesting the prevention of PS translocation to the outer layer of cell membrane, thus inhibiting the early apoptotic changes of HDFs. Besides, GTT treatment to SIPS was found to inhibit the activation of caspase-9 and subsequently caspase-3. Similar effects however were not observed for caspase-8. These results indicated that GTT possessed antiapoptotic effects in preventing stress-induced premature senescence of HDFs which attenuated the key elements of intrinsic caspases in the mitochondrion-initiated pathway.
The involvement of mitochondrion-initiated pathway was further investigated to determine the specific stage that GTT intervenes in the apoptosis cascade. Our results showed a reduction of cytochrome c release with GTT treatment indicating inhibition of stress-induced apoptosis by GTT was probably at the upstream stage in the cascade of events leading to apoptosis. In addition, GTT may also be involved in the regulation of pro- and/or antiapoptotic proteins which induced cytochrome c release from the mitochondria.
Gene expression analysis showed that BCL2A1 was markedly upregulated in control young HDFs treated with GTT. Furthermore, GTT was also found to downregulate BAX in SIPS cells. These findings demonstrated the involvement of GTT in regulating the apoptotic genes expression particularly BAX and BCL2A1 mRNA in normal diploid fibroblast cells.
Treatment of SIPS with GTT was also found to decrease Bax/Bcl-2 protein ratio, suggesting that exogenous antioxidants can modulate Bax and Bcl-2 expression in HDFs exposed to oxidant and thus prevents apoptosis. Several studies have shown that antioxidants may have antiapoptotic or proapoptotic properties, depending on the type of cells and the apoptosis-inducing signal involved, but the trend showed that antioxidants can prevent apoptosis in healthy cells and may promote apoptosis of transformed cells [22, 23].
Previously, it had been demonstrated that high levels of Bcl-2 can prevent the release of cytochrome c and thus caspase activation in response to a number of apoptosis-inducing stimuli such as UVB, staurosporine and etoposide [24, 25]. Therefore, the decrease in Bax/Bcl-2 protein ratio with GGT treatment is suggestive of its action in preventing apoptosis in HDFs subjected to oxidative stress. The antiapoptotic effects of GTT may be attributable not only to its potent antioxidant properties but may also attributed to its nonantioxidant functions.
It is shown that GTT inhibited the apoptosis cascade leading to the prevention of cell death in SIPS. The ability of GTT to inhibit caspases and cytochrome c release upon prolong exposure of H2O2 suggests the underlying mode of action of this compound in preventing oxidative stress-induced apoptosis.
4. Materials and Methods
4.1. Cell Culture
This research has been approved by the Ethics Committee of the Universiti Kebangsaan Malaysia (Approval Project Code: FF-313-2009). Primary HDFs were derived from foreskins of three 9- to 12-year-old boys after circumcision. Written informed consents were obtained from parents of all subjects. The samples were aseptically collected and washed several times with 75% alcohol and phosphate buffered saline (PBS) containing 1% antibiotic-antimycotic solution (PAA, Austria). After removing the epidermis layer, the pure dermis was cut into small pieces and transferred into centrifuge tubes containing 0.03% collagenase type I solution (Worthington Biochemical Corporation, USA). The cells were rinsed with PBS before being cultured in Dulbecco's Modified Essential Medium (DMEM) (Flowlab, Australia) supplemented with 10% bovine fetal serum (FBS) (PAA, Austria) and 1% antibiotic-antimycotic solution at 37°C in a humidified atmosphere at 5% CO2. Cultures were grown to 80–90% confluency in 75-mm culture flasks (Nunc, Denmark) with expansion degree 1 : 4. For subsequent experiments, cells were used at passage 4 (young cells, population doubling; PD < 12) and passage 30 (senescent cell, PD > 55).
4.2. Treatment Protocols
Stress-induced premature senescence model was established by culturing the early passage cells (passage 6) with culture medium containing 20 μM H2O2 for 2 weeks which was replaced every 3 days. Treated cells were preincubated with 1 μM γ-tocotrienol (Malaysian Palm Oil Board, Malaysia) at passage 4 followed by H2O2 induction at passage 6 for 2 weeks. Untreated control cells were cultured without any treatment until similar population doublings were reached.
At the end of the treatment duration, the treated culture medium was replaced by fresh medium containing 10% serum for 3 days to ensure that the observed changes to the cells were not due to lack of mitogenic stimulations [26].
4.3. Morphology Analysis and Senescence-Associated β-Galactosidase (SA-β-gal) Staining
HDFs positive for SA-β-gal activity was determined as described by Dimri et al. [27]. SA-β-gal staining was performed with a senescent cell staining kit (Sigma, USA) according to the manufacturer's instructions. A total of 1 × 10⁵ cells were seeded in six-well plates and incubated with fixation buffer (2% formaldehyde/0.2% glutaraldehyde) for 6–7 min at room temperature. Cells were then rinsed three times with PBS and incubated with 5-bromo-4-chloro-3-indolyl β-D-galactopyranoside at 1 mg/mL in a buffer containing 40 mM citric acid/phosphate (pH 6.0), 5 mM K3FeCN6, 5 mM K4FeCN6, 150 mM NaCl, and 2 mM MgCl2 for 4 h at 37°C in the absence of CO2. Blue staining was visible after incubation, and the percentage of blue cells observed in 100 cells under a light microscope was calculated.
4.4. Cell Cycle Analysis by Flow Cytometry
HDFs were harvested at desired time points after trypsinization and were rinsed 3 times with buffer solution with adjusted concentration 1 × 10⁶ cells/mL and prepared using CycleTEST PLUS DNA Reagent Kit (Becton Dickinson, USA) according to the manufacturer's instruction. Cell cycle status was analyzed by flow cytometer using propidium iodide (PI) as a specific fluorescent dye probe. The PI fluorescence intensity of 10,000 cells was measured for each sample using a Becton–Dickinson FACS Calibur Flow Cytometer.
4.5. Estimation of Telomere Length
Genomic DNA was isolated using Wizard Genomic Purification Kit (Promega, USA) and the assay was carried out using TeloTAGGG Telomere Length Assay kit (Roche, Germany). Three μg of DNA was digested with 20 units each of HinfI and Rsa1 for 2 h at 37°C, electrophoresed on 0.8% agarose gel, and transferred onto nylon membrane Hybond-N+ (Amersham, UK) using 20X SSC (3 M NaCl2, 0.3 M sodium citrate, pH 7.0) transfer buffer. After overnight blotting, DNA was cross-linked to membrane by UV light (150 mJ) and prehybridized for 45 min and hybridized for 3 h at 42°C with digoxigenin (DIG)-labeled telomeric DNA probes. Detection of telomeric restriction fragments (TRFs) was visualized by alkaline phosphatase metabolizing CDP-Star, a highly sensitive chemiluminescence substrate. Smears on the membrane were detected by chemiluminescence signal using Fluorchem FC2 gel documentation system (Alpha Innotech, USA). Densitometry analysis was carried out using ImageMaster TotalLab v1.11 software (Amersham, Germany) by comparing signals relative to DNA molecular weight marker. The mean TRF length was calculated for each sample by integrating the signal density above background over the entire TRF distribution as a function of TRF length, using the formula below:
| (1) |
where ODi and L i are, respectively, the signal intensity and TRF length at position i on the gel image, as described in the manufacturer's recommendations.
4.6. Estimation of Telomerase Activity
The TRAPeze telomerase detection kit (Chemicon, USA) was used as recommended by the manufacturer with minor modifications. For the PCR reaction, 2 μL of extract (corresponding to 100–1000 cells) was added to 48 μL reaction mixture and 2 units of Taq DNA polymerase (Qiagen, USA). A negative control with an enzyme-inactivated sample (2 μL heat-treated cell extract, 10 min at 65°C) was performed parallel to the noninactivated samples to confirm specificity of the products. PCR was performed as follows: primer elongation (30 min, 30°C), telomerase inactivation (4 min, 94°C), and product amplification for 35 cycles (94°C for 30 s, 59°C for 30 s, 72°C for 1 min). The PCR products were electrophoresed on 10% polyacrylamide gel using 0.5X TBE buffer. The gel was further analysed and quantitated using the ImageMaster TotalLab v1.11 software (Amersham, Germany). Telomerase activity (total product generated; TPG) was determined as the ratio of the intensity of telomerase ladders to the intensity of the 36 bp internal standard based on the formula below:
| (2) |
where, X is TRAP product ladder (noninactivated sample); X 0 is TRAP product ladder (enzyme-inactivated sample); r is quantification control TSR 8 (0.5 μL); r 0 is quantification control TSR 8 (1.0 μL); C is assay internal control/S-IC; C R is negative control.
4.7. Detection of Caspase-3 Activation
Caspase-3 activation was determined using the FITC Active Caspase-3 Apoptosis kit (BD Pharmingen, San Diego, CA, USA) according to the manufacturer's instructions. The cells were resuspended in BD Cytofix/Cytoperm buffer in the provided solution at a concentration of 2 × 10⁶ cells/mL and were incubated 20 min in ice. After incubation, pellets were washed twice with BD Perm/Wash buffer and were stained with fluorescein isothiocyannate (FITC)-conjugated with 20 μL antiactive caspase-3 antibody for 30 min at room temperature and subsequently analyzed by FACS Calibur Flow Cytometer (Becton Dickinson, San Jose, CA, USA). Fluorescence was detected with a FL1 detector and histogram data was generated with the CellQuest software.
4.8. Measurement of Active Caspase-8 and Caspase-9
Caspase-8 and caspase-9 activation was analyzed using Caspase-8 Detection Kit and Caspase-9 Detection Kit (Calbiochem, Germany), respectively, according to the manufacturer's instructions. Cells were harvested and incubated with 1 μL fluorescein-labeled caspase inhibitor (FITC-IETD-FMK for caspase-8 and FITC-LEHD-FMK for caspase-9) for 1 h at 37°C in a humidified incubator with 5% CO2. After incubation, cells were centrifuged at 3000 rpm for 5 min. Pellets were then washed with wash buffer and subsequently analyzed by FACS Calibur Flow Cytometer (Becton Dickinson, San Jose, CA, USA). Fluorescence was detected with a FL1 detector and histogram data was generated with the CellQuest software.
4.9. Measurement of Annexin V-FITC
Externalization of phosphatidylserine (PS) at the cell surface of HDFs as an early apoptotic event was assessed by Annexin V-FITC Apoptosis Detection Kit II (BD Pharmingen, San Diego, CA, USA) according to the manufacturer's instructions. This method based on cell staining by FITC-labeled Annexin-V (green flourescein) and propidium iodide (PI) which distinguished between early apoptotic (Annexin V+/PI−) and late apoptotic or necrotic cells (Annexin V+/PI+) [28]. Cells were washed twice with cold PBS and resuspended in 1X binding buffer. Then 5 μL of Annexin V-FITC and 5 μL of PI staining solution were added, followed by incubation for 15 min in the dark at room temperature (25°C). Finally, cells were suspended in 1X binding buffer and analyzed within 1 h by FACS Calibur Flow Cytometer (Becton Dickinson, San Jose, CA, USA).
4.10. Measurement of Mitochondria Cytochrome c Release
The InnoCyte Flow Cytometric Cytochrome c Release Kit (Calbiochem, Germany) was used to quantify mitochondria-associated cytochrome c. This method selectively permeabilized the plasma membrane without injuring the mitochondrial membrane. Cells were resuspended with 300 μL permeabilization buffer and incubated for 10 min in ice. Then, cells were fixed by adding 300 μL 8% paraformaldehyde in PBS, incubated for 20 min at room temperature and were washed with 1 mL 1X wash buffer for 3 times. Cells were centrifuged and pellets were incubated in 250 μL blocking buffer for 1 h at room temperature. Anticytochrome c WS (250 μL) was added and cells were incubated for 1 h at room temperature followed by incubation with 500 μL anti-IgG FITC WS in the dark for 1 h at room temperature. Finally, cells were resuspended in 500 μL wash buffer and analysed by FACS Calibur Flow Cytometer (Becton Dickinson, San Jose, CA, USA).
4.11. Primer Design
Primers for human GAPDH, BAX, BID, BCL2A1, and BCL2L1 were designed with Primer 3 software and blasted with GeneBank database sequences in order to obtain primers with high specificity. The efficiency and specificity of each primer set were confirmed with standard curve (Ct value versus serial dilution of total RNA) and melting profile evaluation. Primer sequences for quantitative gene expression analysis are shown in Table 1.
Table 1.
| Gene definition | Gene symbol | Accession no. | Base pair sequences (RefSeq) |
PCR product size (bp) |
|---|---|---|---|---|
| Homo sapiens BCL2-associated X protein, transcript variant alpha, and mRNA | BAX | NM_138761 | F: 5′acgaactggacagtaacatggag 3′ | |
| R: 5′cagtttgctggcaaagtagaaaag 3′ | 158 bp | |||
| Homo sapiens BH3 interacting domain death agonist, transcript variant 1, and mRNA | BID | NM_197966 | F: 5′tgtgaaccaggagtgagtcg 3′ | |
| R: 5′ctttggaggaagccaaacac 3′ | 122 bp | |||
| Homo sapiens BCL2-related protein A1, transcript variant 1, and mRNA | BCL2A1 | NM_004049 | F: 5′tccaaaaagaagtggaaaagaatc 3′ | |
| R: 5′gctgtcgtagaagtttcttgatga 3′ | 189 bp | |||
| BCL2-like 1 nuclear gene encoding mitochondrial protein, transcript variant 1, and mRNA | BCL2L1 | NM_138578 | F: 5′gcatatcagagctttgaacaggt 3′ | |
| R: 5′taggtggtcattcaggtaagtgg 3′ | 180 bp | |||
| Glyceraldehyde-3- phosphate dehydrogenase, and mRNA | GAPDH | BC_020308 | F: ccaagatgccacagatgattg | |
| R: actccttgggtccacctggta | 217 bp |
4.12. Total RNA Extraction
Total RNA from HDFs in different groups was extracted using TRI Reagent (Molecular Research Center, Cincinnati, OH, USA) according to the manufacturer's instruction. Polyacryl Carrier (Molecular Research Center) was added in each extraction to precipitate the total RNA. Extracted total RNA pellet was then washed with 75% ethanol and dried before being dissolved in RNase and DNase-free distilled water. Total RNA was stored at −80°C immediately after extraction. Yield and purity of the extracted RNA were determined by Nanodrop (Thermo Scientific, USA).
4.13. Quantitative Real-Time RT-PCR
The expression level of BAX, BID, BCL2A1, and BCL2L1 was determined using iScript One-Step RT-PCR Kit with SYBR Green (Biorad, USA) and iQ5 Multicolor Real-Time PCR system (Biorad, USA) with the following reaction profile; cDNA synthesis at 50°C for 20 min, iScript reverse transcriptase inactivation at 95°C for 4 min, followed by 38 cycles of denaturation at 95°C for 10 sec and primer annealing and extension at 61°C for 30 sec. Melt curve analysis was carried out at 95°C for 1 min, 55°C for 1 min, and 60°C for 10 sec (70 cycles, increase set point temperature after cycle 2 by 0.5°C). The expression level of each targeted gene was normalized to glyceraldehyde 3-phosphate dehydrogenase (GAPDH) gene as an internal reference [29]. Agarose gel electrophoresis was performed for confirmation of the PCR products. Relative expression value of target genes was calculated based on the 2−ΔΔCt method of relative quantification [30] by the following equation:
| (3) |
4.14. Western Blotting Analysis
Determination of protein expression was carried out by Western blotting using NuPAGE electrophoresis system (Invitrogen, CA, USA). Protein (25 μg) from each sample was loaded on a 4–12% NuPAGE Novex Bis-Tris gel using NuPAGE MES running buffer followed by dry-blotting of protein using iBlot Transfer Device for 7 min. WesternBreeze Chemiluminescent Kit was used to detect the primary antibodies. After transferring onto nitrocellulose membranes, the membranes were blocked for 30 min with blocking solution and probed with antibodies against Bax (1 : 200, overnight), Bcl-2 (1 : 200, overnight), and β-actin (1 : 1000, 1 h) as an internal control. All antibodies were purchased from Santa Cruz Biotechnology Inc., CA, USA. After 3 washing steps of antibody wash, membranes were incubated with secondary antibody solution (anti-mouse-IgG) for 1 h. Blots were developed using chemiluminescence substrate with enhancer for 7 min. The autoradiographies were scanned using gel documentation system Fluorchem FC2 (Alpha Innotech, USA) and band intensities were quantified by Image Master TotalLab software (Amersham Biosciences, UK).
4.15. Statistical Analysis
Each experiment was carried out in triplicates. Data were reported as means ±SD. Comparison between groups was made by Student t-test (two-tailed). P < 0.05 was considered statistically significant
5. Conclusions
In summary, GTT was found to inhibit the translocation of PS into the outer membrane which is an early event in the apoptosis pathway. The antiapoptotic effect of GTT was through the mitochondria-dependent pathway as shown by GGT preventing the activation of caspase-3 and caspase-9 and reduced the release of cytochrome c from the mitochondria. Genes and proteins expression analysis suggested that GTT stimulated the signaling in the regulation of apoptotic-related genes expression, prevented H2O2-induced apoptosis in HDFs, and delayed cellular aging.
In conclusion, GTT delays cellular senescence of human diploid fibroblasts through the inhibition of intrinsic mitochondria-mediated pathway which involved the regulation of pro- and antiapoptotic genes and proteins.
Acknowledgments
This study was financially supported by Universiti Kebangsaan Malaysia Fundamental Funds (FF-144-2007 and FF-313-2009) and Ministry of Higher Education Grant (UKM-FF-03 FRGS0036-2010).
References
- 1.Duan J, Duan J, Zhang Z, Tong T. Irreversible cellular senescence induced by prolonged exposure to H2O2 involves DNA-damage-and-repair genes and telomere shortening. International Journal of Biochemistry and Cell Biology. 2005;37(7):1407–1420. doi: 10.1016/j.biocel.2005.01.010. [DOI] [PubMed] [Google Scholar]
- 2.Campisi J. Cancer, aging and cellular senescence. In Vivo. 2000;14(1):183–188. [PubMed] [Google Scholar]
- 3.Loeb LA, Wallace DC, Martin GM. The mitochondrial theory of aging and its relationship to reactive oxygen species damage and somatic mtDNA mutations. Proceedings of the National Academy of Sciences of the United States of America. 2005;102(52):18769–18770. doi: 10.1073/pnas.0509776102. [DOI] [PMC free article] [PubMed] [Google Scholar]
- 4.Brigelius-Flohé R. Vitamin E: the shrew waiting to be tamed. Free Radical Biology and Medicine. 2009;46(5):543–554. doi: 10.1016/j.freeradbiomed.2008.12.007. [DOI] [PubMed] [Google Scholar]
- 5.Schaffer S, Müller WE, Eckert GP. Tocotrienols: constitutional effects in aging and disease. Journal of Nutrition. 2005;135(2):151–154. doi: 10.1093/jn/135.2.151. [DOI] [PubMed] [Google Scholar]
- 6.Makpol S, Durani LW, Chua KH, Mohd Yusof YA, Wan Ngah WZ. Tocotrienol-rich fraction prevents cell cycle arrest and elongates telomere length in senescent human diploid fibroblasts. Journal of Biomedicine and Biotechnology. 2011;2011 doi: 10.1155/2011/506171.506171 [DOI] [PMC free article] [PubMed] [Google Scholar]
- 7.Adachi H, Ishii N. Effects of tocotrienols on life span and protein carbonylation in Caenorhabditis elegans. Journals of Gerontology A. 2000;55(6):B280–B285. doi: 10.1093/gerona/55.6.b280. [DOI] [PubMed] [Google Scholar]
- 8.Makpol S, Abidin AZ, Sairin K, Mazlan M, Top GM, Ngah WZW. γ-tocotrienol prevents oxidative stress-induced telomere shortening in human fibroblasts derived from different aged individuals. Oxidative Medicine and Cellular Longevity. 2010;3(1):35–43. doi: 10.4161/oxim.3.1.9940. [DOI] [PMC free article] [PubMed] [Google Scholar]
- 9.Higami Y, Shimokawa I. Apoptosis in the aging process. Cell and Tissue Research. 2000;301(1):125–132. doi: 10.1007/s004419900156. [DOI] [PubMed] [Google Scholar]
- 10.Shan H-Y, Bai XJ, Chen XM. Apoptosis is involved in the senescence of endothelial cells induced by angiotensin II. Cell Biology International. 2008;32(2):264–270. doi: 10.1016/j.cellbi.2007.09.003. [DOI] [PubMed] [Google Scholar]
- 11.Martin SJ, Finucane DM, Amarante-Mendes GP, O’Brien GA, Green DR. Phosphatidylserine externalization during CD95-induced apoptosis of cells and cytoplasts requires ICE/CED-3 protease activity. Journal of Biological Chemistry. 1996;271(46):28753–28756. doi: 10.1074/jbc.271.46.28753. [DOI] [PubMed] [Google Scholar]
- 12.Koopman G, Reutelingsperger CPM, Kuijten GAM, Keehnen RMJ, Pals ST, Van Oers MHJ. Annexin V for flow cytometric detection of phosphatidylserine expression on B cells undergoing apoptosis. Blood. 1994;84(5):1415–1420. [PubMed] [Google Scholar]
- 13.Fischer U, Jänicke RU, Schulze-Osthoff K. Many cuts to ruin: a comprehensive update of caspase substrates. Cell Death and Differentiation. 2003;10(1):76–100. doi: 10.1038/sj.cdd.4401160. [DOI] [PMC free article] [PubMed] [Google Scholar]
- 14.Parone PA, James D, Martinou JC. Mitochondria: regulating the inevitable. Biochimie. 2002;84(2-3):105–111. doi: 10.1016/s0300-9084(02)01380-9. [DOI] [PubMed] [Google Scholar]
- 15.Arnoult D, Parone P, Martinou JC, Antonsson B, Estaquier J, Ameisen JC. Mitochondrial release of apoptosis-inducing factor occurs downstream of cytochrome c release in response to several proapoptotic stimuli. Journal of Cell Biology. 2002;159(6):923–929. doi: 10.1083/jcb.200207071. [DOI] [PMC free article] [PubMed] [Google Scholar]
- 16.de Magalhães JP, Chainiaux F, Remacle J, Toussaint O. Stress-induced premature senescence in BJ and hTERT-BJ1 human foreskin fibroblasts. Federation of European Biochemical Societies. 2002;523(1-2):157–162. doi: 10.1016/s0014-5793(02)02973-3. [DOI] [PubMed] [Google Scholar]
- 17.Zdanov S, Remacle J, Toussaint O. Establishment of H2O2-induced premature senescence in human fibroblasts concomitant with increased cellular production of H 2O2. Annals of the New York Academy of Sciences. 2006;1067(1):210–216. doi: 10.1196/annals.1354.025. [DOI] [PubMed] [Google Scholar]
- 18.Yang N-C, Hu ML. The limitations and validities of senescence associated-β- galactosidase activity as an aging marker for human foreskin fibroblast Hs68 cells. Experimental Gerontology. 2005;40(10):813–819. doi: 10.1016/j.exger.2005.07.011. [DOI] [PubMed] [Google Scholar]
- 19.Ohshima S. Apoptosis in stress-induced and spontaneously senescent human fibroblasts. Biochemical and Biophysical Research Communications. 2004;324(1):241–246. doi: 10.1016/j.bbrc.2004.09.044. [DOI] [PubMed] [Google Scholar]
- 20.Mammone T, Gan D, Foyouzi-Youssefi R. Apoptotic cell death increases with senescence in normal human dermal fibroblast cultures. Cell Biology International. 2006;30(11):903–909. doi: 10.1016/j.cellbi.2006.06.010. [DOI] [PubMed] [Google Scholar]
- 21.Nagase M, Shiota T, Tsushima A, et al. Molecular mechanism of satratoxin-induced apoptosis in HL-60 cells: activation of caspase-8 and caspase-9 is involved in activation of caspase-3. Immunology Letters. 2002;84(1):23–27. doi: 10.1016/s0165-2478(02)00127-x. [DOI] [PubMed] [Google Scholar]
- 22.Reed JC. Double identity for proteins of the Bcl-2 family. Nature. 1997;387(6635):773–776. doi: 10.1038/42867. [DOI] [PubMed] [Google Scholar]
- 23.Palozza P, Serini S, Torsello A, et al. Mechanism of activation of caspase cascade during β-carotene-induced apoptosis in human tumor cells. Nutrition and Cancer. 2003;47(1):76–87. doi: 10.1207/s15327914nc4701_10. [DOI] [PubMed] [Google Scholar]
- 24.Lu G, Shimizu I, Cui X, et al. Antioxidant and antiapoptotic activities of idoxifene and estradiol in hepatic fibrosis in rats. Life Sciences. 2004;74(7):897–907. doi: 10.1016/j.lfs.2003.08.004. [DOI] [PubMed] [Google Scholar]
- 25.Yang J, Liu X, Bhalla K, et al. Prevention of apoptosis by Bcl-2: release of cytochrome c from mitochondria blocked. Science. 1997;275(5303):1129–1132. doi: 10.1126/science.275.5303.1129. [DOI] [PubMed] [Google Scholar]
- 26.Dumont P, Burton M, Chen QM, et al. Induction of replicative senescence biomarkers by sublethal oxidative stresses in normal human fibroblast. Free Radical Biology and Medicine. 2000;28(3):361–373. doi: 10.1016/s0891-5849(99)00249-x. [DOI] [PubMed] [Google Scholar]
- 27.Dimri GP, Lee X, Basile G, et al. A biomarker that identifies senescent human cells in culture and in aging skin in vivo. Proceeding of the National Academy of Sciences of the United States of America. 1995;92(20):9363–9367. doi: 10.1073/pnas.92.20.9363. [DOI] [PMC free article] [PubMed] [Google Scholar]
- 28.Vermes I, Haanen C, Steffens-Nakken H, Reutelingsperger C. A novel assay for apoptosis. Flow cytometric detection of phosphatidylserine expression on early apoptotic cells using fluorescein labelled Annexin V. Journal of Immunological Methods. 1995;184(1):39–51. doi: 10.1016/0022-1759(95)00072-i. [DOI] [PubMed] [Google Scholar]
- 29.Zainuddin A, Chua KH, Rahim NA, Makpol S. Effect of experimental treatment on GAPDH mRNA expression as a housekeeping gene in human diploid fibroblasts. BMC Molecular Biology. 2010;11:p. 59. doi: 10.1186/1471-2199-11-59. [DOI] [PMC free article] [PubMed] [Google Scholar]
- 30.Carthagena L, Bergamaschi A, Luna JM, et al. Human TRIM gene expression in response to interferons. PLoS ONE. 2009;4(3):1–13. doi: 10.1371/journal.pone.0004894.e4894 [DOI] [PMC free article] [PubMed] [Google Scholar]


