

Abstract
The most common causes of urinary tract infections (UTIs) are Gram-negative pathogens such as Escherichia coli; however, Gram-positive organisms, including Streptococcus agalactiae, or group B streptococcus (GBS), also cause UTI. In GBS infection, UTI progresses to cystitis once the bacteria colonize the bladder, but the host responses triggered in the bladder immediately following infection are largely unknown. Here, we used genome-wide expression profiling to map the bladder transcriptome of GBS UTI in mice infected transurethrally with uropathogenic GBS that was cultured from a 35-year-old women with cystitis. RNA from bladders was applied to Affymetrix Gene-1.0ST microarrays; quantitative reverse transcriptase PCR (qRT-PCR) was used to analyze selected gene responses identified in array data sets. A surprisingly small significant-gene list of 172 genes was identified at 24 h; this compared to 2,507 genes identified in a side-by-side comparison with uropathogenic E. coli (UPEC). No genes exhibited significantly altered expression at 2 h in GBS-infected mice according to arrays despite high bladder bacterial loads at this early time point. The absence of a marked early host response to GBS juxtaposed with broad-based bladder responses activated by UPEC at 2 h. Bioinformatics analyses, including integrative system-level network mapping, revealed multiple activated biological pathways in the GBS bladder transcriptome that regulate leukocyte activation, inflammation, apoptosis, and cytokine-chemokine biosynthesis. These findings define a novel, minimalistic type of bladder host response triggered by GBS UTI, which comprises collective antimicrobial pathways that differ dramatically from those activated by UPEC. Overall, this study emphasizes the unique nature of bladder immune activation mechanisms triggered by distinct uropathogens.
INTRODUCTION
Urinary tract infections (UTIs) are among the most common infectious diseases of humans, with up to 40% of healthy adult women experiencing at least one UTI episode in their lifetime (24). Gram-negative bacteria, most notably, uropathogenic Escherichia coli (UPEC), are the leading cause of UTIs. These organisms express a range of virulence factors that provoke inflammation in the bladder as part of the early steps of UTI pathogenesis (34, 47, 69, 91). Rapid host inflammatory cascades are initiated in the bladder following UPEC infection, and these encompass interleukins (ILs) (8, 51, 52, 68), tumor necrosis factor (TNF), nitric oxide (16), and CXC chemokine receptor 2 (50), among other host factors (7, 65–67). Notably, UPEC may also suppress innate immune activation as a virulence strategy (7, 41, 75), and roles for immune suppressive and regulatory elements, including Th17 cells and IL-10, were recently shown in the bladder response leading to UPEC UTI pathogenesis (13, 70).
Gram-positive pathogens are less frequently associated with UTIs than organisms such as E. coli but are nonetheless common causes of UTI (63). Streptococcus agalactiae, also known as group B streptococcus (GBS), has emerged in the past 10 years as an important Gram-positive uropathogen. GBS is generally associated with maternal cervicovaginal colonization and disease in newborns and older persons with chronic medical illness (3, 15); however, GBS also causes acute and subacute UTI. GBS UTIs include asymptomatic bacteriuria (ABU), cystitis, pyelonephritis, and urosepsis, which, clinically, are indistinguishable from UTIs caused by other uropathogens (46). Urinary GBS is cultured from 1% to 2% of all cases of clinically suspected UTI (84), and GBS UTI complicates up to 7% of pregnancies and may account for up to 10% of pyelonephritis during pregnancy (46, 54). GBS UTI may also contribute to chorioamnionitis (1) and premature onset of labor (44) and has been associated with an increased risk of vertical transmission of the bacteria to infants (55, 90). While the incidence of GBS neonatal disease has decreased in the past decade, diseases such as UTI have increased in adults during this period (15).
In terms of the mechanisms of virulence and disease underlying GBS UTI, high rates of ABU among elderly adults (15, 19, 46) prompted a recent survey of the GBS serotypes that cause UTI, since distinct serotypes of GBS, most notably types III, Ia, and V, are associated with invasive disease in neonates and adults (84). In that study, a wide spectrum of serotypes were shown to cause UTI, with a disproportionately high distribution of serotype III isolates associated with acute disease. The pathogenesis of GBS UTI, however, and the immune responses that are initiated in the bladder during infection are largely unknown. GBS UTI triggers high levels of IL-1α in the bladder (83) and also upregulates macrophage inflammatory protein-1α (MIP-1α), MIP-1β, IL-9, and IL-10 (35). These findings suggest that, despite GBS UTI being clinically indistinguishable from UTI caused by other pathogens, divergent mechanisms of pathogenesis are associated with cystitis caused by GBS.
The lack of knowledge on the pathogenesis of acute GBS UTI prompted us to map the bladder transcriptome of GBS cystitis in mice to define the host pathogen interactions that occur immediately after infection. Comparing the bladder defense pathways initiated by GBS with those triggered by UPEC on a genome-wide scale revealed a unique bladder response triggered by GBS which is both more limited in scope and slower to develop than that seen with the prototypic Gram-negative uropathogen. This report provides new insight into defense strategies in the host bladder and uncovers a surprisingly minimal local transcriptional program in acute GBS UTI that develops in a focused, pathogen-specific manner.(This study was presented in part at the American Society for Microbiology Annual General Meeting, 21 to 24 May 2011, New Orleans, LA [76a]).
MATERIALS AND METHODS
Bacteria.
The uropathogenic GBS used in this study was cultured from clean-catch voided urine of a 35-year-old nondiabetic woman with no identified risk factors who presented to the University of Alabama at Birmingham (UAB) Hospital with symptoms that were consistent with uncomplicated cystitis, including dysuria, single-organism bacteriuria (> 100,000 CFU/ml), and leukocyte esterase and pyuria (≥10 white blood cells [WBC]/μl; nonspun), noted on urinalysis. GBS was grown at 37°C on Todd-Hewitt (TH) agar or in Todd-Hewitt broth (THB). Capsular serotyping, which identified this isolate as serotype III, was performed as described elsewhere (84). Use of the GBS cultured from the patient in this study was enacted according to the principles of the Helsinki Declaration with approval from the Institutional Review Board (IRB) of UAB (X070722011) and the Human Ethics Committee (HEC) of Griffith University (MSC/11/10/HREC). The UAB IRB and the Griffith University HEC waived the need for specific informed consent. In some comparative assays, we used the prototype UPEC CFT073 strain (ATCC 700928), which was originally cultured from a patient with pyelonephritis (43). This strain has been used in multiple pathogenesis studies in mice, as previously described (32, 38, 82, 92).
Analysis of GBS adherence to bladder uroepithelium.
Initially, we sought to determine whether the uropathogenic serotype III GBS isolate in this study was capable of binding to bladder cells in vitro. For this, we performed binding assays using T24 and 5637 human bladder uroepithelial cells (ATCC; HTB-4, HTB-9). Thirty thousand bladder cells were grown in poly-d-lysine-coated multiwell chamber slides (BD BioCoat) as previously described (83). Fluorescein isothiocyanate (FITC)-stained GBS (0.25 mg ml−1 in phosphate-buffered saline [PBS], 15 min, 37°C) were added (multiplicity of infection [MOI], 100 CFU cell−1), and after 2 h, monolayers were rinsed with PBS and fixed for 45 min with 3% paraformaldehyde and F-actin was labeled with phalloidin Alexa Fluor 594 (Molecular Probes) to colocalize GBS with host cell surfaces. DNA was counterstained with the nuclear dye Hoechst 33258. Cells were visualized with a Leica TCS SP2 confocal microscope. We also performed quantitative measurements of GBS binding to 5637 bladder uroepithelial cells by the use of antibiotic protection assays at 30 min (initial binding), 2 h (initial binding and invasion), and 24 h (intracellular survival), as described elsewhere (80). Briefly, 5 × 10⁴ to 8 × 10⁴ cells were seeded into wells of a 24-well tissue culture-treated plate (Nunc), grown for 24 h at 37°C in 5% CO2, and challenged at a multiplicity of infection of 10 bacteria per uroepithelial cell. After 30 min or 2 h, monolayers were rinsed with PBS (five times) and either the monolayers were processed for colony counts to determine numbers of adherent GBS or fresh medium with 100 U/ml penicillin, streptomycin, and gentamicin was added for subsequent processing at 24 h to measure intracellular GBS (78, 81). For some assays, supernatants from quadruplicate cultures were collected at 30 min, 2 h, and 24 h for analysis using an 8-target multiplex protein assay (Bio-Rad Laboratories, Australia) to assess the role of the uroepithelial cells in host responses to GBS.
Murine model of GBS cystitis.
Female C57BL/6 mice (8 to 10 weeks of age) were purchased from the Animal Resources Center (Australia) and Jackson Laboratories (United States). Urine was collected 24 h prior to challenge and examined microscopically and by culture to exclude mice with a preexisting condition as described elsewhere (85). Mice were anesthetized by isoflurane, and the periurethral area was sterilized with 10% povidone–iodine. Mice were catheterized using a sterile catheter, and 40 μl of PBS containing the challenge inoculum was instilled into the bladder in a transurethral manner. Control mice received PBS only. For comparisons with UPEC, another group of mice received an equivalent dose of strain CFT073 (based on equal cell numbers) that was grown at 37°C in lysogeny broth as previously described (13). Urine was collected at 22 to 24 h for colony counts, after which mice were euthanized and bladders removed and homogenized for counts or processed for microscopy to visualize GBS binding to the uroepithelial surface. Escalating-dose experiments were used to determine the 90% infectious dose (ID90) of the GBS isolate based on the methods of Reed and Muench (61). A challenge dose of approximately 3 × 10⁹ CFU was used in most assays unless otherwise indicated. In some experiments, bladders were collected from mice 30 min after challenge and were sectioned and washed in PBS (five washes of 5 min each wash, in 1 ml, with rotation) and then processed as normal to determine the numbers of initially adherent GBS in the bladder. Immunohistochemistry (IHC) analysis was also performed on duplicate bladders for histological assessment of local cellular infiltrates. This processing was based on standard IHC methods performed with rat anti-mouse Ly-6g (GR-1) (eBiosciences, San Diego, CA) and goat anti-rat IgG-FITC conjugate (Southern Biotech, Birmingham, AL). To visualize the distribution of FITC-stained GBS on the bladder uroepithelium, fluorescence dissection stereomicroscopy was performed using an Olympus SZX16 microscope fitted with a charge-coupled-device (CCD) DP72 camera. Additional bright-field and epifluorescence microscopy was performed using an AxioImager M2 microscope fitted with AxioCam MRm Rev. 3 and MRc 5 cameras (Carl Zeiss, Australia). All animal studies were performed with approval from and in accordance with the ethical standards of the Animal Ethics Committee of Griffith University (MSC/14/08/AEC) and the Institutional Animal Care and Use Committee of UAB (080708186).
Urine growth assays.
To determine whether GBS growth in urine could affect the colonization dynamics of the organisms in the bladder, we undertook in vitro urine growth assays. Human urine was collected from six healthy adult volunteers who had not had UTI or undergone any antibiotic treatment in the 2 weeks prior. Equal volumes of urine were pooled, filter sterilized (0.45-μm-pore-size filters), and stored at 4°C until use (within 48 h). Growth assays were also performed using mouse urine. Duplicate 200-μl aliquots were inoculated with approximately 103 CFU of GBS and grown in 96-well microtiter plates at 37°C with shaking (200 rpm), and the optical density at 600 nm (OD600) was recorded between 0 and 72 h. The growth experiments were repeated three times, and data from one representative experiment are shown. Ethics approval for use of human volunteer subjects was granted by Griffith University (Human Research Ethics Committee approval MSC/11/10/HREC).
Electron microscopy.
For scanning electron microscopy (SEM), whole bladders were collected from euthanized mice at 2 h after transurethral challenge and immediately fixed in 3% glutaraldehyde–0.1 M cacodylate buffer (pH 7.4) and stored at 4°C until processing. After being washed in fresh buffer, bladders were pinned onto wax sheets to prevent curling, postfixed in 1% osmium tetroxide, and then dehydrated through a graded ethanol series and critical point dried. Samples were mounted on SEM stubs and sputter coated with platinum for viewing using a JEOL 6300F SEM operated at 8 kV.
RNA isolation and microarrays.
Total RNA was isolated from GBS-infected, UPEC-infected, and PBS (control) bladders at 2 h and 24 h after challenge using group sizes of five mice per treatment group per time point. Total RNA was isolated using TRIzol reagent (Gibco) according to the manufacturer's instructions, treated with RNase-free DNase, and analyzed using a Bioanalyzer 2100 instrument (Agilent). RNA that passed Bioanalyzer analysis was quantified, and 100 ng was amplified into cDNA using SuperScript III reverse transcriptase (Invitrogen) with random hexamers tagged with a T7 promoter sequence. Microarray analyses were carried out in quintuplicate for each group and time point using one array per mouse (each array representing one single bladder). This approach provided a high degree of statistical power based on nonpooled samples to incorporate variances between mice within each treatment group. We regarded the use of five biological replicates (mice) in each treatment group and time point preferable to technical replicate experiments, which were not performed.
qRT-PCR.
To interrogate array data sets, quantitative reverse transcriptase PCR (qRT-PCR) was carried out for selected genes (listed in Table 1) that were identified as differentially regulated or unchanged following the treatment according to array analysis. Amplification of cDNA (500 ng RNA amplified) was performed using a GeneAmp 7700 system (Applied Biosystems). Target genes were amplified using thermal cycling conditions previously described (13, 83). Glyceraldehyde-3-phosphate dehydrogenase (GAPDH) and β-actin were used as reference genes. Primer sequences for each target gene are shown in Table S1 in the supplemental material. Separate reactions were carried out to ensure that the efficiency of amplification of the reference gene was approximately equal to that of the target gene. Relative expression levels of target genes were determined by normalizing reaction threshold cycle (CT) values to the housekeeper genes, GAPDH, and β-actin. ΔCT values were used in the formula 2.0 − (ΔCT) for calculation of the relative mRNA expression levels of target genes as previously described using PCR efficiencies and mean crossing-point deviations between samples and controls (56, 57).
Table 1.
qRT-PCR data for selected genes identified as significantly changed or unchanged in expression at 2 and 24 h postinfection in bladder during GBS cystitis according to microarrays
| Target genea | Time (h) | Mean CT ± SEM (n = 5) |
ΔCT | Fold change | Pb | |
|---|---|---|---|---|---|---|
| Control | Infected | |||||
| CXCL10 | 2 | 34.111 ± 1.29 | 33.351 ± 0.53 | 0.75 | 1.411 | 0.110 |
| 24 | 35.208 ± 3.14 | 28.019 ± 6.82 | 7.189 | 30.75 | 0.001 | |
| iNOS | 2 | 36.73 ± 1.25 | 36.75 ± 2.02 | −0.02 | −1.082 | 0.817 |
| 24 | 35.73 ± 0.44 | 32.26 ± 2.81 | 3.47 | 11.92 | 0.001 | |
| CCL5 | 2 | 28.37 ± 1.40 | 28.425 ± 1.02 | −0.055 | 1.4 | 0.153 |
| 24 | 29.192 ± 1.15 | 28.015 ± 1.21 | 1.177 | 2.525 | 0.003 | |
| CXCL5 | 2 | 35.34 ± 0.87 | 35.21 ± 2.45 | 0.13 | 1.13 | 0.717 |
| 24 | 35.64 ± 0.56 | 33.73 ± 1.80 | 1.91 | 4.96 | 0.001 | |
| CXCL9 | 2 | 35.573 ± 0.81 | 34.213 ± 3.57 | 1.36 | 1.777 | 0.075 |
| 24 | 36.753 ± 1.32 | 31.950 ± 2.78 | 4.803 | 6.464 | 0.008 | |
| IL-1α | 2 | 31.717 ± 1.05 | 30.737 ± 3.19 | 0.98 | 2.788 | 0.001 |
| 24 | 32.655 ± 0.95 | 29.012 ± 2.05 | 3.643 | 22.11 | 0.001 | |
| IL-1β | 2 | 27.766 ± 1.11 | 25.343 ± 1.87 | 2.423 | 7.58 | 0.001 |
| 24 | 29.455 ± 2.35 | 24.013 ± 3.15 | 5.442 | 21.096 | 0.001 | |
| IL-6 | 2 | 33.47 ± 5.70 | 30.77 ± 10.9 | 2.5 | 7.913 | 0.001 |
| 24 | 37.03 ± 1.34 | 33.07 ± 6.22 | 3.14 | 17.94 | 0.001 | |
| EMR1 | 2 | 28.06 ± 0.12 | 28.40 ± 0.38 | 0.4 | 1.072 | 0.824 |
| 24 | 34.48 ± 2.68 | 33.14 ± 1.02 | 1.34 | 2.521 | 0.124 | |
| CSF1R | 2 | 22.16 ± 0.06 | 22.60 ± 0.02 | 0.44 | 1.51 | 0.396 |
| 24 | 28.02 ± 1.3 | 27.22 ± 0.69 | 0.8 | 1.73 | 0.199 | |
| INFGr1 | 2 | 33.097 ± 0.33 | 33.110 ± 0.62 | −0.013 | 1.103 | 0.539 |
| 24 | 35.340 ± 3.68 | 33.477 ± 0.62 | 1.863 | 1.12 | 0.480 | |
| Caspase-3 | 2 | 30.91 ± 0.63 | 31.25 ± 1.17 | −0.34 | −1.089 | 0.724 |
| 24 | 30.92 ± 1.27 | 30.64 ± 1.11 | 0.28 | 1.293 | 0.3 | |
| β-Actin | 2 | 19.938 ± 0.22 | 20.256 ± 0.13 | −0.318 | 0.815 | 0.113 |
| 24 | 20.26 ± 0.31 | 20.36 ± 0.15 | −0.1 | 0.937 | 0.127 | |
| GAPDH | 2 | 20.162 ± 0.3 | 20.662 ± 0.43 | −0.5 | −1.18 | 0.5 |
| 24 | 20.531 ± 0.23 | 20.352 ± 0.25 | 0.179 | 1.132 | 0.658 | |
Primer sequences are listed in Table S1 in the supplemental material.
P values compare GBS-infected group with control (PBS) group within each time point per Materials and Methods.
Statistical analysis and bioinformatics.
For data preprocessing, raw array data were normalized using quantile normalization and summarized using RMA in the affy package in Bioconductor (http://www.bioconductor.org), as described elsewhere (13). Differentially expressed genes were identified by analyzing data using the MAANOVA package (http://www.bioconductor.org/packages/bioc/1.8/html/maanova.html). To identify significant changes in expression induced by GBS, we used a shrinkage-based t test together with permutation (9, 10). A false discovery rate (FDR) of 0.1 was used to generate the significant-gene list. Gene class testing was performed using the SAFE package in Bioconductor by applying thresholds to select significant pathways (4). Both the Kyoto Encyclopedia of Genes and Genomes (KEGG) (29, 48) and Gene Ontology (GO) (2) databases were used to generate a signaling network from the gene class analysis. An FDR of 0.1 was used as a cutoff for both tools. GoMiner was used to analyze functional groups of genes activated in biological pathways and to generate Venn diagrams of functionally related responses. InnateDB (http://innatedb.ca) was used to provide an integrative system-level analysis of functional groups activated within biological pathways. Overrepresentation analysis (ORA) of pathways in innateDB was performed using significant-gene lists, the hypergeometric algorithm, and the Benjamini Hochberg correction method with the pathway ORA P value significance set at 0.05.
Microarray data accession number.
The raw data sets for array comparisons have been deposited in the Gene Expression Omnibus database under accession no. GSE27575 (http://www.ncbi.nlm.nih.gov/geo/).
RESULTS
Serotype III GBS colonizes the bladder uroepithelium in vitro and in vivo.
Initial binding assays using human T24 and 5637 bladder uroepithelial cells showed adherence of the serotype III GBS isolate to these cells within 30 min after infection (Fig. 1A and B; T24 cells shown). These results are consistent with results previously reported for serotype II GBS (83). Changes in cellular architecture were noted in some cells to which GBS had bound (compare Fig. 1A and C). Similar results were observed in 5637 bladder cells (not shown). In the murine model, the serotype III GBS isolate was also observed bound directly to the surface of the bladder uroepithelium as early as 2 h following transurethral infection. Colonization was observed as focal areas of adhesion across the bladder surface, which was visualized using fluorescence dissection stereomicroscopy to detect FITC-GBS (Fig. 1D and E). Resected areas of bladder processed and imaged using high-resolution SEM confirmed binding of serotype III GBS to the uroepithelium in vivo at 2 h following challenge (Fig. 1F and G). Histological assessment of control (Fig. 1H to J) and GBS-infected (Fig. 1K to M) bladders using hematoxylin and eosin (H&E) and IHC illustrated a local cellular infiltrate at 24 h comprised of polymorphonuclear leukocytes (PMNs), as shown by IHC (compare controls [I and J] with GBS-infected panels [L and M]).
Fig 1.

Attachment of uropathogenic serotype III GBS to human bladder uroepithelial cells in vitro (A, 30 min; B, 2 h; C, control) and colonization of the surface of bladder uroepithelium in murine GBS UTI as analyzed by fluorescence microscopy of whole tissue, illustrating focal areas of adhered GBS (D and E) alongside images of pockets of bound GBS between folds of uroepithelium (F and G) as analyzed with high-resolution SEM. Histological assessment of control (H to J) and GBS-infected (K to M) bladders illustrates a PMN infiltrate at 24 h (arrowheads), as demonstrated in serial sections stained using either H&E (H and K) or PMN-specific Gr-1 antibody and IHC techniques (I and J, L and M). Bars, 50 μM (small bars) and 180 μM (large bars).
Dynamics of early GBS uroepithelium binding and dose response.
Initial quantitation of early binding of GBS to 5637 bladder uroepithelial cells after infection in vitro showed that only 0.15% of the total bacteria used for challenge bound to bladder cells after 30 min (Fig. 2). This amount of adherence was higher than the UPEC CFT073 adherence at 30 min; however, this difference was not statistically significant. A notable difference after 2 h in which total GBS adherence remained at only 0.15% (adherence/invasion) but UPEC adherence had increased to 2.5%, which represented a statistically significant difference, was observed (Fig. 2). Intracellular survival data at 24 h after antibiotic protection showed that GBS was recovered from the intracellular compartment of host cells in numbers comparable to that of UPEC (Fig. 2). Thus, GBS binds to bladder uroepithelial cells rapidly (within 30 min) and efficiently compared to UPEC in vitro, is able to invade these cells, and is able to survive under intracellular conditions for at least 24 h.
Fig 2.
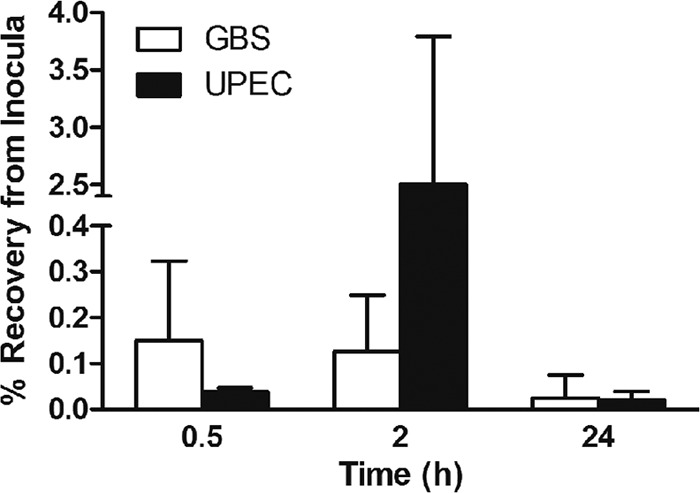
Quantitation of adherence and intracellular survival of serotype III GBS in human bladder uroepithelial cells in vitro. The percentage of bacteria bound to 5637 cells after 30 min (representing initial adherence) is shown for GBS, alongside the percentage bound and invaded at 2 h and the percentage of intracellular bacteria recovered from bladder cells after 24 h after antibiotic protection. The equivalent data for UPEC CFT073 are shown for comparison.
In escalating challenge dose assays in mice, we calculated the ID50 and ID90 values of the GBS isolate in this study to be 1.2 and 2.9 × 10⁹ CFU, respectively. We based these calculations on the number of mice exhibiting positive bladder cultures at 24 h postinfection (Fig. 3A). We then quantitated early GBS binding to the bladders in mice that received an ID90 challenge dose of 3 × 10⁹ CFU, which was used in subsequent assays. In assays based on extensive washing of bladders immediately after infection, we observed efficient binding of GBS to the surface of the bladder uroepithelium in vivo after 30 min (Fig. 3B). The majority of GBS present in the bladders of mice at 30 min represented bound bacteria, since there was no difference in total bladder load between tissues that were unwashed (U/W) and those that were extensively washed (W). The differences between U/W and W bladders from mice infected with UPEC CFT073, on the other hand, were significant (P = 0.015; Fig. 3B). These data demonstrate at least equally efficient binding of GBS to the bladder uroepithelium surface compared to UPEC. The average bladder GBS burden after 2 h was 106 CFU/0.1 g tissue, which decreased 100-fold after 24 h (Fig. 3C). These decreases in GBS load between 2 h, 24 h, and 5 days were statistically significant (P < 0.05), demonstrating a decline in bacterial burden over time to a point at 5 days when most mice were bladder culture negative. A few mice exhibited positive kidney cultures at 2 h, 24 h, and 5 days (Fig. 3D); however, there were no significant differences in the mean recovery of GBS from kidneys between any of these time points. High numbers of GBS were detected in the urine at 2 h that also subsequently declined by 24 h but then exhibited equivalent mean bacteriuria levels between 24 h and 5 days (Fig. 3E).
Fig 3.

Infectious dose and temporal colonization dynamics of uropathogenic serotype III GBS in a murine model of UTI. Data for escalating dose assays (A) and measures of early bladder adherence of GBS in mice challenged with the ID90 after 30 min (B) are shown alongside persistence data for GBS in the bladder (C) and kidneys (D) and bacteriuria levels (E). Broken lines indicate the detection limit for each sample type based on the volume plated. Initial binding of GBS to bladder uroepithelium as represented in panel B was determined by comparing unwashed (U/W) bladders (bound GBS plus those present in bladder lumen) (n = 6) with washed (W) bladders (representing only adherent bacteria after 30 min), and the results are shown alongside data for UPEC for comparison. Temporal colonization data (C, D, and E) represent pooled data from mice challenged with the ID90 in two separate experiments with at least 9 mice per group per experiment. Statistical comparisons between groups are based on Mann-Whitney U tests with P values set for significance at 0.05.
Some uropathogens, including E. coli, are able to utilize urine for growth (33, 64, 89), and we next sought to determine whether GBS might replicate in urine in the bladder to gain insight into whether this might affect the dynamics of uroepithelium colonization. In vitro growth assays performed using GBS and fresh human urine demonstrated virtually no bacterial replication over a time course of 72 h (Fig. 4A). Similar data were observed for growth curves determined using fresh urine from C57BL/6 mice (not shown). In contrast, we observed rapid growth for two control E. coli strains that were used in these assays, UPEC CFT073 and E. coli 83972 (Fig. 4A). To determine whether a general growth defect might be present in this GBS isolate, we also performed parallel growth curve assays using rich THB. However, there was no general growth defect in the uropathogenic serotype III GBS isolate in THB (Fig. 4B). Together, these data show that GBS is unable to utilize urine for growth; hence, GBS growth in urine is unlikely to influence the dynamics of uroepithelium colonization during infection in mice.
Fig 4.
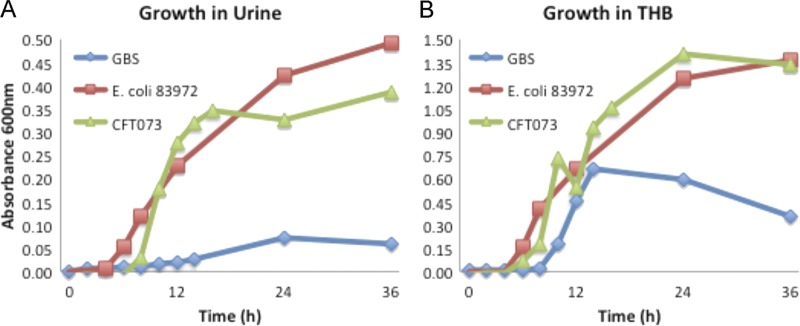
In vitro growth curve assays of uropathogenic serotype III GBS in pooled human urine (A) and in THB (B) as measured at OD600. The equivalent growth curve data derived from control E. coli strains UPEC CFT073 and 83972 in parallel assays are shown for comparison.
GBS bladder transcriptome.
Initial genome-wide expression profiling of bladder failed to identify any genes with significantly altered expression immediately after GBS infection at 2 h. This finding was unexpected given the high GBS bladder burdens that were detected at this early time point (Fig. 3C) and the overall lower variance in total bladder-urine bacterial loads between mice within the 2-h group compared to later time points. In contrast to the array data sets at 2 h, comparison of infected and control mice at 24 h revealed a diverse set of 172 genes with significant changes in expression (FDR ≤ 0.1). Heat maps for arrays illustrating overall gene signal intensities in the samples at 24 h are shown in Fig. 5A alongside a volcano plot illustrating the overall breadth of the GBS bladder transcriptome at 24 h in Fig. 5B. The complete significant-gene list at 24 h is presented in Table 2. A summary of the gene expression changes plotted according to FDR for the top 75 genes (FDR ≤ 0.05) is shown in Fig. S1 in the supplemental material alongside a Venn diagram derived using GoMiner for responses related to defense against bacteria, cytokines, and inflammation. The raw data sets for array comparisons have been deposited on the Gene Expression Omnibus website (see Materials and Methods for accession number).
Fig 5.
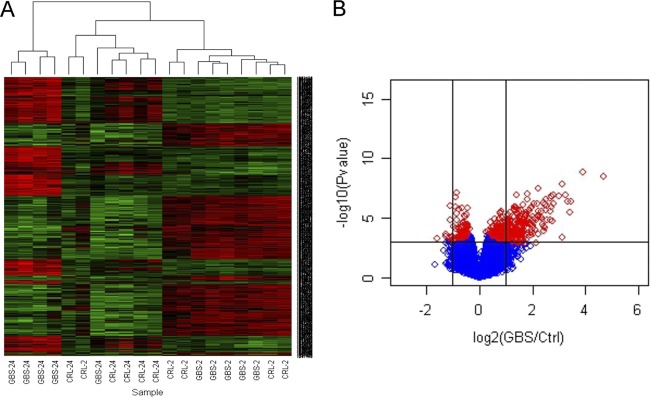
Global gene expression in bladder during GBS cystitis in mice comprises a significant list of 172 genes (FDR < 0.1) derived from comparisons of infected and control (Ctrl) mice at 24 h (n = 5). Gene signal intensities are illustrated in the heat maps for individual arrays (A). The complete significant-gene list is provided in Table 2. The summary response is shown using a volcano scatterplot (B) where significant genes are displayed as shrinkage t test results [−log10(P value)] (y axis) versus expression ratio [log2(mean GBS infected/control)] (x axis), with vertical lines representing a 2-fold difference; red diamonds represent FDR < 0.1.
Table 2.
Global gene expression in bladder during GBS cystitis in mice comprises a significant-gene list of 172 genes (FDR < 0.1) derived from pairwise comparisons of infected mice with control mice (n = 5) at 24 h postinfection
| Gene assignment | Target gene product | Fold change | FDRa |
|---|---|---|---|
| NM_021274 | Cxcl10 | 25.4 | 0.006 |
| NM_008324 | Indo | 14.87 | 0.006 |
| NM_011579 | Tgtp | 10.94 | 0.019 |
| NM_021792 | Iigp1 | 10.55 | 0.015 |
| NM_008361 | Il1b | 10.12 | 0.011 |
| NM_011410 | Slfn4 | 9.42 | 0.015 |
| BC034256 | Tgtp | 8.75 | 0.011 |
| NM_011260 | Reg3g | 8.7 | 0.075 |
| XM_905096 | Irgb10 | 7.92 | 0.015 |
| L38281 | Irg1 | 7.03 | 0.011 |
| NM_008620 | Gbp4 | 6.89 | 0.022 |
| NM_008331 | Ifit1 | 6.81 | 0.031 |
| NM_008326 | Irgm | 6.54 | 0.015 |
| BC112328 | LOC626578 | 6.51 | 0.022 |
| NM_011315 | Saa3 | 6.44 | 0.046 |
| NM_009114 | S100a9 | 6.38 | 0.035 |
| NM_018738 | Igtp | 6.35 | 0.018 |
| NM_144559 | Fcgr4 | 5.94 | 0.053 |
| NM_011407 | Slfn1 | 5.83 | 0.026 |
| NM_010999 | Olfr56 | 5.75 | 0.025 |
| NM_020498 | Ly6i | 5.71 | 0.035 |
| NM_153564 | Gbp5 | 5.48 | 0.022 |
| NM_177162 | 9930032O22Rik | 5.43 | 0.047 |
| NM_010260 | Gbp2 | 5.42 | 0.022 |
| NM_029499 | Ms4a4c | 5.41 | 0.079 |
| ENSMUST031549 | EG240327 | 5.3 | 0.051 |
| NM_021394 | Zbp1 | 5.04 | 0.051 |
| NM_011346 | Sell | 4.96 | 0.044 |
| NM_010927 | Nos2 | 4.74 | 0.015 |
| NM_153511 | Il1f9 | 4.7 | 0.033 |
| NM_133871 | Ifi44 | 4.65 | 0.044 |
| NM_009099 | Trim30 | 4.62 | 0.035 |
| NM_009283 | Stat1 | 4.5 | 0.03 |
| NM_172777 | BC057170 | 4.45 | 0.046 |
| NM_010501 | Ifit3 | 4.33 | 0.035 |
| NM_009141 | Cxcl5 | 4.27 | 0.071 |
| NM_023137 | Ubd | 4.22 | 0.035 |
| NM_011472 | Sprr2f | 4.09 | 0.057 |
| NM_021384 | Rsad2 | 4.07 | 0.044 |
| NM_018734 | Gbp3 | 4.05 | 0.048 |
| NM_145545 | Gbp6 | 4.03 | 0.047 |
| NM_016850 | Irf7 | 4.02 | 0.056 |
| NM_010819 | Clec4d | 4 | 0.077 |
| NM_008599 | Cxcl9 | 3.99 | 0.075 |
| NM_020557 | Tyki | 3.96 | 0.025 |
| NM_008230 | Hdc | 3.91 | 0.068 |
| NM_008462 | Klra2 | 3.87 | 0.068 |
| NM_013532 | Lilrb4 | 3.87 | 0.083 |
| NM_008329 | Ifi204 | 3.83 | 0.068 |
| NM_011854 | Oasl2 | 3.78 | 0.035 |
| NM_010554 | Il1a | 3.72 | 0.035 |
| NM_023386 | Rtp4 | 3.7 | 0.041 |
| NM_145226 | Oas3 | 3.57 | 0.022 |
| AB112025 | Sirpb1 | 3.52 | 0.088 |
| NM_021893 | Cd274 | 3.49 | 0.015 |
| NM_028595 | Ms4a6c | 3.43 | 0.078 |
| XR_033405 | LOC546714 | 3.43 | 0.094 |
| NM_025777 | Duoxa2 | 3.41 | 0.046 |
| NM_023044 | Slc15a3 | 3.38 | 0.047 |
| NM_008390 | Irf1 | 3.37 | 0.047 |
| NM_013563 | Il2rg | 3.35 | 0.048 |
| NM_008491 | Lcn2 | 3.34 | 0.079 |
| NM_031168 | Il6 | 3.31 | 0.094 |
| NM_008332 | Ifit2 | 3.3 | 0.051 |
| EF660528 | AW112010 | 3.27 | 0.046 |
| NM_029509 | 5830443L24Rik | 3.26 | 0.068 |
| NM_009251 | Serpina3g | 3.19 | 0.069 |
| NM_011157 | Srgn | 3.15 | 0.053 |
| NM_001040005 | Rnf213 | 3.15 | 0.077 |
| NM_145227 | Oas2 | 3.13 | 0.058 |
| NM_019963 | Stat2 | 3.11 | 0.035 |
| NM_001039530 | Parp14 | 3.07 | 0.088 |
| NM_139198 | Plac8 | 3.06 | 0.094 |
| NM_011347 | Selp | 3.05 | 0.075 |
| NM_133990 | Il13ra1 | 3.04 | 0.088 |
| NM_183201 | Slfn5 | 3.03 | 0.091 |
| NR_003508 | Mx2 | 3.01 | 0.081 |
| AK220210 | Nlrc5 | 2.98 | 0.035 |
| NM_018851 | Samhd1 | 2.96 | 0.057 |
| NM_011408 | Slfn2 | 2.93 | 0.069 |
| NM_013683 | Tap1 | 2.87 | 0.075 |
| NM_011909 | Usp18 | 2.86 | 0.046 |
| NM_011331 | Ccl12 | 2.86 | 0.078 |
| ENSMUST051264 | Cd300lf | 2.85 | 0.082 |
| NM_008848 | Pira6 | 2.84 | 0.078 |
| NM_030253 | Parp9 | 2.83 | 0.058 |
| NM_001013371 | Dtx3l | 2.8 | 0.046 |
| NM_027835 | Ifih1 | 2.8 | 0.09 |
| NM_001038604 | Clec5a | 2.78 | 0.083 |
| NM_001033308 | BC013712 | 2.74 | 0.066 |
| NM_010259 | Gbp1 | 2.67 | 0.029 |
| NM_011852 | Oas1g | 2.65 | 0.079 |
| NM_010553 | Il18rap | 2.59 | 0.066 |
| NM_029084 | Slamf8 | 2.58 | 0.044 |
| NM_172893 | Parp12 | 2.51 | 0.053 |
| NM_181754 | Gpr141 | 2.5 | 0.049 |
| NM_013673 | Sp100 | 2.48 | 0.09 |
| ENSMUST047498 | AA467197 | 2.47 | 0.043 |
| NM_145209 | Oasl1 | 2.38 | 0.098 |
| NM_008152 | Gpr65 | 2.32 | 0.083 |
| NM_008348 | Il10ra | 2.29 | 0.078 |
| NM_010747 | Lyn | 2.26 | 0.046 |
| NM_172689 | Ddx58 | 2.22 | 0.061 |
| NM_001024134 | Trim15 | 2.22 | 0.069 |
| NM_145133 | T2bp | 2.19 | 0.075 |
| NM_009890 | Ch25h | 2.19 | 0.078 |
| NM_019401 | Nmi | 2.17 | 0.078 |
| BC117807 | Ibrdc3 | 2.1 | 0.035 |
| NM_013653 | Ccl5 | 2.1 | 0.044 |
| NM_026913 | Mitd1 | 2.1 | 0.056 |
| NM_001013817 | Sp140 | 2.02 | 0.07 |
| NM_009277 | Trim21 | 1.99 | 0.078 |
| NM_008217 | Has3 | 1.88 | 0.083 |
| NM_030701 | Gpr109a | 1.84 | 0.089 |
| AK034303 | 9330175E14Rik | 1.82 | 0.044 |
| NM_145391 | Tapbpl | 1.82 | 0.078 |
| NM_031167 | Il1rn | 1.82 | 0.082 |
| NM_207648 | H2-Q6 | 1.8 | 0.056 |
| NM_030720 | Gpr84 | 1.73 | 0.092 |
| NM_001001495 | Tnip3 | 1.73 | 0.099 |
| NM_011530 | Tap2 | 1.71 | 0.075 |
| NM_183162 | BC006779 | 1.71 | 0.078 |
| NM_145373 | Sectm1a | 1.66 | 0.058 |
| NM_175397 | Sp110 | 1.59 | 0.099 |
| NM_001033339 | Mmp25 | 1.5 | 0.068 |
| NM_024495 | Car13 | 1.43 | 0.098 |
| NM_010380 | H2-D1 | 1.35 | 0.083 |
| NM_198013 | Cuedc1 | 0.79 | 0.1 |
| NM_001085492 | Rere | 0.78 | 0.083 |
| NM_181039 | Lphn1 | 0.77 | 0.058 |
| NM_173186 | Tbc1d24 | 0.76 | 0.082 |
| NM_172619 | Adamts10 | 0.74 | 0.04 |
| NM_007405 | Adcy6 | 0.74 | 0.046 |
| NM_173788 | Npr2 | 0.74 | 0.046 |
| NM_198300 | Cpeb3 | 0.74 | 0.079 |
| NM_032418 | Dmpk | 0.74 | 0.091 |
| NM_177030 | Dock6 | 0.73 | 0.035 |
| NM_029967 | Adamtsl1 | 0.72 | 0.025 |
| NM_011242 | Rasgrp2 | 0.72 | 0.083 |
| NM_053097 | Cml3 | 0.72 | 0.083 |
| NM_011066 | Per2 | 0.71 | 0.071 |
| XM_990451 | AU042671 | 0.71 | 0.088 |
| NM_173749 | E430002G05Rik | 0.71 | 0.092 |
| NM_134437 | Il17rd | 0.7 | 0.066 |
| NM_001042779 | Sema3b | 0.7 | 0.088 |
| NM_011218 | Ptprs | 0.69 | 0.051 |
| BC057903 | Col6a3 | 0.69 | 0.064 |
| NM_022814 | Svep1 | 0.69 | 0.081 |
| NM_007496 | Zfhx3 | 0.68 | 0.035 |
| NM_175473 | Fras1 | 0.67 | 0.1 |
| NM_177030 | Dock6 | 0.66 | 0.058 |
| NM_008483 | Lamb2 | 0.66 | 0.083 |
| NM_053185 | Col4a6 | 0.65 | 0.015 |
| NM_031176 | Tnxb | 0.65 | 0.078 |
| NM_027890 | Susd2 | 0.64 | 0.05 |
| NM_001033323 | Igsf9b | 0.64 | 0.071 |
| NM_007463 | Speg | 0.64 | 0.078 |
| NM_001012765 | Adcy5 | 0.63 | 0.056 |
| NM_001033476 | Ahnak2 | 0.62 | 0.029 |
| NM_013630 | Pkd1 | 0.62 | 0.046 |
| NM_012040 | Pnck | 0.62 | 0.088 |
| NM_010570 | Irs1 | 0.6 | 0.027 |
| NM_013568 | Kcna6 | 0.6 | 0.09 |
| NM_175750 | Plxna4 | 0.59 | 0.015 |
| NM_139001 | Cspg4 | 0.58 | 0.09 |
| NM_008742 | Ntf3 | 0.57 | 0.071 |
| XR_034431 | LOC100048255 | 0.56 | 0.058 |
| XR_034431 | LOC100048255 | 0.55 | 0.035 |
| NM_052835 | Rpl10 | 0.55 | 0.084 |
| NM_009154 | Sema5a | 0.54 | 0.014 |
| NM_009204 | Slc2a4 | 0.54 | 0.035 |
| NM_176922 | Itga11 | 0.54 | 0.083 |
FDR, false discovery rate.
Overall, the GBS bladder transcriptome comprised genes encoding multiple mediators of defense, including those known to be responsive to GBS in other models of infection, including IL-1α (3.7-fold change, FDR = 0.035), IL-1β (10.1, 0.011), IL-6 (3.3, 0.093), Stat1 (4.5, 0.03), Stat2 (3.11, 0.04), Ccl5 (2.10, 0.044), and multiple poly(ADP-ribose) polymerases (PARPs) (5, 20, 23, 31, 49, 58, 77, 81, 83). Other transcripts that encode ILs and their receptors or receptor antagonists, including IL-1 family member 9 (4.7, 0.033), IL-1r antagonist (1.8, 0.082), IL-2rg (3.4, 0.048), IL-13ra1 (3.0, 0.088), and IL-17rd (0.7, 0.066), were also identified in the response. Chemokine and chemokine receptor gene expression, including that of Cxcl10 (25.4, 0.006), Cxcl5 (4.27, 0.071), Cxcl9 (3.99, 0.075), and Ccl12 (2.9, 0.078), was also prominent. Other responses of note were related to apoptosis regulators and effectors, including PARP family members 9 (2.8, 0.058), 12 (2.5, 0.053), and 14 (3.1, 0.088), CARD 5 (3.0, 0.035), and neutrophil apoptosis (3.3, 0.093), given the ability of GBS to induce apoptosis and PARP cleavage (79). Unexpectedly, several key defense molecules associated with GBS in other (non-UTI) infection models such as inducible nitric oxide synthase (iNOS) (78) and TNF-α (27) were not detected as significantly altered in expression in the bladder transcriptome.
qRT-PCR.
qRT-PCR showed that expression levels of selected target genes were consistent with individual gene responses identified using arrays. For example, Cxcl10, which was the most strongly activated gene induced by GBS according to arrays at 24 h (25.40-fold increase [P = 0.006]; Table 2), was also highly expressed according to qRT-PCR (Table 1; 30.75-fold increase [P = 0.001]). Similarly, multiple other genes, including those that encode iNOS, CCL5, CXCL5, CXCL9, IL-6, IL-1α, and IL-1β, were upregulated according to both qRT-PCR and arrays. As expected, there were a number of genes that were tested by qRT-PCR that exhibited higher fold increases compared to arrays because PCR is more sensitive than the arrays (Table 1 and data not shown). All of these transcripts were detected at several cycles above background levels, which validates the detection of genes with low CT values (e.g., IL-6). The housekeeping genes β-actin and GAPDH also showed no significant changes according to qRT-PCR, which was consistent with findings in arrays. This was also consistent with findings determined for several other genes that showed no significant changes in expression according to arrays and qRT-PCR (e.g., genes for EMR1, CSFR1, INFGr1, and Caspase-3).
Bioinformatics analysis of biological pathways in the transcriptome.
Initial analysis of biological pathways within the GBS bladder transcriptome by gene class testing using the KEGG database identified no significant interactions with P values < 0.25 for comparisons between infected and control mice at 2 h. In contrast, there were 34 significantly enriched KEGG pathways at 24 h (Table 3). The most strongly represented pathways at 24 h were those related to host responses to bacterial infection; for example, pathways for metabolism (KEGG pathways 561, 562, and 630), ABC transport (2010), focal adhesion (4510), extracellular matrix receptor interactions (4512), Toll-like receptors (TLRs) (4620), NK cell-mediated cytotoxicity (4650), and B cell receptor signaling (4662), which were all significantly overrepresented. Others of interest were those for mitogen-activated protein kinase (MAPK) signaling (KEGG pathway 4010), apoptosis (4210), T cell receptor signaling (4660), antigen processing and presentation (4612), and cytokine-cytokine receptor interactions (4060).
Table 3.
Activation of diverse KEGG regulatory networks in bladder during GBS cystitis
| KEGG no. | Pathway | P |
|---|---|---|
| 00561 | Glycerolipid metabolism | 0.01 |
| 00562 | Inositol phosphate metabolism | 0.01 |
| 00630 | Glyoxylate and dicarboxylate metabolism | 0.01 |
| 02010 | ABC transporters | 0.01 |
| 04510 | Focal cell matrix adhesion | 0.01 |
| 04512 | Extracellular matrix-receptor interaction | 0.01 |
| 04620 | Toll-like receptor signaling | 0.01 |
| 04650 | Natural killer cell-mediated cytotoxicity | 0.01 |
| 04662 | B cell receptor signaling | 0.01 |
| 04810 | Regulation of actin cytoskeleton | 0.01 |
| 04920 | Adipocytokine signaling | 0.01 |
| 04010 | MAPK signaling | 0.014 |
| 04930 | Type II diabetes mellitus | 0.014 |
| 05060 | Unknown | 0.017 |
| 00620 | Pyruvate metabolism | 0.018 |
| 03320 | Peroxisome proliferator-activated receptors | 0.018 |
| 04210 | Apoptosis | 0.02 |
| 00970 | Aminoacyl-tRNA biosynthesis | 0.023 |
| 04670 | Leukocyte transendothelial migration | 0.023 |
| 05020 | Unknown | 0.023 |
| 03450 | Nonhomologous end joining | 0.028 |
| 00480 | Glutathione metabolism | 0.03 |
| 00220 | Urea cycle and metabolism of amino groups | 0.033 |
| 00980 | Metabolism of xenobiotics by cytochrome P450 | 0.033 |
| 00982 | Drug metabolism—cytochrome P450 | 0.033 |
| 05222 | Small cell lung cancer | 0.033 |
| 04060 | Cytokine-cytokine receptor interaction | 0.035 |
| 04742 | Taste transduction | 0.035 |
| 04612 | Antigen processing and presentation | 0.036 |
| 04630 | Jak-STAT signaling | 0.039 |
| 04660 | T cell receptor signaling | 0.04 |
| 04912 | Gonadotropin-releasing hormone signaling | 0.04 |
| 00790 | Folate biosynthesis | 0.042 |
| 04664 | Fc epsilon RI signaling | 0.048 |
Subsequent GO biological process analyses of the array data for GBS-infected mice at 2 h and 24 h, shown in Table S2 in the supplemental material, revealed larger numbers of overrepresented pathways compared to those derived using KEGG as described above: 40 and 278, at 2 h and 24 h (P < 0.05), respectively. Interestingly, several pathways identified at 2 h using GO indicated that GBS might suppress early host responses in the bladder following infection. These pathways related to downregulation of the defense response (pathway 0031348), downregulation of the response to stimulus (0048585), and downregulation of the inflammatory response (0050728) (see Table S2 in the supplemental material). Pathways related to immune activation and upregulation of antimicrobial defense were highlighted at 2 h but were more prominent at 24 h. These included pathways for T-lymphocyte-mediated immunity (0002456), nitric oxide synthesis (0006809), TNF-α production (0032640), and upregulation of the innate immune response (0045089). Concomitant activation of immune-suppressive pathways for adaptive responses (0002820) and cytokine synthesis (0042036) was also identified at 24 h, illustrating a balance of pro- and anti-inflammatory responses.
Integrated system-level analysis.
We next used the InnateDB database as a complementary bioinformatics tool to enable integrative system-level analyses of the array data. This identified 293 distinct biological pathways at 24 h, which included an additional 15 pathways compared to those that were identified using GO. Mining of the data within InnateDB by ORA identified 168 overrepresented pathways at 24 h (P < 0.05; see Table S2 in the supplemental material). The most significant of these with the highest number of activated genes were those for cytokine receptor interactions (pathway 604) and chemokine signaling (4351), shown in Fig. 6. Many of the interactors in the pathways that were identified exhibited a large number of interactions such as TRAF6 (525 interactors), although others, such as TNF (39 interactors) and TLR-9 (16 interactors), exhibited fewer interactors.
Fig 6.

Immune activation in the GBS UTI transcriptome comprises prominent cytokine-cytokine receptor signaling (innateDB pathway number 604) (A) in which 12 genes were highly active (red circles; expression and significance cutoffs, 2.0 and 0.1). The pathway is illustrated according to subcellular localization and includes the total of 255 genes annotated in the pathway. The bladder transcriptome also includes chemokine signaling (innateDB pathway 4351) (B), with activation of the pathway occurring via 8 genes (red circles; Cxcl10, Cxcl9, and Stat2 are shown twice) among a total of 175 genes in the pathway.
Common and GBS-unique elements of the bladder transcriptome.
Direct comparisons of gene expression responses in bladders of mice challenged with GBS and UPEC enabled us to ascertain the degree of response conservation in the bladder transcriptome. These comparisons used bladders from GBS-infected, UPEC-infected, and PBS control mice in a single experiment performed with the one control group to map global gene expression responses. An absence of significant changes in gene expression induced by GBS in the bladder at 2 h according to array analysis contrasted strikingly with data obtained from mice infected with UPEC for 2 h. These data, which were recently published (13), showed that mice develop a 2-h bladder transcriptome of UPEC UTI that comprises 1,564 transcripts with significant fold differences compared to controls. Microarray analysis at 24 h in the current study showed that, in contrast to the 172 significant changes in gene expression triggered by GBS (Table 2), UPEC induced 15-fold-more significant changes in gene expression at this time point. The 24-h bladder transcriptome of UPEC UTI in C57BL/6 mice revealed a significant-gene list of 2,507 genes (FDR ≤ 0.05), which is shown in Table S3 in the supplemental material. Raw array data for UPEC-infected mice at 24 h have been deposited in the Gene Expression Omnibus database (see Materials and Methods for accession number), and data defining bacterial loads in these mice, along with 2-h array data sets, are described elsewhere (13).
An overall comparison of the bladder transcriptomes triggered by GBS and UPEC UTI at 2 h and 24 h is illustrated by volcano plots in Fig. 7. These plots highlight the total number of shared gene expression responses that we identified as commonly induced/repressed by both pathogens at 24 h (black stars in panels B to D; FDR < 0.05) and also illustrate the much larger number of microbe-specific gene expression patterns that were induced in the bladder at 24 h (red diamonds in panels A to C; FDR < 0.05). In total, the common bladder gene expression responses that were induced/repressed by both GBS and UPEC models at 24 h comprised only 68 genes, which are listed in detail in Table S4 in the supplemental material. The plots in Fig. 7 also illustrate the notably slower innate bladder response to GBS (Fig. 7A and B) compared to the more rapid and broader response induced by UPEC (Fig. 7C and D).
Fig 7.
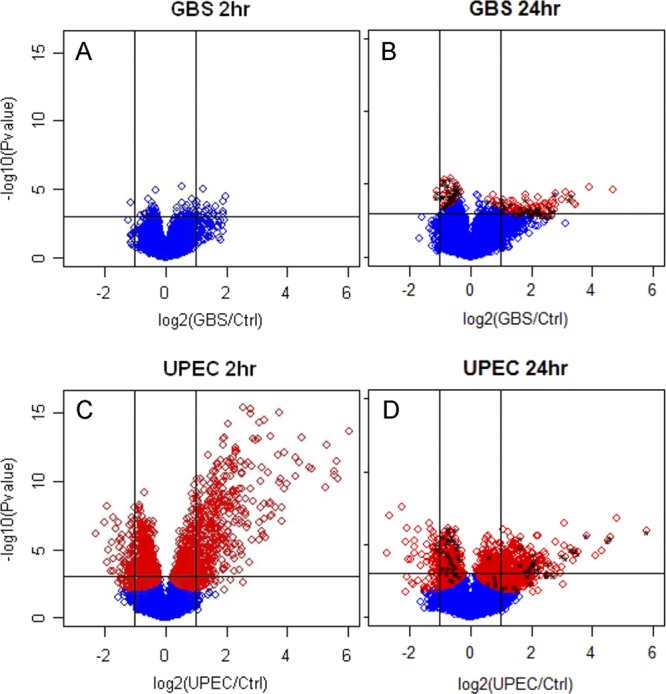
Pathogen-specific defense against GBS in the bladder involves fewer gene expression responses, and these are slower to develop than responses elicited by UPEC. Volcano scatterplots (A and B) illustrate significant genes identified by shrinkage t test results at 2 h and 24 h for GBS, compared to those for UPEC (C and D). Red diamonds represent genes at FDR < 0.05 for both pathogens. Significant changes in gene expression for those genes identified as common (i.e., induced/repressed by both GBS and UPEC after 24 h) are denoted by black stars in panels B and D and are listed in detail in Table S4 in the supplemental material. These common responses illustrate the exact combination of shared and pathogen-specific responses in the bladder transcriptomes due to these two organisms.
Bladder uroepithelial cells provide innate defense against GBS.
We next undertook an analysis of GBS-infected human bladder 5637 uroepithelial cells in vitro to assess whether uroepithelial cells might contribute to the responses that we observed in the bladder transcriptome in mice. For this, we used a multiplex bead-based analysis of cell culture supernatants and compared the response of infected cells to that of control (noninfected) cells for a panel of 8 protein targets that were selected on the basis of significant gene expression responses in the bladder transcriptome and cellular infiltrate data. These experiments were performed in parallel with UPEC experiments for direct comparisons. The results, shown in Fig. 8, illustrate that uroepithelial cells contribute to host defense against GBS through the production of several cytokines, including IL-1β and IL-1ra. Several of these responses were consistent with gene expression patterns observed in mice. Increased production of the chemokine IL-8 by uroepithelial cells at 24 h in response to GBS (Fig. 8) also correlated with the PMN infiltrate observed in the bladder of mice at 24 h (Fig. 1). Comparing the overall responses induced by GBS with those triggered by UPEC showed that several but not all target proteins were induced more strongly by UPEC. These included IL-8 and granulocyte-macrophage colony-stimulating factor (GM-CSF) but not IL-1β or IL-1ra. Other target proteins, including IL-6, IL-13, IL-17, and CCL5, were not significantly induced by GBS over the time course assessed in the human cell culture model, even though these or closely related factors (e.g., IL-13ra1, IL-17rd) were significantly induced/repressed in the GBS bladder transcriptome. Thus, uroepithelial cells contribute to defense against GBS, and several (but not all) responses of human bladder cells are consistent with transcriptional responses in the murine GBS bladder transcriptome.
Fig 8.

Bladder uroepithelial cells contribute to defense against GBS through production of chemokines and cytokines. Human 5637 uroepithelial cells were infected with GBS at an MOI of 10 as described in Materials and Methods, and culture supernatants at 0.5 h, 2 h, and 24 h were used to measure a panel of 8 protein targets identified from array data and histopathology as part of the bladder response to GBS. Data derived from multiplex protein assay are shown for each target and represent the means ± standard errors of the means of the results determined for quadruplicate samples versus control (noninfected) bladder cells.
DISCUSSION
Cystitis due to bacterial infection stems from microbial adherence to uroepithelial cells, which facilitates resistance to the natural hydrodynamic forces of urine flow that remove potential pathogens from the bladder. Uropathogenic GBS was shown to adhere to uroepithelial cells more efficiently than nonuropathogenic GBS in a prior study (83), and the organisms' hemolysin-cytolysin was shown to contribute to the pathogenesis of UTI in mice (35). However, the early events in bladder colonization and the mechanisms of host defense activated immediately following infection with GBS are largely unknown. The results of the current study show that GBS is able to bind to mouse and human bladder uroepithelium rapidly, within minutes of infection, and relatively efficiently compared to the best-adapted bacterial uropathogen, UPEC. This study also shows for the first time that GBS is able to invade human bladder uroepithelial cells and is able to survive inside these cells for at least 24 h, which may contribute to UTI pathogenesis. Adherence to and invasion of bladder uroepithelium set the stage for progression to cystitis once the bacteria are detected by innate immune surveillance mechanisms.
Innate immune signaling cascades are initiated within hours of contact with bacterial pathogens in various infectious settings (17, 18, 71, 95, 96) and are induced in the murine bladder within 2 h of UPEC UTI (13). Such rapid inflammatory responses in the bladder in response to UPEC are exemplified by a 1,000-fold increase in TNF-α expression at 1 h postinfection, which precedes high bladder bacterial loads at 1 day (28), and induction of CXCL1, CXCL6, and MIP-2 within 4 h (7, 25). Surprisingly, despite substantial GBS bladder burdens early in the course of UTI in this study, GBS failed to trigger robust inflammation within 2 h of infection in mice according to genome-wide transcriptomic analysis. Thus, GBS UTI contrasts with UPEC UTI in terms of presentation of the higher GBS bladder burdens very early during infection which precede the bulk of inflammatory responses that occur at 24 h postinfection. Our data also indicate that GBS bladder burdens are not influenced by the presence of urine because the bacteria could not utilize this for growth in vitro, in contrast to UPEC. High GBS loads observed at 2 h in this study are consistent with recent findings of high bladder bacterial loads in C3H/HeN mice at 3 h (35) that progressed with relatively mild immune responses in the bladder. Taken together, these findings suggest that the dynamics of early GBS bladder colonization in these two strains of mice are similar.
This study also showed that innate bladder responses to GBS unfold slowly compared to responses to UPEC and that the breadth of the responses to GBS is more limited in scope. The nature of the pathogen-specific response during cystitis in mice due to these two organisms was unmistakable because of the comparative analyses that were undertaken in parallel across the entire genome. We chose to administer the same infectious dose for both organisms in terms of cell number for our array experimental design in order to precisely control this comparison. However, it would also be interesting to compare gene expression responses in mice given lower doses of UPEC, which, based on prior observations, would be closer to the ID90 for this pathogen. Our comparisons identified only 68 shared gene expression responses induced by both GBS and UPEC, which illustrates that the majority of gene expression changes in the bladder triggered by these organisms are pathogen specific. The bioinformatics findings in this study are of particular interest, because they reveal a marked induction of innate defense mechanisms against GBS in UTI that are essentially unknown in host responses to GBS in general. Some of these, such as ABC transporters, have prominent roles in infectious disease pathogenesis in other settings, and these would be of interest in future GBS host-pathogen studies. Other biological pathways identified by KEGG as enriched in the GBS bladder transcriptome such as TLRs are well-established elements of defense against GBS in non-UTI models both in vitro and in vivo.
A relatively slower and milder innate immune response triggered by GBS compared to UPEC could influence the survival of GBS in the bladder immediately after colonization of the uroepithelium. Interestingly, human blood cultures exposed to GBS also exhibit a delayed pattern of induction of proinflammatory cytokines, including IL-1β and IL-6, which are not produced until 24 h (86, 87). Comparisons of bladder responses to GBS with non-UTI models reveal other commonalities in the transcriptome reported here: IL-6 in GBS sepsis (5, 20, 49), for example, and CCL5, Stat1, Parp9, IL-1β, and Nos2 (23, 31, 58, 77, 81, 83). Factors that might contribute to tissue damage in the bladder during GBS cystitis, including multiple CXC chemokines such as CXCL10 (36) as well as IL-1β (11) and Nos2 (45), were also shown to be induced. However, it should be noted that these factors mediate antimicrobial defense in some infections and thus may be important for disease control in GBS UTI. CXCL10 and Nos2, for example, aid in controlling Gram-negative uropathogens in the bladder (53). The functional contribution of many of these factors in the GBS bladder transcriptome to the progression of UTI can now be investigated based on their expression kinetics as shown in this study.
In terms of UTI pathogenesis in general, different microbes have been strongly linked to host features relevant to disease (76), which underscores the importance of host factors in both controlling and contributing to disease. Several studies have described pathogen-specific immune responses in the urinary tract, and these offer valuable insight into the results of the current study. In a recent study on upper UPEC UTI, a new TLR-4/interferon regulatory factor 3 (IRF3)-dependent pathway of pathogen discrimination was defined (21). Pathogen-specific responses to UPEC were previously associated with mucosal TLR responses involving TLR-4-dependent, lipopolysaccharide (LPS)/CD14-independent defense (22, 26), as reviewed elsewhere (60). In the newly described model, commensal E. coli selectively engaged receptors that drive IRF3 activation by UPEC, leading to epithelial gene transcription in a pathogen-specific manner (21). In the current study, GBS did not trigger IRF3; however, IRF1 and IRF7 were activated transcriptionally. This implies that mechanisms involving IRF1 and IRF7, which are involved in prominent signaling events in the GBS bladder transcriptome such as that associated with CXCL10 (88, 94), may drive immune engagement in the bladder early during GBS UTI. Thus, further studies would be of interest to address the potential role of interferon regulatory factors in GBS UTI.
TLR signaling genes were identified as overrepresented in several biological pathways in the GBS bladder transcriptome according to innateDB, which was used to gain insight into networks relevant to innate immunity beyond KEGG and GO (39, 40). While there remains a debate concerning how GBS initiates innate immune responses, there is a consensus with respect to an important role for TLR-2. In systemic GBS infection, TLR-2 deficiency is associated with impaired host resistance (59); in peritoneal macrophages, GBS induces TLR-2-dependent gene activation (12), and in a neonatal infection model, TLR-2 was necessary for GBS clearance (42). There is little published data on TLR-2 signaling in the bladder; however, a body of recent evidence suggests that TLR-4 is central to the induction of local innate immunity (60, 72, 73, 93). TLR-4 and CXCR1 deficiency predisposes to asymptomatic carriage of E. coli and possibly other uropathogens (60). In this study, GBS upregulated the genes for TLR-2, -11, -1, and -6 marginally but none of these responses were statistically significant. InnateDB identified interactions involving TLR-9, suggesting recognition of unmethylated CpG GBS DNA. Upregulation of many IL-1 family members in the GBS bladder transcriptome also suggests potential involvement of TLR-2, especially considering recent reports on the upregulation of IL-1 through TLR-2 in response to intracellular infection (37) and Borrelia (6). It is also valuable to interpret these data for GBS against those described for enterococci in mice, which revealed TLR-2-independent inflammation during pyelonephritis (30). In GBS UTI, upregulation of TLR-2 might occur later during infection (after 24 h) or may act in signal transduction in the absence of upregulation. However, an absence of significant upregulation of TLR-2 early during UTI may also explain the relatively slow bladder immune response to GBS and the high incidence of GBS ABU that is observed clinically (84).
In this study, we observed a number of important correlations between the GBS bladder transcriptome in mice and protein production in human bladder uroepithelial cells that were challenged with GBS in vitro. This is the first report, to our knowledge, that human bladder cells contribute to defense against GBS through the production of cytokines and chemokines, including IL-1β, IL-1ra, and IL-8. Some of these findings, such as that for IL-8, support our histopathology observations of a notable PMN inflammatory infiltrate in the bladder of mice after 1 day of GBS UTI. Other findings in the human bladder cell culture model, however, such as an absence of response for CCL5, and other factors related to genes identified as significant in the bladder transcriptome (e.g., IL-13 and IL-17), suggest limitations of this in vitro model. Here, it is important to underscore the limitations of epithelial cell monoculture models for the host response studies; cell-cell interactions, for example, are often necessary to generate effective antibacterial responses, as reviewed elsewhere (14). The timing and duration of infection in such models can also influence bacterial adherence to (and invasion of) host cells, as demonstrated in the present work for UPEC (0.5 h versus 2 h), and this could alter cytokine responses. In these assays, we tested culture supernatants at 0.5 h, 2 h, and 24 h, but it is plausible that these responses could differ depending on the timing of infection. Moreover, many cell types that would be present in the infected bladder in vivo such as resident macrophages, lymphocytes, and PMNs as well as other infiltrating cells were excluded from the human cell culture model. Thus, the contribution of these cells to defense, and the role of cytokines produced by human bladder cells in UTI, requires further investigation. Importantly, however, several pathogen (e.g., IL-1β, IL-1ra)-specific responses were also evident in the human bladder cell response, which supports the finding of distinct bladder transcriptomes for GBS and UPEC observed in mice. Finally, one must consider species differences between mouse and human when extrapolating protein expression data from human bladder cells in culture to data derived from mouse infection assays. The lack of IL-1β protein detected at 24 h in the human cell culture model in this study, for example, contrasts with high levels of this cytokine induced by both GBS and UPEC in mice at 18 to 24 h during cystitis (83). However, these distinctions may reflect any of the multiple limitations inherent in these models as described, and such comparisons are therefore valid only in view of these various limitations.
Several recent studies on immune responses to bacterial uropathogens have investigated these responses in relation to the degree of immune activation in the urinary tract and the control of disease. In Ureaplasma parvum UTI, for example, complications of infection were shown to depend on host factors related to exaggerated, as opposed to minimal, immune responses (62). In that study, animals that developed asymptomatic, rather than acute, UTI exhibited divergent non-PMN-related responses in the urinary tract. More minimalistic immune responses led to a higher rate of pyelonephritis in infected animals. These findings support the notion that the degree of host response contributes to the pathogenesis of bacterial UTI, as discussed elsewhere (74). In the current study, only a few mice exhibited positive kidney culture results following challenge with GBS despite all mice harboring high GBS bladder burdens at 2 h and most exhibiting moderate bladder and urine burdens at 24 h. This suggests that that the early immune responses activated by GBS in the bladder are mostly effective in preventing ascension of the bacteria to the kidneys. Note, however, that GBS kidney colonization patterns may differ between mouse strains and that pyelonephritis is more prevalent in C3H/HeN mice, which exhibit inflammation and a cellular infiltrate (35). These data imply that array mapping of GBS pyelonephritis in mice would be useful to define immune activation under this condition; this would ideally be undertaken using a more consistent model of upper UTI than that described in the current work.
Finally, our data support the observations of a recent study that showed that GBS simultaneously stimulates and suppresses immune activation, through distinct pro- and anti-inflammatory mechanisms in the bladder (35). Our bioinformatics findings based on GO showed that GBS activates biological pathways related to downregulation of defense and to downregulation of inflammation early during infection. However, GBS also triggered pathways of T-lymphocyte-mediated immunity, nitric oxide synthesis, and TNF-α production. Collectively, these results confirm that GBS simultaneously suppresses and activates bladder inflammation.
In summary, this report defines a minimalistic, pathogen-specific bladder transcriptome of GBS cystitis. Many of the factors identified within this response require future investigation to define their potential roles in defense against GBS UTI. Overall, this report offers a critical new perspective on the uniqueness of bladder responses to different uropathogens and, more broadly, highlights the distinct mechanisms of UTI pathogenesis induced by different bacteria.
Supplementary Material
ACKNOWLEDGMENTS
This study was supported with grants from the National Health and Medical Research Council (569674) and a Griffith Health Institute Grant. This work was also supported by the O'Brien Centre grant DK079337. G.C.U. is a Future Fellow of the Australian Research Council, and C.K.T. is a Prime Minister's Endeavor Asia Fellow.
We thank Janice King and Yvette Hale for excellent technical assistance, Flora Gathof for administrative assistance, and David Briles for helpful discussions.
Footnotes
Published ahead of print 25 June 2012
Supplemental material for this article may be found at http://iai.asm.org/.
REFERENCES
- 1. Anderson BL, Simhan HN, Simons KM, Wiesenfeld HC. 2007. Untreated asymptomatic group B streptococcal bacteriuria early in pregnancy and chorioamnionitis at delivery. Am. J. Obstet. Gynecol. 196:524.e1-524.e5 [DOI] [PubMed] [Google Scholar]
- 2. Ashburner M, et al. 2000. Gene ontology: tool for the unification of biology. The Gene Ontology Consortium. Nat. Genet. 25:25–29 [DOI] [PMC free article] [PubMed] [Google Scholar]
- 3. Baker CJ. 2000. Group B streptococcal infections, p 222–237 In Stevens DL, Kaplan EL. (ed), Streptococcal infections. Clinical aspects, microbiology, and molecular pathogenesis. Oxford University Press, New York, NY [Google Scholar]
- 4. Barry WT, Nobel AB, Wright FA. 2005. Significance analysis of functional categories in gene expression studies: a structured permutation approach. Bioinformatics 21:1943–1949 doi:10.1093/bioinformatics/bti260 [DOI] [PubMed] [Google Scholar]
- 5. Bender L, et al. 2008. Early and late markers for the detection of early-onset neonatal sepsis. Dan. Med. Bull. 55:219–223 [PubMed] [Google Scholar]
- 6. Berende A, Oosting M, Kullberg BJ, Netea MG, Joosten LA. 2010. Activation of innate host defense mechanisms by Borrelia. Eur. Cytokine Netw. 21:7–18 [DOI] [PubMed] [Google Scholar]
- 7. Billips BK, et al. 2007. Modulation of host innate immune response in the bladder by uropathogenic Escherichia coli. Infect. Immun. 75:5353–5360 [DOI] [PMC free article] [PubMed] [Google Scholar]
- 8. Candela JV, et al. 1998. Evaluation of urinary IL-1alpha and IL-1beta in gravid females and patients with bacterial cystitis and microscopic hematuria. Urol. Res. 26:175–180 [DOI] [PubMed] [Google Scholar]
- 9. Cui X. 2010. Experimental designs on high-throughput biological experiments, p 201–217 In Lee JK. (ed), Statistical bioinformatics: for biomedical and life science researchers. Wiley-Blackwell, Hoboken, NJ [Google Scholar]
- 10. Cui X, Hwang JT, Qiu J, Blades NJ, Churchill GA. 2005. Improved statistical tests for differential gene expression by shrinking variance components estimates. Biostatistics 6:59–75 doi:10.1093/biostatistics/kxh018 [DOI] [PubMed] [Google Scholar]
- 11. Dinarello CA. 2011. Interleukin-1 in the pathogenesis and treatment of inflammatory diseases. Blood 117:3720–3732 doi:10.1182/blood-2010-07-273417 [DOI] [PMC free article] [PubMed] [Google Scholar]
- 12. Draper DW, Bethea HN, He YW. 2006. Toll-like receptor 2-dependent and -independent activation of macrophages by group B streptococci. Immunol. Lett. 102:202–214 [DOI] [PubMed] [Google Scholar]
- 13. Duell BL, et al. 2012. Innate transcriptional networks activated in bladder in response to uropathogenic Escherichia coli drive diverse biological pathways and rapid synthesis of IL-10 for defense against bacterial urinary tract infection. J. Immunol. 188:781–792 doi:10.4049/jimmunol.1101231 [DOI] [PubMed] [Google Scholar]
- 14. Duell BL, Cripps AW, Schembri MA, Ulett GC. 2011. Epithelial cell coculture models for studying infectious diseases: benefits and limitations. J. Biomed. Biotechnol. 2011:852419. [DOI] [PMC free article] [PubMed] [Google Scholar]
- 15. Edwards MS, Baker CJ. 2005. Group B streptococcal infections in elderly adults. Clin. Infect. Dis. 41:839–847 [DOI] [PubMed] [Google Scholar]
- 16. Engel D, et al. 2006. Tumor necrosis factor alpha- and inducible nitric oxide synthase-producing dendritic cells are rapidly recruited to the bladder in urinary tract infection but are dispensable for bacterial clearance. Infect. Immun. 74:6100–6107 [DOI] [PMC free article] [PubMed] [Google Scholar]
- 17. Eskra L, Mathison A, Splitter G. 2003. Microarray analysis of mRNA levels from RAW264.7 macrophages infected with Brucella abortus. Infect. Immun. 71:1125–1133 [DOI] [PMC free article] [PubMed] [Google Scholar]
- 18. Evans SE, et al. 2010. Stimulated innate resistance of lung epithelium protects mice broadly against bacteria and fungi. Am. J. Respir. Cell Mol. Biol. 42:40–50 [DOI] [PMC free article] [PubMed] [Google Scholar]
- 19. Falagas ME, Rosmarakis ES, Avramopoulos I, Vakalis N. 2006. Streptococcus agalactiae infections in non-pregnant adults: single center experience of a growing clinical problem. Med. Sci. Monit. 12:CR447–CR451 [PubMed] [Google Scholar]
- 20. Fida NM, Al-Mughales JA, Fadelallah MF. 2006. Serum concentrations of interleukin-1 alpha, interleukin-6 and tumor necrosis factor-alpha in neonatal sepsis and meningitis. Saudi Med. J. 27:1508–1514 [PubMed] [Google Scholar]
- 21. Fischer H, et al. 2010. Pathogen specific, IRF3-dependent signaling and innate resistance to human kidney infection. PLoS Pathog. 6:e1001109 doi:10.1371/journal.ppat.1001109 [DOI] [PMC free article] [PubMed] [Google Scholar]
- 22. Fischer H, Yamamoto M, Akira S, Beutler B, Svanborg C. 2006. Mechanism of pathogen-specific TLR4 activation in the mucosa: fimbriae, recognition receptors and adaptor protein selection. Eur. J. Immunol. 36:267–277 [DOI] [PubMed] [Google Scholar]
- 23. Fong CH, et al. 2008. An antiinflammatory role for IKKbeta through the inhibition of “classical” macrophage activation. J. Exp. Med. 205:1269–1276 [DOI] [PMC free article] [PubMed] [Google Scholar]
- 24. Foxman B. 2002. Epidemiology of urinary tract infections: incidence, morbidity, and economic costs. Am. J. Med. 113(Suppl. 1A):5S–13S [DOI] [PubMed] [Google Scholar]
- 25. Hang L, et al. 1999. Macrophage inflammatory protein-2 is required for neutrophil passage across the epithelial barrier of the infected urinary tract. J. Immunol. 162:3037–3044 [PubMed] [Google Scholar]
- 26. Hedlund M, Svensson M, Nilsson A, Duan RD, Svanborg C. 1996. Role of the ceramide-signaling pathway in cytokine responses to P-fimbriated Escherichia coli. J. Exp. Med. 183:1037–1044 [DOI] [PMC free article] [PubMed] [Google Scholar]
- 27. Henneke P, et al. 2001. Novel engagement of CD14 and multiple toll-like receptors by group B streptococci. J. Immunol. 167:7069–7076 [DOI] [PubMed] [Google Scholar]
- 28. Ingersoll MA, Kline KA, Nielsen HV, Hultgren SJ. 2008. G-CSF induction early in uropathogenic Escherichia coli infection of the urinary tract modulates host immunity. Cell Microbiol. 10:2568–2578 doi:10.1111/j.1462-5822.2008.01230.x [DOI] [PMC free article] [PubMed] [Google Scholar]
- 29. Kanehisa M, Goto S, Kawashima S, Okuno Y, Hattori M. 2004. The KEGG resource for deciphering the genome. Nucleic Acids Res. 32:D277–D280 doi:10.1093/nar/gkh063 [DOI] [PMC free article] [PubMed] [Google Scholar]
- 30. Kau AL, et al. 2005. Enterococcus faecalis tropism for the kidneys in the urinary tract of C57BL/6J mice. Infect. Immun. 73:2461–2468 [DOI] [PMC free article] [PubMed] [Google Scholar]
- 31. Kenzel S, et al. 2009. Role of p38 and early growth response factor 1 in the macrophage response to group B streptococcus. Infect. Immun. 77:2474–2481 [DOI] [PMC free article] [PubMed] [Google Scholar]
- 32. Khalil A, et al. 1997. Cytokine gene expression during experimental Escherichia coli pyelonephritis in mice. J. Urol. 158:1576–1580 doi:10.1016/S0022-5347(01)64282-4 [PubMed] [Google Scholar]
- 33. Klemm P, Roos V, Ulett GC, Svanborg C, Schembri MA. 2006. Molecular characterization of the Escherichia coli asymptomatic bacteriuria strain 83972: the taming of a pathogen. Infect. Immun. 74:781–785 [DOI] [PMC free article] [PubMed] [Google Scholar]
- 34. Klemm P, Schembri MA. 2000. Bacterial adhesins: function and structure. Int. J. Med. Microbiol. 290:27–35 [DOI] [PubMed] [Google Scholar]
- 35. Kline KA, Schwartz DJ, Lewis WG, Hultgren SJ, Lewis AL. 2011. Immune activation and suppression by group B streptococcus in a murine model of urinary tract infection. Infect. Immun. 79:3588–3595 [DOI] [PMC free article] [PubMed] [Google Scholar]
- 36. Lee EY, Lee ZH, Song YW. 2009. CXCL10 and autoimmune diseases. Autoimmun. Rev. 8:379–383 [DOI] [PubMed] [Google Scholar]
- 37. Liu PT, et al. 2009. Convergence of IL-1beta and VDR activation pathways in human TLR2/1-induced antimicrobial responses. PLoS One 4:e5810 doi:10.1371/journal.pone.0005810 [DOI] [PMC free article] [PubMed] [Google Scholar]
- 38. Lloyd AL, Smith SN, Eaton KA, Mobley HL. 2009. Uropathogenic Escherichia coli suppresses the host inflammatory response via pathogenicity island genes sisA and sisB. Infect. Immun. 77:5322–5333 [DOI] [PMC free article] [PubMed] [Google Scholar]
- 39. Lynn DJ, et al. 2010. Curating the innate immunity interactome. BMC Syst. Biol. 4:117. [DOI] [PMC free article] [PubMed] [Google Scholar]
- 40. Lynn DJ, et al. 2008. InnateDB: facilitating systems-level analyses of the mammalian innate immune response. Mol. Syst. Biol. 4:218. [DOI] [PMC free article] [PubMed] [Google Scholar]
- 41. Mabbett AN, et al. 2009. Virulence properties of asymptomatic bacteriuria Escherichia coli. Int. J. Med. Microbiol. 299:53–63 [DOI] [PubMed] [Google Scholar]
- 42. Mancuso G, et al. 2004. Dual role of TLR2 and myeloid differentiation factor 88 in a mouse model of invasive group B streptococcal disease. J. Immunol. 172:6324–6329 [DOI] [PubMed] [Google Scholar]
- 43. Mobley HL, et al. 1990. Pyelonephritogenic Escherichia coli and killing of cultured human renal proximal tubular epithelial cells: role of hemolysin in some strains. Infect. Immun. 58:1281–1289 [DOI] [PMC free article] [PubMed] [Google Scholar]
- 44. Moller M, Thomsen AC, Borch K, Dinesen K, Zdravkovic M. 1984. Rupture of fetal membranes and premature delivery associated with group B streptococci in urine of pregnant women. Lancet ii:69–70 [DOI] [PubMed] [Google Scholar]
- 45. Mühl H, Bachmann M, Pfeilschifter J. 2011. Inducible NO synthase and antibacterial host defence in times of Th17/Th22/T22 immunity. Cell Microbiol. 13:340–348 doi:10.1111/j.1462-5822.2010.01559.x [DOI] [PubMed] [Google Scholar]
- 46. Muller AE, Oostvogel PM, Steegers EA, Dorr PJ. 2006. Morbidity related to maternal group B streptococcal infections. Acta Obstet. Gynecol. Scand. 85:1027–1037 [DOI] [PubMed] [Google Scholar]
- 47. Oelschlaeger TA, Dobrindt U, Hacker J. 2002. Virulence factors of uropathogens. Curr. Opin. Urol. 12:33–38 [DOI] [PubMed] [Google Scholar]
- 48. Ogata H, et al. 1999. KEGG: Kyoto Encyclopedia of Genes and Genomes. Nucleic Acids Res. 27:29–34 doi:10.1093/nar/27.1.29 [DOI] [PMC free article] [PubMed] [Google Scholar]
- 49. Okazaki K, et al. 2008. Temporal alterations in concentrations of sera cytokines/chemokines in sepsis due to group B streptococcus infection in a neonate. Jpn. J. Infect. Dis. 61:382–385 [PubMed] [Google Scholar]
- 50. Olszyna DP, et al. 2001. CXC chemokine receptor 2 contributes to host defense in murine urinary tract infection. J. Infect. Dis. 184:301–307 [DOI] [PubMed] [Google Scholar]
- 51. Oregioni O, et al. 2005. Urinary interleukin-8 is elevated in urinary tract infections independently of the causative germs. Cytokine 31:415–418 doi:10.1016/j.cyto.2005.06.009 [DOI] [PubMed] [Google Scholar]
- 52. Otto G, Braconier J, Andreasson A, Svanborg C. 1999. Interleukin-6 and disease severity in patients with bacteremic and nonbacteremic febrile urinary tract infection. J. Infect. Dis. 179:172–179 [DOI] [PubMed] [Google Scholar]
- 53. Otto G, Burdick M, Strieter R, Godaly G. 2005. Chemokine response to febrile urinary tract infection. Kidney Int. 68:62–70 doi:10.1111/j.1523-1755.2005.00381.x [DOI] [PubMed] [Google Scholar]
- 54. Persson K, Bjerre B, Elfstrom L, Polberger S, Forsgren A. 1986. Group B streptococci at delivery: high count in urine increases risk for neonatal colonization. Scand. J. Infect. Dis. 18:525–531 [DOI] [PubMed] [Google Scholar]
- 55. Persson K, et al. 1985. Asymptomatic bacteriuria during pregnancy with special reference to group B streptococci. Scand. J. Infect. Dis. 17:195–199 [DOI] [PubMed] [Google Scholar]
- 56. Pfaffl MW. 2001. A new mathematical model for relative quantification in real time RT-PCR. Nucleic Acids Res. 29:e45 doi:10.1093/nar/29.9.e45 [DOI] [PMC free article] [PubMed] [Google Scholar]
- 57. Pfaffl MW, Horgan GW, Dempfle L. 2002. Relative expression software tool (REST) for group-wise comparison and statistical analysis of relative expression results in real-time PCR. Nucleic Acids Res. 30:e36 doi:10.1093/nar/30.9.e36 [DOI] [PMC free article] [PubMed] [Google Scholar]
- 58. Puliti M, Bistoni F, Tissi L. 2010. Lack of B7-1 and B7-2 costimulatory molecules modulates the severity of group B Streptococcus-induced arthritis. Microbes Infect. 12:302–308 doi:10.1016/j.micinf.2010.01.006 [DOI] [PubMed] [Google Scholar]
- 59. Puliti M, Uematsu S, Akira S, Bistoni F, Tissi L. 2009. Toll-like receptor 2 deficiency is associated with enhanced severity of group B streptococcal disease. Infect. Immun. 77:1524–1531 [DOI] [PMC free article] [PubMed] [Google Scholar]
- 60. Ragnarsdóttir B, et al. 2008. TLR- and CXCR1-dependent innate immunity: insights into the genetics of urinary tract infections. Eur. J. Clin. Invest. 38(Suppl. 2):12–20 [DOI] [PubMed] [Google Scholar]
- 61. Reed LJ, Muench HA. 1938. A simple method of estimating fifty percent endpoints. Am. J. Hyg. (Lond.) 27:493–497 [Google Scholar]
- 62. Reyes L, Reinhard M, Brown MB. 2009. Different inflammatory responses are associated with Ureaplasma parvum-induced UTI and urolith formation. BMC Infect. Dis. 9:9. [DOI] [PMC free article] [PubMed] [Google Scholar]
- 63. Ronald A. 2002. The etiology of urinary tract infection: traditional and emerging pathogens. Am. J. Med. 113(Suppl. 1A):14S–19S [DOI] [PubMed] [Google Scholar]
- 64. Roos V, Ulett GC, Schembri MA, Klemm P. 2006. The asymptomatic bacteriuria Escherichia coli strain 83972 outcompetes uropathogenic E. coli strains in human urine. Infect. Immun. 74:615–624 [DOI] [PMC free article] [PubMed] [Google Scholar]
- 65. Rouschop KM, et al. 2006. Urothelial CD44 facilitates Escherichia coli infection of the murine urinary tract. J. Immunol. 177:7225–7232 [DOI] [PubMed] [Google Scholar]
- 66. Säemann MD, Weichhart T, Horl WH, Zlabinger GJ. 2005. Tamm-Horsfall protein: a multilayered defence molecule against urinary tract infection. Eur. J. Clin. Invest. 35:227–235 [DOI] [PubMed] [Google Scholar]
- 67. Säemann MD, et al. 2005. Tamm-Horsfall glycoprotein links innate immune cell activation with adaptive immunity via a Toll-like receptor-4-dependent mechanism. J. Clin. Invest. 115:468–475 doi:10.1172/JCI22720 [DOI] [PMC free article] [PubMed] [Google Scholar]
- 68. Sheu JN, et al. 2006. Serum and urine levels of interleukin-6 and interleukin-8 in children with acute pyelonephritis. Cytokine 36:276–282 doi:10.1016/j.cyto.2007.02.006 [DOI] [PubMed] [Google Scholar]
- 69. Sivick KE, Mobley HL. 2010. Waging war against uropathogenic Escherichia coli: winning back the urinary tract. Infect. Immun. 78:568–585 [DOI] [PMC free article] [PubMed] [Google Scholar]
- 70. Sivick KE, Schaller MA, Smith SN, Mobley HL. 2010. The innate immune response to uropathogenic Escherichia coli involves IL-17A in a murine model of urinary tract infection. J. Immunol. 184:2065–2075 doi:10.4049/jimmunol.0902386 [DOI] [PMC free article] [PubMed] [Google Scholar]
- 71. Smith PD, et al. 2011. Intestinal macrophages and response to microbial encroachment. Mucosal Immunol. 4:31–42 doi:10.1038/mi.2010.66 [DOI] [PMC free article] [PubMed] [Google Scholar]
- 72. Song J, Bishop BL, Li G, Duncan MJ, Abraham SN. 2007. TLR4-initiated and cAMP-mediated abrogation of bacterial invasion of the bladder. Cell Host Microbe 1:287–298 doi:10.1016/j.chom.2007.05.007 [DOI] [PMC free article] [PubMed] [Google Scholar]
- 73. Song J, et al. 2009. TLR4-mediated expulsion of bacteria from infected bladder epithelial cells. Proc. Natl. Acad. Sci. U. S. A. 106:14966–14971 [DOI] [PMC free article] [PubMed] [Google Scholar]
- 74. Svanborg C, et al. 2001. The ‘innate’ host response protects and damages the infected urinary tract. Ann. Med. 33:563–570 [DOI] [PubMed] [Google Scholar]
- 75. Svanborg C, et al. 2006. Uropathogenic Escherichia coli as a model of host-parasite interaction. Curr. Opin. Microbiol. 9:33–39 [DOI] [PubMed] [Google Scholar]
- 76. Tabibian JH, et al. 2008. Uropathogens and host characteristics. J. Clin. Microbiol. 46:3980–3986 [DOI] [PMC free article] [PubMed] [Google Scholar]
- 76a. Tan CK, et al. 2011. Abstr. 111th Annu. Gen. Meet. Am. Soc. Microbiol., 21 to 24 May 2011, New Orleans, LA, abstr 11-GM-A-2691 [Google Scholar]
- 77. Trigo G, et al. 2009. Leukocyte populations and cytokine expression in the mammary gland in a mouse model of Streptococcus agalactiae mastitis. J. Med. Microbiol. 58:951–958 [DOI] [PubMed] [Google Scholar]
- 78. Ulett GC, Adderson EE. 2005. Nitric oxide is a key determinant of group B streptococcus-induced murine macrophage apoptosis. J. Infect. Dis. 191:1761–1770 [DOI] [PubMed] [Google Scholar]
- 79. Ulett GC, Adderson EE. 2006. Regulation of apoptosis by Gram-positive bacteria: mechanistic diversity and consequences for immunity. Curr. Immunol. Rev. 2:119–141 [DOI] [PMC free article] [PubMed] [Google Scholar]
- 80. Ulett GC, Bohnsack JF, Armstrong J, Adderson EE. 2003. Beta-hemolysin-independent induction of apoptosis of macrophages infected with serotype III group B streptococcus. J. Infect. Dis. 188:1049–1053 [DOI] [PubMed] [Google Scholar]
- 81. Ulett GC, Maclean KH, Nekkalapu S, Cleveland JL, Adderson EE. 2005. Mechanisms of group B streptococcal-induced apoptosis of murine macrophages. J. Immunol. 175:2555–2562 [DOI] [PubMed] [Google Scholar]
- 82. Ulett GC, et al. 2007. Functional analysis of antigen 43 in uropathogenic Escherichia coli reveals a role in long term persistence in the urinary tract. Infect. Immun. 75:3233–3244 [DOI] [PMC free article] [PubMed] [Google Scholar]
- 83. Ulett GC, et al. 2010. Group B Streptococcus (GBS) urinary tract infection involves binding of GBS to bladder uroepithelium and potent but GBS-specific induction of interleukin 1alpha. J. Infect. Dis. 201:866–870 [DOI] [PubMed] [Google Scholar]
- 84. Ulett KB, et al. 2009. Diversity of group B streptococcus serotypes causing urinary tract infection in adults. J. Clin. Microbiol. 47:2055–2060 [DOI] [PMC free article] [PubMed] [Google Scholar]
- 85. Valle J, et al. 2008. UpaG, a new member of the trimeric autotransporter family of adhesins in uropathogenic Escherichia coli. J. Bacteriol. 190:4147–4161 doi:10.1128/JB.00122-08 [DOI] [PMC free article] [PubMed] [Google Scholar]
- 86. von Hunolstein C, et al. 1997. Soluble antigens from group B streptococci induce cytokine production in human blood cultures. Infect. Immun. 65:4017–4021 [DOI] [PMC free article] [PubMed] [Google Scholar]
- 87. von Hunolstein C, Totolian A, Alfarone G, Teti G, Orefici G. 1997. Cytokine production in an ex vivo whole blood model following induction by group B streptococcal polysaccharides and lipoteichoic acid. Adv. Exp. Med. Biol. 418:893–896 [DOI] [PubMed] [Google Scholar]
- 88. Watanabe T, et al. 2010. NOD1 contributes to mouse host defense against Helicobacter pylori via induction of type I IFN and activation of the ISGF3 signaling pathway. J. Clin. Invest. 120:1645–1662 doi:10.1172/JCI39481 [DOI] [PMC free article] [PubMed] [Google Scholar]
- 89. Watts RE, et al. 2012. Contribution of siderophore systems to growth and urinary tract colonization of asymptomatic bacteriuria Escherichia coli. Infect. Immun. 80:333–344 [DOI] [PMC free article] [PubMed] [Google Scholar]
- 90. Wood EG, Dillon HC., Jr 1981. A prospective study of group B streptococcal bacteriuria in pregnancy. Am. J. Obstet. Gynecol. 140:515–520 [DOI] [PubMed] [Google Scholar]
- 91. Wright KJ, Hultgren SJ. 2006. Sticky fibers and uropathogenesis: bacterial adhesins in the urinary tract. Future Microbiol. 1:75–87 doi:10.2217/17460913.1.1.75 [DOI] [PubMed] [Google Scholar]
- 92. Yadav M, et al. 2010. Inhibition of TIR domain signaling by TcpC: MyD88-dependent and independent effects on Escherichia coli virulence. PLoS Pathog. 6:e1001120 doi:10.1371/journal.ppat.1001120 [DOI] [PMC free article] [PubMed] [Google Scholar]
- 93. Yin X, et al. 2010. Enhancement of the innate immune response of bladder epithelial cells by Astragalus polysaccharides through upregulation of TLR4 expression. Biochem. Biophys. Res. Commun. 397:232–238 [DOI] [PubMed] [Google Scholar]
- 94. Zaheer RS, Proud D. 2010. Human rhinovirus-induced epithelial production of CXCL10 is dependent upon IFN regulatory factor-1. Am. J. Respir. Cell Mol. Biol. 43:413–421 [DOI] [PubMed] [Google Scholar]
- 95. Zasloff M. 2007. Antimicrobial peptides, innate immunity, and the normally sterile urinary tract. J. Am. Soc. Nephrol. 18:2810–2816 [DOI] [PubMed] [Google Scholar]
- 96. Zhang X, et al. 2004. Gene expression in mature neutrophils: early responses to inflammatory stimuli. J. Leukoc. Biol. 75:358–372 [DOI] [PubMed] [Google Scholar]
Associated Data
This section collects any data citations, data availability statements, or supplementary materials included in this article.