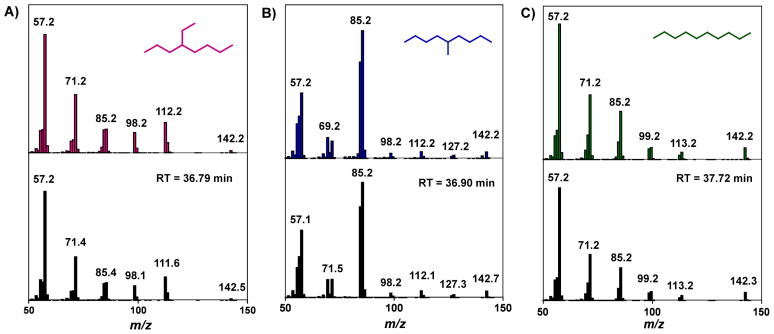
Figure 3.
Electron-impact (EI) ionization mass spectra (black) of the peaks that appear in the C10 alkane sample (Figure 2) at A) 36.79 min, B) 36.90 min, and C) 37.72 min. For comparison, the mass spectra for authentic samples of 4-ethyloctane (pink), 5-methylnonane (blue), and decane (green) are shown directly above that for A, B, and C, respectively. RT = retention time.

