

Abstract
The COP9 signalosome (CSN) is a multi-subunit protein complex that performs critical roles in controlling diverse cellular and developmental processes. Aberrant regulation of the CSN complex has been shown to lead to tumorigenesis. Despite its biological significance, our current knowledge of the function and regulation of the CSN complex is very limited. To explore CSN biology, we have developed and employed a new version of the tag team-based QTAX strategy (quantitative analysis of tandem affinity purified in vivo cross-linked (X) protein complexes) by incorporating a label-free MS method for quantitation. Coupled with protein interaction network analysis, this strategy produced a comprehensive and detailed assessment of the protein interaction network of the human CSN complex. In total, we quantitatively characterized 825 putative CSN-interacting proteins, with 270 classified as core interactors (captured by all three bait purifications). Biochemical validation further confirms the validity of selected identified interactors. This work presents the most complete analysis of the CSN interaction network to date, providing an inclusive set of physical interaction data consistent with physiological roles for the CSN. Moreover, the methodology described here is a general proteomic tool for the comprehensive study of protein interaction networks.
The COP9 signalosome (CSN)1 is an evolutionally conserved, eight-subunit protein complex (CSN1–8) that exists in all eukaryotes (1, 2). It is involved in the regulation of diverse cellular and developmental processes. Disregulation of the CSN complex can have drastic effects on various cellular functions attributed to tumor development, including maintenance of DNA fidelity, cell cycle control, DNA repair, angiogenesis, and microenvironmental homeostasis (3–5). Although several biological functions have been delegated to the CSN complex (6–8), it has only one well recognized and characterized function, i.e., its deneddylase activity, which entails cleavage of ubiquitin-like molecule Nedd8 modifications from substrate proteins (9). Key to CSN complex activity is the CSN5 subunit, which carries the functional MPN+ metalloprotease domain responsible for the CSN deneddylase activity. One group of neddylated substrates is the cullin family proteins (9, 10). These proteins function as key components of cullin-RING ubiquitin E3 ligases (CRLs), protein complexes that attach ubiquitin molecules to specific protein substrates, targeting them for proteasome-dependent degradation (11, 12). Removal of covalently attached Nedd8 from cullin subunits inactivates CRL complexes (9, 10) and thus controls the dynamic cycle of neddylation and deneddylation of cullins, a proposed crucial step in regulating the assembly and activity of CRLs (12–14). However, recent investigation into the architecture of CRL networks using quantitative mass spectrometry has revealed an alternative model of CRL dynamicity, in which the abundance of adaptor modules, rather than cycles of neddylation, drives CRL network organization (15). Although the details in the regulation of CRL structure may be debatable, it is evident that the CSN plays an important role in modulating CRL function and CRL-dependent proteolysis in the ubiquitin-proteasome system. Clearly, tight regulation of cellular CSN activity is indispensable, yet the precise molecular basis for this regulation still remains unclear.
Protein-protein interactions are important for nearly all biological processes and have been recognized as one of the major regulatory mechanisms for modulating protein functions. The CSN complex is known to possess multiple functionalities that are often related to their interacting proteins (6–8). Therefore, for complete understanding of the function and regulation of the CSN complex, it is necessary to unravel how the CSN interacts with not only individual proteins but also other protein complexes and signaling pathways. In recent years, native affinity purification coupled with mass spectrometry has been successfully employed to identify protein interactions of the human CSN complex (15–17). Although this represents a great step forward toward understanding CSN biology, only a limited number of interactions have been characterized, most of which are CRL components and already known, stable CSN interactions. This may be partly due to inherent limitations of native affinity purification in which weak and/or transient interactions are often lost. Thus, new strategies are needed for generating a more comprehensive understanding of the molecular interconnectivity of the CSN complex as it exists in cells.
Previously, our lab developed an integrated proteomic approach, QTAX (quantitative analysis of tandem affinity purified in vivo cross-linked (X) protein complexes), to allow the capture and quantitative identification of stable, weak, and transient protein interactions in a single analysis (18, 19). This approach incorporates three key components including 1) in vivo chemical cross-linking to stabilize protein interactions in the cell prior to lysis; 2) HB tag-based tandem affinity purification under fully denaturing conditions to effectively remove nonspecific purification background; and 3) quantitative mass spectrometry to identify specific interactions. This strategy has been successfully applied for mapping protein interaction networks of the 26S proteasome and other protein complexes in yeast (18, 20–23).
In the original QTAX scheme, specific interacting proteins are determined using a SILAC-based quantitative mass spectrometry approach (18, 22, 23). The SILAC method relies on metabolic labeling that provides in vivo incorporation of stable isotope-labeled amino acids into the entire proteome during cell culture, allowing unbiased labeling, no sample loss, and minimum variability during labeling (24, 25). Given these unique features, SILAC seems to be the ideal quantitative approach for the QTAX strategy (18, 19). Nevertheless, the typical SILAC experiment is limited to pair-wise comparison (24, 25). Although comparisons between three or more samples are possible (24, 26), the resulting LC-MS/MS analyses can be quite complex because of the presence of multiple labeled ion clusters for a given peptide. Additionally, SILAC experiments can be quite costly especially when comparing multiple samples as with a “tag team” approach. In recent years, label-free quantification approaches have developed as attractive alternatives because of their simplicity, low cost, and ability to compare multiple samples simultaneously (27–29). These techniques have been successfully coupled with affinity purification-MS strategies for the study of protein interactions of protein complexes (15, 30–32).
Here we present a modified version of the tag team-based QTAX strategy (21) by substituting SILAC-based quantification for a label-free approach and report its application toward probing the human CSN complex interaction network. A comprehensive CSN interaction network has been generated incorporating several hundred putative interactors and providing physical linkages for the CSN complex to various important cellular pathways. This work represents the first application of the QTAX strategy for mapping interaction networks of protein complexes in mammalian systems.
EXPERIMENTAL PROCEDURES
Chemicals and Reagents
ImmunoPure streptavidin, HRP-conjugated antibody, and Super Signal West Pico chemiluminescent substrate were purchased from Pierce. Specific antibodies for REGγ and RGSHis were obtained from Invitrogen, and FLAG antibody was from Sigma. Sequencing grade trypsin was purchased from Promega Corp. (Madison, WI). Endoproteinase Lys-C was from WAKO chemicals (Osaka, Japan). All other general chemicals for buffers and culture media were from Fisher Scientific or VWR International.
Generation of HeLa Stable Cell Lines Expressing HBTH-tagged CSN Subunits
The HBTH-CSN5 plasmid was previously constructed in a former study (16). Similarly, HBTH-CSN1 and HBTH-CSN6 plasmids were generated. Briefly, human CSN1 and CSN6 cDNAs were amplified by PCR and were inserted into HBTH-pQCXIP to obtain N-terminally tagged CSN1 and CSN6. The procedure for making retrovirus and stable HeLa cell lines expressing HBTH-CSN5, HBTH-CSN1, or HBTH-CSN6 was similar as described (16, 33). A control HeLa cell line stably expressing HTBH tag alone was also generated.
SDS-PAGE and Immunoblotting Analysis
Protein samples were first separated by SDS-PAGE, transferred to a PVDF membrane, and analyzed by immunoblotting. HBTH-tagged proteins were detected using a specific antibody against RGS His or a streptavidin-HRP conjugate. FLAG-tagged proteins were detected using FLAG antibody, and endogenous REGγ was detected using its specific antibody with dilutions according to the manufacturer's instructions.
Analysis of the CSN Interactors by the QTAX Strategy
QTAX experiments were performed similarly as described (18, 21, 22). Briefly, HeLaHBTH-CSN1, HeLaHBTH-CSN5, and HeLaHBTH-CSN6 cells were grown to confluence in Dulbecco's modified Eagle's medium containing 10% FBS, 1% penicillin/streptomycin, and 1 μm biotin. The cells were trypsinized, washed three times with PBS buffer, and then resuspended in 50 ml of PBS, and formaldehyde was added at a final concentration of 1% to allow cross-linking for 10 min at room temperature. Glycine (final concentration, 0.125 m) was added to the cells to stop the cross-linking reaction. The cells were lysed in urea denaturing lysis buffer (8 m urea, 300 mm NaCl, 50 mm phosphate, 0.5% Nonidet P-40, 1 mm PMSF, 20 mm imidazole, pH 8.0). The cleared lysates were subjected to HB tag-based tandem affinity purification by first binding to Ni2+-Sepharose beads and then streptavidin resins as described (18, 20). Bound proteins on streptavidin beads were digested by 2% trypsin (w/v) in 25 mm NH4HCO3 overnight. The digests were extracted by 25% ACN, 0.1% formic acid and submitted to off-line strong cation exchange chromatography prior to LC-MS/MS analysis (22). Desalted strong cation exchange fractions were analyzed by LC-MS/MS using an LTQ-Orbitrap XL MS (Thermo Scientific, San Jose, CA) with on-line Eksigent NanoLC system (Eksigent, Dublin, CA) as described (16, 22). Two biological replicates were collected for each bait-specific QTAX experiment. The control QTAX experiment using HeLaHTBH cells was performed similarly.
Database Searching for Protein Identification
Monoisotopic masses of parent ions and corresponding fragment ions, parent ion charge states, and ion intensities from LC-MS/MS spectra were extracted using in-house software based on the Raw_Extract script from Xcalibur v2.4. The data were searched using the Batch-Tag within the developmental version (v 5.8.0) of Protein Prospector against a decoy database consisting of a normal Swissprot database concatenated with its randomized version (SwissProt.2010.03.30.random.concat with a total of 864896 protein entries). The mass accuracy for parent ions and fragment ions were set as ± 20 ppm and 0.8 Da, respectively. Trypsin was set as the enzyme, and a maximum of two missed cleavages were allowed. Protein N-terminal acetylation, methionine oxidation, and N-terminal conversion of glutamine to pyroglutamic acid were selected as variable modifications. The proteins were identified by at least two peptides with a false-positive rate of ≤0.5%. Each biological replicate for each bait purification was analyzed by MS in duplicate (i.e., two technical replicates).
Label-free Semi-Quantitative (dNSAF) Analysis
For each bait-prey pair in the biological and technical replicates, the dNSAF value was calculated as described (29). Total unique and shared peptide counts were calculated from the peptide report generated from search compare in Protein Prospector (v 5.8.0). To facilitate data processing and data analysis, we generated an in house software platform, wherein the calculation of the dNSAF was automated. Automated processing included the removal of proteins which were not identified by ≥2 unique peptides in at least one of the CSN bait purifications. The technical (MS) replicates were combined to calculate a single dNSAF for each biological replicate using the following equation:
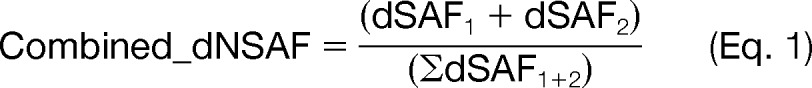 |
where dSAF1 and dSAF2 represent the distributed spectral abundance factor of the first and second technical replicate of a given biological experiment, respectively. The average of the combined_dNSAF of the two biological replicates was used as the final dNSAF value reported for a given bait-prey pair. To discriminate between specific interactions and nonspecific background, the bait purification derived dNSAF values (i.e., dNSAFBait) for identified proteins were quantitatively compared with their dNSAF values in tag-only control purifications (i.e., dNSAFControl), and the relative abundance ratio of an identified protein was calculated by dNSAFBait/dNSAFControl. These ratios have a similar meaning as SILAC ratios (LBait/HControl) obtained when the bait sample is labeled in light media and the control is labeled in heavy media (18), although the SILAC comparison is performed with both samples being analyzed in a single experiment. Therefore, in theory, identified proteins with a relative abundance ratio above 1 would be considered putative interactors. However, experimental variance does exist when samples are collected and analyzed separately. Therefore, a more practical threshold for clarifying specific versus nonspecific interactors needs to take into consideration the experimental variability between two repeats. In this work, the experimental variance in two repeats was represented by relative protein abundance changes, which were determined by calculating the variance between dNSAF values of proteins identified in the two biological replicates. This variance was calculated as a ratio of dNSAF1/dNSAF2, where dNSAF1 and dNSAF2 represent the two biological replicates with dNSAF1 > dNSAF2. By averaging all the calculated variance dNSAF ratios of proteins for the compared biological replicates, the mean (μ) and standard deviation (σ) for each bait purification can be determined. Therefore, to distinguish putative CSN interactors, the “relative abundance ratio threshold” (θ) for each bait purification is set as follows.
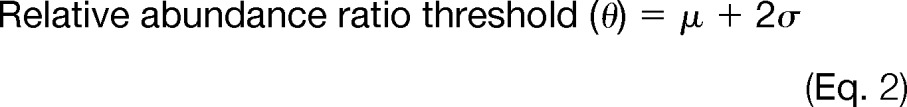 |
Proteins identified in each purification with relative abundance ratios above this threshold (i.e., dNSAFBait/dNSAFControl > θ) are considered as putative specific interactors, whereas those with ratios below (i.e., dNSAFBait/dNSAFControl < θ) are considered to be nonspecific and thus removed from final analysis.
Protein Interaction Network Mapping, Functional Annotation Analysis, Protein Complex Connectivity
The final list of putative interacting proteins was fed into an analysis pipeline that automatically extracts physical (but not genetic) interactions from BioGRID (http://thebiogrid.org/), MINT (http://mint.bio.uniroma2.it/mint/Welcome.do), and IntAct (http://www.ebi.ac.uk/intact/) using their web services. In this manner, a network of protein-protein interactions was generated. Protein-protein interaction networks were imported into and visualized by Cytoscape v2.8.1 (http://www.cytoscape.org). Protein complex networks and functional analysis were created using the protein complex identifiers and functional categories extracted from the MIPS CORUM database (34, 35).
Validation by Co-immunoprecipitation and Immunoblotting
Biochemical validation of selected identified interactors was carried out similarly as previously described (18). Briefly, validation of the interactions between CSN subunits (i.e., CSN1, CSN5, and CSN6) and CDK2 or ASNA1 was performed by transiently expressing FLAG-CDK2 or FLAG-ASNA1 in HeLa cells stably expressing a HBTH-tagged CSN subunit, i.e., HeLaHBTH-CSN1, HeLaHBTH-CSN5, and HeLaHBTH-CSN6 respectively. Reciprocal immunoprecipitation was performed using the FLAG antibody, and purified proteins were analyzed by immunoblotting with the RGSHis antibody or Streptavidin-HRP conjugate to probe the presence of HBTH tagged CSN subunits. Nontransfected HeLaHBTH-CSN1 cells were used as the purification control. To confirm the interaction with REGγ, the CSN complex was purified from HeLaHBTH-CSN1 cells under native conditions without cross-linking or denaturing conditions after in vivo cross-linking with 1% formaldehyde for 10 min as described above. Cross-linked CSN complexes were purified in a single step with streptavidin beads, which were incubated in 1× SDS-PAGE loading buffer for 6 h to reverse the cross-links prior to immunoblotting analysis using anti-REGγ antibody similarly as described (21). It is noted that the cross-links in cell lysates were not reversed when they were loaded for immunoblotting analysis. Similar purification was also carried out using HeLaHTBH tag alone cells as the control.
RESULTS
Purification and Identification of the CSN Complex and Its Interacting Proteins Using the QTAX Strategy
To investigate and obtain a comprehensive interaction network of the CSN complex in mammalian cells, we have employed a tag team-based QTAX approach (21) as illustrated in Fig. 1. The HB tag is key for QTAX experiments because it allows tandem affinity purification of in vivo cross-linked protein complexes under fully denaturing conditions (18, 20). Previously, we successfully utilized a version of the HB tag for efficient purification of the human CSN complex from HEK 293 cells under native conditions using HBTH-CSN5 as the bait (16). In the present work, three HeLa stable cell lines expressing HBTH-tagged CSN1, CSN5, or CSN6 were successfully generated with sufficient expression for effective isolation of the functional CSN complex by single-step purification under native conditions as previously described (16). These cell lines have been used for the following QTAX experiments.
Fig. 1.
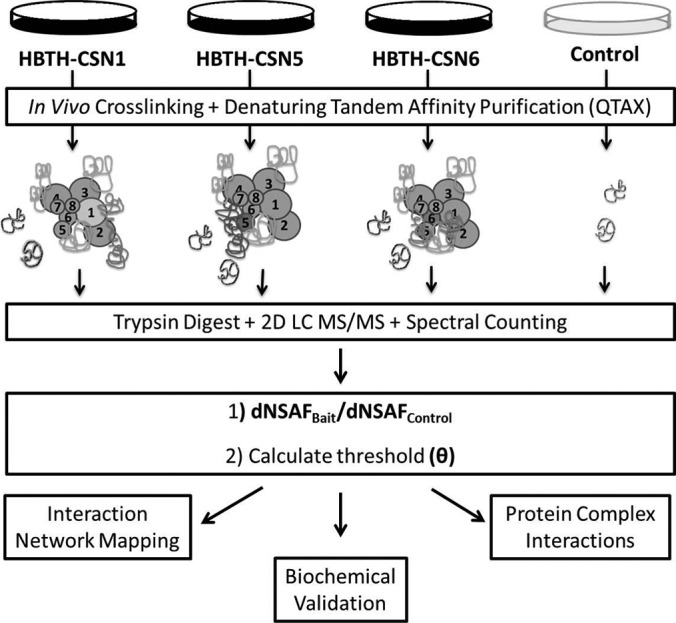
The integrated work flow for capturing, identifying, and validating the CSN interaction network using a label-free tag team-based QTAX approach coupled with biochemical validation and protein network analysis.
As depicted in Fig. 1, in vivo formaldehyde cross-linking was applied to freeze protein-protein interactions in living cells and to allow the capture of CSN-interacting proteins of all natures during purification. To achieve the best cross-linking efficiency, optimization of formaldehyde cross-linking in HeLaHBTH-CSN cells was carried out using various concentrations of formaldehyde and cross-linking time and then evaluated by immunoblotting analysis as previously described (supplemental Fig. 1) (18). It appears that the optimal in vivo cross-linking condition (1% formaldehyde for 10 min) in mammalian cells is very similar to formaldehyde cross-linking conditions in yeast cells (18, 21, 22). Following cell lysis, HB tag-based tandem affinity purification was performed to isolate in vivo cross-linked CSN complexes, and purified proteins were subsequently digested with trypsin and subjected to two-dimensional LC-MS/MS analysis for protein identification. In this work, bait-specific QTAX experiments were repeated once, and samples from each QTAX experiment were analyzed at least twice by LC-MS/MS, thus generating two true biological replicates for each bait with each of them having at least two technical replicates. With the QTAX strategy, all of the eight CSN subunits have been successfully captured and identified using the selected baits. In total, 1306 nonredundant proteins were identified, including 1231, 788, and 797 proteins from CSN1, CSN5, and CSN6 QTAX experiments, respectively (supplemental Table 1).
Identification of Specific CSN-interacting Proteins by a Label-free Based Quantitative MS Approach
To expand the application of the QTAX approach, as well as to determine putative CSN-interacting proteins, we have integrated QTAX with a label-free quantification strategy based on spectral counting developed by Washburn and co-workers (28, 29). This semi-quantitative “label-free” approach makes use of the quantitative information stored in MS/MS data as spectral counts and essentially converts peptide counts into a normalized value, the dNSAF, for subsequent quantitation. In comparison to other label-free approaches, the dNSAF method effectively incorporates several factors that affect spectral counting based quantitation including protein length, shared peptides among homologous proteins, and total spectral counts within a LC-MS/MS experiment, thus yielding a better representation of protein abundance for quantitative comparison. This method has proven successful for quantifying affinity-purified samples and for determining the stoichiometry of protein complexes (36–38). As detailed in the experimental procedures, dNSAFs of identified proteins were calculated for each QTAX experiment, and the data was compiled in one master table for all data sets using an in-house script (supplemental Table 1).
We first calculated the dNSAF values of CSN subunits and evaluated them by comparing the relative abundance of the CSN complex in each bait-specific QTAX experiment. As indicated in Fig. 2A, the relative abundance profile of CSN subunits (excluding the baits) is similar in each QTAX experiment. This is expected because cross-linking and purification efficiency of the CSN complex should be comparable regardless of the bait. These results suggest that the dNSAF is suitable for the quantitative comparison of QTAX experiments. Notably, both CSN1 and CSN5 have a marked increase in relative abundance in their respective bait purifications, whereas CSN6 does not. This suggests that more “free” CSN1 and CSN5 may be present in HeLaHBTH-CSN1 and HeLaHBTH-CSN5 cells, respectively. However, it should be noted that both HBTH-CSN1 and HBTH-CSN5 have higher expression levels in the stable cell lines, which could be attributed to their higher abundance in the purified samples compared with other subunits.
Fig. 2.

Comparison of the CSN complex subunits and CSN-interacting proteins. A, comparison of the relative abundance of CSN subunits from three QTAX experiments using HBTH-CSN1, HBTH-CSN5, and HBTH-CSN6 as bait, respectively. B, Venn diagram detailing the breakdown of the bait-specific and shared putative CSN-interacting proteins.
Although tandem affinity purification under fully denaturing conditions can drastically reduce purification background, it is expected that some nonspecific binding will remain because of the inherent nature of bead-based purification methods (18, 21, 22). Thus, to distinguish specific CSN-interacting proteins from purification background, we have carried out the control QTAX experiment using HeLa cells stably expressing only the HTBH tag. To determine whether the identified proteins are CSN interactors, we first calculated their relative abundance ratios using the dNSAFs obtained in the bait and the control samples (i.e., dNSAFBait/dNSAFControl) (Fig. 1). To distinguish specific interactions, we have set the relative abundance ratio threshold (θ) as the mean of the experimental variance of biological replicates plus two standard deviations (Equation 2) (see “Experimental Procedures”), thus allowing us to be reasonably certain that a putative interactor is selectively enriched in the bait purification because of specific binding to the CSN complex, not as a result of experimental variation. Thus, we have obtained a unique threshold for each bait purification (θCsn1 = 6.47; θCsn5 = 4.38; θCsn6 = 4.13), and selected the most stringent threshold (θMax = 6.47) for analysis of the entire data set such that we can obtain higher confidence results. As a result, 825 proteins have been determined as putative specific interactors with their relative abundance ratios above the threshold (θMax) in at least one of the bait purifications (supplemental Table 2).
Compared with previous reports studying CSN-interacting proteins purified under native conditions that were able to identify 79 specific interactors (15–17), our identification of 825 putative CSN-interacting proteins represents another significant leap forward for the field. Of the 825 putative interactors, 755 were identified from CSN1, 404 from CSN5, and 416 from CSN6 purifications (Fig. 2B). Among them, 270 proteins were identified by all three baits and are considered as core interactions, including known CSN interactors such as five cullins (CUL1, CUL2, CUL3, CUL4A, and CUL4B), as well as 11 known CRL adaptor proteins (supplemental Table 2). In addition, 210 proteins were co-purified with two CSN baits (Fig. 2B), with 97 identified by CSN1 and CSN5, 94 identified by CSN1 and CSN6, and 19 identified by CSN5 and CSN6. Moreover, 345 proteins were identified as bait specific, and 85% of them were captured by CSN1 QTAX experiments alone, which include a wide range of known interactors such as CRL components, ubiquitin protein ligases, hydrolases, and conjugating enzymes. Given the amount and scope of interactions captured by CSN1, it appears to be the most inclusive bait for mapping the CSN interaction network by QTAX.
Validation of Selected CSN-interacting Proteins
To validate the identified interactions, we have selected three putative CSN-interacting proteins, CDK2, ASNA1, and REGγ, for further confirmation by biochemical methods. Both CDK2 and ASNA1 are putative interactors to the CSN1 QTAX experiments, whereas REGγ is captured by all three baits but has the highest abundance in CSN1 purified samples. CDK2 is a Ser/Thr protein kinase important for progression through the eukaryotic cell cycle and for DNA damage response (39, 40), and ASNA1 is an arsenite-stimulated ATPase that functions in the transport of tail-anchored transmembrane proteins to the endoplasmic reticulum (41). To validate their specific interactions with the CSN complex, we performed reciprocal immunoprecipitation using FLAG-CDK2 or FLAG-ASNA1 expressed in HeLaHBTH-CSN1, HeLaHBTH-CSN5, and HeLaHBTH-CSN6 cells, respectively. As shown in Figure 3, both CDK2 and ASNA1 co-purify with HBTH-CSN1 but not with HBTH-CSN5 or HBTH-CSN6 as indicated by immunoblotting analysis of the FLAG-CDK2 and FLAG-ASNA1 immunoprecipitates. This further corroborates the mass spectrometry results, confirming the specificity of their interactions with CSN1. Furthermore, these reciprocal co-immunoprecipitations were performed under native conditions, suggesting that their interactions with CSN are relatively stable.
Fig. 3.
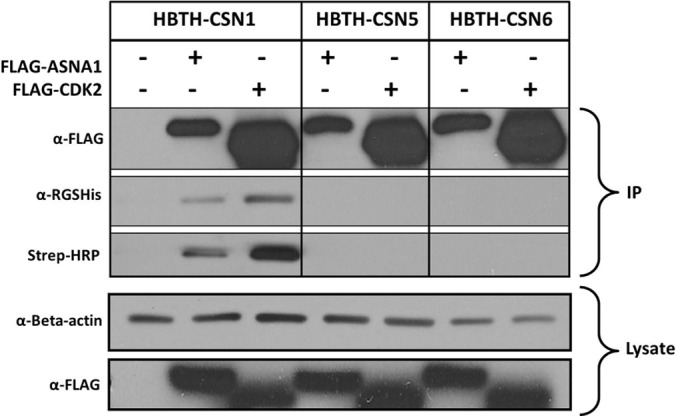
Validation of selected CSN interactors by reciprocal co-immunoprecipitation and immunoblotting. HeLaHTBH-CSN1, HeLaHBTH-CSN5, and HeLaHBTH-CSN6 cells were transfected with either FLAG-ASNA1 or FLAG-CDK2 plasmids as indicated. The top three panels show immunoprecipitations of the FLAG-tagged proteins from the indicated cell lines under native conditions. FLAG-ASNA1 or FLAG-CDK2 was probed with α-FLAG antibody, and HTBH-tagged CSN1, CSN5, and CSN6 were probed with α-RGSHis and Streptavidin-HRP conjugate (Strep-HRP), respectively. The bottom two panels show immunoblots of cell lysates probing with α-β-actin as the loading control and α-FLAG for examining expression of transfected FLAG-tagged proteins, respectively. IP, immunoprecipitation.
REGγ is a proteasome regulator that can activate 20 S proteasomes for protein degradation (42). To validate its interaction with the CSN complex, we first tried to probe for co-purification of endogenous REGγ with the CSN complex purified from HeLaHBTH-CSN1 cells under native conditions. In contrast to CDK2 and ASNA1, REGγ did not co-purify with CSN1 under native conditions (Fig. 4). Because REGγ was captured and identified using the QTAX approach, we suspected that its interaction with CSN1 is likely transient or weak in nature and requires cross-linking for effective capture. Thus, we carried out the QTAX experiment using HBTH-CSN1 as the bait and confirmed the co-purification of REGγ with the CSN complex by immunoblotting analysis (Fig. 4). Although it is known that the CSN complex is involved in modulating both the cell cycle and ubiquitin proteasome degradation pathways, to the best of our knowledge, this is the first direct physical evidence linking the CSN complex to either CDK2 or REGγ. Furthermore, confirmation of the CSN interaction with ASNA1, an ER protein, suggests CSN may be involved in membrane-associated processes. Taken together, these results further support the selected interactions identified by label-free QTAX.
Fig. 4.
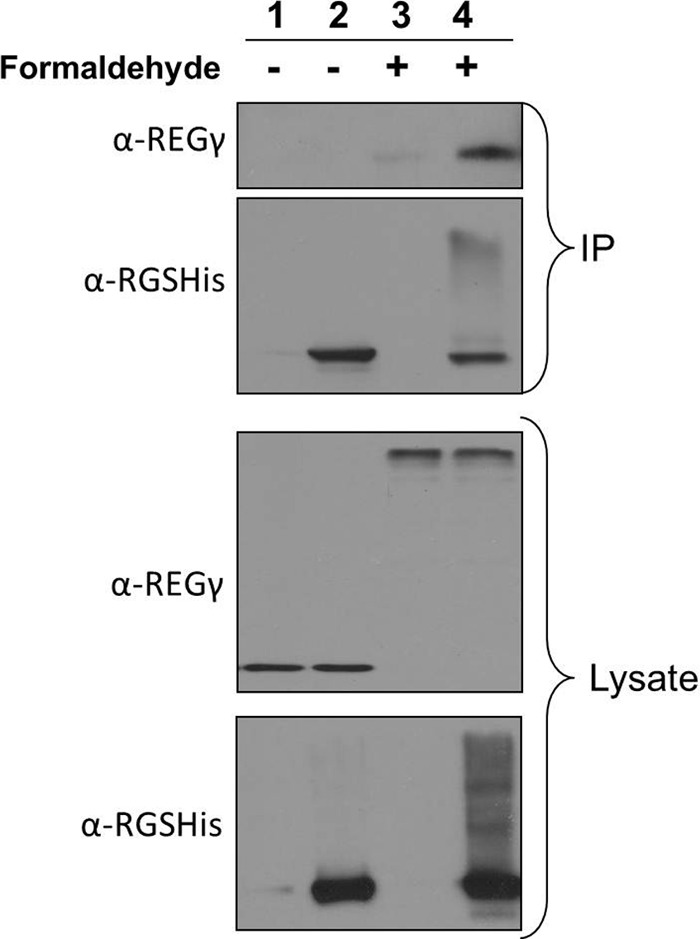
Validation of REGγ interaction with CSN by QTAX strategy and immunoblotting. Lanes 1 and 2 represent purification without cross-linking under native conditions, whereas lanes 3 and 4 illustrate purification after in vivo formaldehyde cross-linking under denaturing conditions. The samples were purified from either HeLaHBTH-CSN1 (lanes 2 and 4) or HeLaHTBH control cells (lanes 1 and 3). α-RGSHis was used to probe HBTH-CSN1 and endogenous REGr was probed using α-REGγ antibody. The top two panels are purified samples, and the bottom two panels are lysates. IP, immunoprecipitation.
Protein Interaction Network Analysis
In our previous studies (21, 22), we have shown that protein-protein interaction network analysis can be effectively used as an alternative method for validating QTAX-derived protein interactions and can provide a better understanding of the nature of the identified interactions. To generate the CSN complex protein interaction network, we extracted annotated physical interactions from multiple public databases between and among the CSN subunits and their putative interacting proteins (BioGRID, MINT, IntAct). Approximately 41% of identified CSN interactors have been mapped to the CSN interaction network either directly or indirectly totaling 649 interactions among 338 proteins. The remaining interactors (i.e., 487 proteins) have no annotated physical connection to the CSN interaction network and are considered as novel putative CSN interactors. A detailed view of CSN complex interaction network map is shown in supplemental Fig. 2. As shown, a substantial proportion (37.3%) of the interaction network consists of the core interactions captured by all three baits (brown nodes).
In cells, most functions and processes are carried out by protein complexes rather than individual proteins. How a protein complex interacts with other protein complexes can be as important to understanding cellular biology as understanding how individual proteins interact. Therefore, to characterize protein complexes that associate with the CSN complex, we have grouped the identified CSN-interacting proteins into known protein complexes based on the MIPS core protein complex database and mapped the interconnectivity between these complexes and the CSN complex by protein network analysis (Fig. 5). In this analysis, only protein complexes that are composed of a minimum of five subunits with at least 25% of the complex identified are presented in Fig. 5A. In the resulting protein complex interaction map, edges indicate known interactions between two or more subunits of the two connected protein complexes. Each protein complex is represented by a pie chart that indicates the occupancy of the complex (proportion of proteins captured by QTAX experiments over the total proteins which make up the complex), as well as the size of the holocomplex with larger nodes indicating a greater number of proteins make up the complex. Aside from the CSN complex, 146 CSN interactors were grouped into 81 protein complexes (supplemental Table 3). A significant proportion of the protein complexes are identified by shared components, meaning that the protein complexes are not identified in our data by unique subunits. Therefore, we have clustered these protein complexes into protein complex groups. As a result, we have clustered 57 individual protein complexes into 14 protein complex groups and characterized an additional 24 individual protein complexes, which could be identified in our data set with at least one unique subunit. As shown in Fig. 5A, each protein complex group is represented either by the complex containing the highest number of unique subunits or by the complex with the highest occupancy. Among the 38 protein complex groups, three were captured in full, whereas the remaining 35 have 25–92% of their total subunits captured (supplemental Table 3). As shown in Fig. 5A, there are two identified protein complex groups (i.e., CUL1-containing E3 ligases and CUL4A-containing E3 ligases) with at least one subunit directly interacting with one of the CSN subunits, which we consider to be the first layer of interactors. An additional three protein complexes have been shown to interact with the first layer interactors and are consequently considered to be second layer interactors. Similarly, we have identified three third layer interactions, four fourth layer interactions, a single fifth layer interaction, and a single sixth layer interaction, with an additional 24 isolated complexes that we consider to be novel.
Fig. 5.

Interaction network and functional annotations of the CSN-interacting protein complexes. A, protein complex identifiers were extracted from the MIPS CORUM web service, and interconnectivity of the identified complexes was mapped by protein-protein interaction network analysis (see “Experimental Procedures” for details). Each protein complex (or protein complex group) is represented by a single node with the identification number indicated in the center, which corresponds to the identification in supplemental Table 3. Protein complex occupancy and relative size are indicated by the incorporated pie chart and node size, respectively. Color indicates proximity to the CSN (purple complex 2174), with bright pink indicating direct interaction, and gray indicating no connection to the CSN. B, MIPS functional categories were extracted for each protein complex; shown is the plot of the frequency (number of protein complexes annotated with the specific function) of each category.
To further classify the CSN-associated protein complexes and assign novel functions related to the CSN complex, we extracted functional annotations for protein complexes from the MIPS functional catalogue (43) (http://mips.helmholtz-muenchen.de/genre/proj/corum/browsefuncats.html). Fig. 5B displays the identified functional annotations represented in our list of captured protein complexes. Among the top functional annotations associated with the captured protein complexes are protein fate and cell cycle and DNA processing.
DISCUSSION
In this work, we successfully incorporated a label-free quantitation method with the tag team-based QTAX strategy to facilitate the comprehensive mapping of human CSN complex interaction networks. We have previously highlighted the effectiveness of the QTAX approach in the characterization of interaction networks of protein complexes in yeast (18, 21–23); here we further establish its utility and extend its application to the study of mammalian protein complexes. This work successfully demonstrates the feasibility of dNSAF-based label-free quantitation (29) as an alternative to the SILAC-based quantitative method for QTAX analysis. Although label-free quantitation is not as accurate, it offers more flexibility than SILAC-based methods because it allows for the simultaneous comparison of multiple samples. This advantage can be exploited by multiple purification strategies, specifically those that utilize a tag team approach or collect multiple samples under different biological conditions. Furthermore, with label-free QTAX experiments, there exists less sample complexity during LC-MS/MS analysis, and therefore identification of low abundance proteins may be enhanced, further improving the coverage of captured protein interaction networks. As previously demonstrated (21), the tag team strategy offers unique advantages in that it provides a more extensive profile of the interaction network of the protein complexes and also delivers an overall outlook of the “core” and bait-specific interactions for a given protein complex. Together, this new integrated proteomic platform provides the combined benefits of QTAX, label-free quantification, and multiple-bait purification strategies.
To define specific interactions from purification background, we compared CSN bait and control QTAX experiments using dNSAF-derived relative abundance ratios, effectively characterizing 825 putative CSN-interacting proteins. Among all of the identified putative CSN interactors, we identified a subset of 270 core interactions that are captured by all three baits. Interestingly, 126 of these core interacting proteins were mapped to the CSN interaction network, whereas 144 are novel interactors. Furthermore, 11 of the core interactors, as well as an additional 31 putative bait-specific CSN-interacting proteins, are known CRL components and represent six types of CRLs. These proteins included the six major cullin proteins (CUL1, 2, 3, 4A, 4B, and 5), 12 E3 ubiquitin ligase proteins, RBX1, DDB1, DDB2, DDA1, and 24 additional DCAF, F-box, BTB-domain containing, SOCS box, and CRL adaptor proteins. These results are similar to previous reports that used native affinity purification-MS to capture CSN interactions (15–17). The capture of these CRL components is expected because the cullin proteins are the best known CSN substrates for deneddylation. In addition, Nedd8 was identified as a putative CSN interactor, supporting the idea that the CSN complex interacts with neddylated cullins in cells (15). It should be noted that an additional handful of known CRL adaptor proteins were captured in this analysis but did not pass the quantitative dNSAF ratio threshold in any bait purification because of low abundance (supplemental Table 1). This suggests that some true positives may be discarded in the attempt to eliminate false positives during this type of analysis.
Protein-protein interaction network analysis has generated a detailed CSN interaction network based on known human protein interactions, as well as provided the construction of a protein complex interaction network that mapped the interconnectivity of the 38 identified MIPS protein complexes. These complexes are involved in various biological processes, with most having annotated functions in subcellular localization, cell cycle and DNA processing, protein fate, transcription, protein with binding function, and biogenesis of cellular components (Fig. 4B). Based on these results, we suspect that the CSN complex may be involved in the regulation and integration of various cellular pathways through its interaction with these complexes. For example, it is possible for the CSN complex to modulate cell cycle and protein fate through its interactions with CRLs, which are in turn responsible for ubiquitinating cell cycle regulators and transcription factors prior to their degradation by the 26 S proteasome (12). In addition to E3 ubiquitin ligases, several subunits of the 26 S proteasome and eukaryotic translation initiation factor 3 (eIF3) complexes have been captured as core interactions, suggesting their stable interactions with the CSN complex. This correlates well with the current understanding of these three complexes because they are shown to be intimately related (44–47). Studies have shown the CSN complex has high structure homology with both the 26 S proteasome lid and eIF3 complexes (45, 48, 49). However, despite shared homology domains and similar overall structures, the functions of these three complexes are significantly different. The 26 S proteasome is a multicatalytic proteinase responsible for the degradation of ubiquitinated substrates (50), and the eIF3 complex is involved in both ribosome biogenesis and protein synthesis in eukaryotes and functions as a docking site for assembling other eIFs during translation initiation (51). Although the biological significance of their interactions requires further investigation, it has been suggested that the CSN may modulate eIF3 complex function through proteasome degradation given that recent evidence has shown that eIF3e is degraded by the proteasome in a CSN-dependent fashion, and excess of eIF3e can inhibit translation (52). Although it remains unclear how the CSN interacts with the proteasome complex in vivo, it has been speculated that the CSN could act as an alternative lid or platform, bringing specific populations of ubiquitin ligases to the 26 S proteasome (45). Apart from the ubiquitin ligases and proteasome complexes, multiple components involved in the ubiquitin-proteasome system have also been identified as putative CSN-interacting proteins in our analysis including REGγ, Rad23B, and Ecm29. These proteins are key players in the ubiquitin proteasome system (53). Together, these results provide new molecular links between CSN and the ubiquitin-proteasome system, suggesting that CSN may serve more than just a deneddylase in the proteasomal degradation pathway.
In addition to protein degradation, we have identified several protein complexes with functions pertaining to transcriptional control including the H2AX complex, the MTA2 complex, and the BRM-SIN3A-histone deacetylase complex. These complexes associate with histones and are involved in histone deacetylation (supplemental Table 3). To the best of our knowledge, this is the first report showing evidence for a physical interaction between this specialized function and the CSN complex.
In summary, the tag team-based QTAX approach combined with label-free quantitative MS has provided significant and extensive proteomic analysis of human CSN interaction networks. Novel CSN interactions between individual proteins and protein complexes have been identified. Although the biological significance of most of these interactions remains to be explored, our work represents a key step toward full understanding of the biological roles of the CSN in various cellular pathways. Furthermore, the strategy presented here can be utilized to study in vivo protein interaction networks of other protein complexes in both yeast and mammalian systems.
Acknowledgments
We thank Prof. A. L. Burlingame, Peter Baker, Larry Schweitzer, and Robert Chalkley for the use of Protein Prospector and members of the Huang laboratory for help during this study. We thank Dr. Hidde L. Ploegh at MIT for FLAG-ASNA1 plasmid and Dr. Hung-Ying Kao from Case Western Reserve University for FLAG-CDK2 plasmid.
Footnotes
* This work was supported by National Institutes of Health Grant GMRO1074830-06A1 (to L. H.), Biomedical Informatics Training Program Grant 5T15LM007443-10 (to P. B.), and a predoctoral fellowship (to R. K.). The costs of publication of this article were defrayed in part by the payment of page charges. This article must therefore be hereby marked “advertisement” in accordance with 18 U.S.C. Section 1734 solely to indicate this fact.
 This article contains supplemental material.
1 The abbreviations used are:
- CSN
- COP9 signalosome
- HB
- histidine-biotin tag
- HBTH
- histidine-biotin-TEV-histidine tag
- SILAC
- stable isotope labeling of amino acids in cell culture
- dNSAF
- distributed normalized spectral abundance factor
- CRL
- cullin-ring E3 ligase
- eIF3
- eukaryotic translation initiation factor 3
- MIP5
- CORUM, Munich Information Center the Comprehensive Resource of Mammalian Protein Complexes.
REFERENCES
- 1. Wei N., Deng X. W. (2003) The Cop9 signalosome. Annu. Rev. Cell Dev. Biol. 19, 261–286 [DOI] [PubMed] [Google Scholar]
- 2. Wei N., Serino G., Deng X. W. (2008) The Cop9 signalosome: More than a protease. Trends Biochem. Sci 33, 592–600 [DOI] [PubMed] [Google Scholar]
- 3. Zhang X. C., Chen J., Su C. H., Yang H. Y., Lee M. H. (2008) Roles for Csn5 in control of P53/Mdm2 activities. J. Cell. Biochem. 103, 1219–1230 [DOI] [PubMed] [Google Scholar]
- 4. Richardson K. S., Zundel W. (2005) The emerging role of the Cop9 signalosome in cancer. Mol. Cancer Res. 3, 645–653 [DOI] [PMC free article] [PubMed] [Google Scholar]
- 5. Adler A. S., Littlepage L. E., Lin M., Kawahara T. L., Wong D. J., Werb Z., Chang H. Y. (2008) Csn5 isopeptidase activity links Cop9 signalosome activation to breast cancer progression. Cancer Res. 68, 506–515 [DOI] [PMC free article] [PubMed] [Google Scholar]
- 6. Braumann C., Tangermann J., Jacobi C. A., Müller J. M., Dubiel W. (2008) Novel anti-angiogenic compounds for application in tumor therapy: Cop9 signalosome-associated kinases as possible targets. Mini. Rev. Med. Chem. 8, 421–428 [DOI] [PubMed] [Google Scholar]
- 7. Uhle S., Medalia O., Waldron R., Dumdey R., Henklein P., Bech-Otschir D., Huang X., Berse M., Sperling J., Schade R., Dubiel W. (2003) Protein kinase Ck2 and protein kinase D are associated with the Cop9 signalosome. EMBO J. 22, 1302–1312 [DOI] [PMC free article] [PubMed] [Google Scholar]
- 8. Hetfeld B. K., Helfrich A., Kapelari B., Scheel H., Hofmann K., Guterman A., Glickman M., Schade R., Kloetzel P. M., Dubiel W. (2005) The zinc finger of the Csn-associated deubiquitinating enzyme Usp15 is essential to rescue the E3 ligase Rbx1. Curr. Biol. 15, 1217–1221 [DOI] [PubMed] [Google Scholar]
- 9. Cope G. A., Suh G. S., Aravind L., Schwarz S. E., Zipursky S. L., Koonin E. V., Deshaies R. J. (2002) Role of predicted metalloprotease motif of Jab1/Csn5 in cleavage of Nedd8 from Cul1. Science 298, 608–611 [DOI] [PubMed] [Google Scholar]
- 10. Pan Z. Q., Kentsis A., Dias D. C., Yamoah K., Wu K. (2004) Nedd8 on cullin: building an expressway to protein destruction. Oncogene 23, 1985–1997 [DOI] [PubMed] [Google Scholar]
- 11. Petroski M. D., Deshaies R. J. (2005) Function and regulation of cullin-ring ubiquitin ligases. Nat. Rev. Mol. Cell Biol. 6, 9–20 [DOI] [PubMed] [Google Scholar]
- 12. Deshaies R. J., Joazeiro C. A. (2009) Ring domain E3 ubiquitin ligases. Annu. Rev. Biochem. 78, 399–434 [DOI] [PubMed] [Google Scholar]
- 13. Cope G. A., Deshaies R. J. (2003) Cop9 signalosome: A multifunctional regulator of Scf and other cullin-based ubiquitin ligases. Cell 114, 663–671 [DOI] [PubMed] [Google Scholar]
- 14. Wolf D. A., Zhou C., Wee S. (2003) The Cop9 signalosome: An assembly and maintenance platform for cullin ubiquitin ligases? Nat. Cell Biol. 5, 1029–1033 [DOI] [PubMed] [Google Scholar]
- 15. Bennett E. J., Rush J., Gygi S. P., Harper J. W. (2010) Dynamics of cullin-ring ubiquitin ligase network revealed by systematic quantitative proteomics. Cell 143, 951–965 [DOI] [PMC free article] [PubMed] [Google Scholar]
- 16. Fang L., Wang X., Yamoah K., Chen P. L., Pan Z. Q., Huang L. (2008) Characterization of the human Cop9 signalosome complex using affinity purification and mass spectrometry. J. Proteome Res. 7, 4914–4925 [DOI] [PMC free article] [PubMed] [Google Scholar]
- 17. Olma M. H., Roy M., Le Bihan T., Sumara I., Maerki S., Larsen B., Quadroni M., Peter M., Tyers M., Pintard L. (2009) An interaction network of the mammalian Cop9 signalosome identifies Dda1 as a core subunit of multiple Cul4-based E3 ligases. J. Cell Sci. 122, 1035–1044 [DOI] [PMC free article] [PubMed] [Google Scholar]
- 18. Guerrero C., Tagwerker C., Kaiser P., Huang L. (2006) An integrated mass spectrometry-based proteomic approach: Quantitative analysis of tandem affinity-purified in vivo cross-linked protein complexes (Qtax) to decipher the 26 S proteasome-interacting network. Mol. Cell. Proteomics 5, 366–378 [DOI] [PubMed] [Google Scholar]
- 19. Kaake R. M., Wang X., Huang L. (2010) Profiling of protein interaction networks of protein complexes using affinity purification and quantitative mass spectrometry. Mol. Cell. Proteomics 10.1074/mcp.R110.000265 [DOI] [PMC free article] [PubMed] [Google Scholar]
- 20. Tagwerker C., Flick K., Cui M., Guerrero C., Dou Y., Auer B., Baldi P., Huang L., Kaiser P. (2006) A tandem affinity tag for two-step purification under fully denaturing conditions: Application in ubiquitin profiling and protein complex identification combined with in vivo cross-linking. Mol. Cell. Proteomics 5, 737–748 [DOI] [PubMed] [Google Scholar]
- 21. Guerrero C., Milenkovic T., Przulj N., Kaiser P., Huang L. (2008) Characterization of the proteasome interaction network using a Qtax-based tag-team strategy and protein interaction network analysis. Proc. Natl. Acad. Sci. U.S.A. 105, 13333–13338 [DOI] [PMC free article] [PubMed] [Google Scholar]
- 22. Kaake R. M., Milenković T., Przulj N., Kaiser P., Huang L. (2010) Characterization of cell cycle specific protein interaction networks of the yeast 26 S proteasome complex by the Qtax strategy. J. Proteome Res. 9, 2016–2029 [DOI] [PMC free article] [PubMed] [Google Scholar]
- 23. Aghajan M., Jonai N., Flick K., Fu F., Luo M., Cai X., Ouni I., Pierce N., Tang X., Lomenick B., Damoiseaux R., Hao R., Del Moral P. M., Verma R., Li Y., Li C., Houk K. N., Jung M. E., Zheng N., Huang L., Deshaies R. J., Kaiser P., Huang J. (2010) Chemical genetics screen for enhancers of rapamycin identifies a specific inhibitor of an Scf family E3 ubiquitin ligase. Nat. Biotechnol. 28, 738–742 [DOI] [PMC free article] [PubMed] [Google Scholar]
- 24. Mann M. (2006) Functional and quantitative proteomics using SILAC. Nat. Rev. Mol. Cell Biol. 7, 952–958 [DOI] [PubMed] [Google Scholar]
- 25. Ong S. E., Blagoev B., Kratchmarova I., Kristensen D. B., Steen H., Pandey A., Mann M. (2002) Stable isotope labeling by amino acids in cell culture, SILAC, as a simple and accurate approach to expression proteomics. Mol. Cell. Proteomics 1, 376–386 [DOI] [PubMed] [Google Scholar]
- 26. Molina H., Yang Y., Ruch T., Kim J. W., Mortensen P., Otto T., Nalli A., Tang Q. Q., Lane M. D., Chaerkady R., Pandey A. (2009) Temporal profiling of the adipocyte proteome during differentiation using a five-plex SILAC-based strategy. J. Proteome Res. 8, 48–58 [DOI] [PMC free article] [PubMed] [Google Scholar]
- 27. Gstaiger M., Aebersold R. (2009) Applying mass spectrometry-based proteomics to genetics, genomics and network biology. Nat. Rev. Genet. 10, 617–627 [DOI] [PubMed] [Google Scholar]
- 28. Florens L., Carozza M. J., Swanson S. K., Fournier M., Coleman M. K., Workman J. L., Washburn M. P. (2006) Analyzing chromatin remodeling complexes using shotgun proteomics and normalized spectral abundance factors. Methods 40, 303–311 [DOI] [PMC free article] [PubMed] [Google Scholar]
- 29. Zhang Y., Wen Z., Washburn M. P., Florens L. (2010) Refinements to label free proteome quantitation: How to deal with peptides shared by multiple proteins. Anal. Chem. 82, 2272–2281 [DOI] [PubMed] [Google Scholar]
- 30. Choi H., Larsen B., Lin Z. Y., Breitkreutz A., Mellacheruvu D., Fermin D., Qin Z. S., Tyers M., Gingras A. C., Nesvizhskii A. I. (2011) Saint: Probabilistic scoring of affinity purification-mass spectrometry data. Nat. Methods 8, 70–73 [DOI] [PMC free article] [PubMed] [Google Scholar]
- 31. Breitkreutz A., Choi H., Sharom J. R., Boucher L., Neduva V., Larsen B., Lin Z. Y., Breitkreutz B. J., Stark C., Liu G., Ahn J., Dewar-Darch D., Reguly T., Tang X., Almeida R., Qin Z. S., Pawson T., Gingras A. C., Nesvizhskii A. I., Tyers M. (2010) A global protein kinase and phosphatase interaction network in yeast. Science 328, 1043–1046 [DOI] [PMC free article] [PubMed] [Google Scholar]
- 32. Sowa M. E., Bennett E. J., Gygi S. P., Harper J. W. (2009) Defining the human deubiquitinating enzyme interaction landscape. Cell 138, 389–403 [DOI] [PMC free article] [PubMed] [Google Scholar]
- 33. Wang X., Chen C. F., Baker P. R., Chen P. L., Kaiser P., Huang L. (2007) Mass spectrometric characterization of the affinity-purified human 26 S proteasome complex. Biochemistry 46, 3553–3565 [DOI] [PubMed] [Google Scholar]
- 34. Ruepp A., Brauner B., Dunger-Kaltenbach I., Frishman G., Montrone C., Stransky M., Waegele B., Schmidt T., Doudieu O. N., Stümpflen V., Mewes H. W. (2008) Corum: The comprehensive resource of mammalian protein complexes. Nucleic Acids Res. 36, D646–D650 [DOI] [PMC free article] [PubMed] [Google Scholar]
- 35. Ruepp A., Waegele B., Lechner M., Brauner B., Dunger-Kaltenbach I., Fobo G., Frishman G., Montrone C., Mewes H. W. (2010) Corum: The comprehensive resource of mammalian protein complexes–2009. Nucleic Acids Res. 38, D497–D501 [DOI] [PMC free article] [PubMed] [Google Scholar]
- 36. Sardiu M. E., Cai Y., Jin J., Swanson S. K., Conaway R. C., Conaway J. W., Florens L., Washburn M. P. (2008) Probabilistic assembly of human protein interaction networks from label-free quantitative proteomics. Proc. Natl. Acad. Sci. U.S.A. 105, 1454–1459 [DOI] [PMC free article] [PubMed] [Google Scholar]
- 37. Sardiu M. E., Gilmore J. M., Carrozza M. J., Li B., Workman J. L., Florens L., Washburn M. P. (2009) Determining protein complex connectivity using a probabilistic deletion network derived from quantitative proteomics. PLoS One 4, e7310. [DOI] [PMC free article] [PubMed] [Google Scholar]
- 38. Mohan M., Herz H. M., Takahashi Y. H., Lin C., Lai K. C., Zhang Y., Washburn M. P., Florens L., Shilatifard A. (2010) Linking H3K79 trimethylation to Wnt signaling through a novel Dot1-containing complex (Dotcom). Genes Dev. 24, 574–589 [DOI] [PMC free article] [PubMed] [Google Scholar]
- 39. Malumbres M., Barbacid M. (2005) Mammalian cyclin-dependent kinases. Trends Biochem. Sci. 30, 630–641 [DOI] [PubMed] [Google Scholar]
- 40. Wohlbold L., Fisher R. P. (2009) Behind the wheel and under the hood: Functions of cyclin-dependent kinases in response to DNA damage. DNA Repair 8, 1018–1024 [DOI] [PMC free article] [PubMed] [Google Scholar]
- 41. Claessen J. H., Mueller B., Spooner E., Pivorunas V. L., Ploegh H. L. (2010) The transmembrane segment of a tail-anchored protein determines its degradative fate through dislocation from the endoplasmic reticulum. J. Biol. Chem. 285, 20732–20739 [DOI] [PMC free article] [PubMed] [Google Scholar]
- 42. Mao I., Liu J., Li X., Luo H. (2008) REGγ, a proteasome activator and beyond? Cell. Mol. Life Sci. 65, 3971–3980 [DOI] [PMC free article] [PubMed] [Google Scholar]
- 43. Ruepp A., Zollner A., Maier D., Albermann K., Hani J., Mokrejs M., Tetko I., Güldener U., Mannhaupt G., Münsterkötter M., Mewes H. W. (2004) The Funcat, a functional annotation scheme for systematic classification of proteins from whole genomes. Nucleic Acids Res. 32, 5539–5545 [DOI] [PMC free article] [PubMed] [Google Scholar]
- 44. Seeger M., Kraft R., Ferrell K., Bech-Otschir D., Dumdey R., Schade R., Gordon C., Naumann M., Dubiel W. (1998) A novel protein complex involved in signal transduction possessing similarities to 26 S proteasome subunits. FASEB J. 12, 469–478 [PubMed] [Google Scholar]
- 45. Huang X., Hetfeld B. K., Seifert U., Kähne T., Kloetzel P. M., Naumann M., Bech-Otschir D., Dubiel W. (2005) Consequences of Cop9 signalosome and 26 S proteasome interaction. FEBS J. 272, 3909–3917 [DOI] [PubMed] [Google Scholar]
- 46. Yahalom A., Kim T. H., Roy B., Singer R., von Arnim A. G., Chamovitz D. A. (2008) Arabidopsis eIF3e is regulated by the Cop9 signalosome and has an impact on development and protein translation. Plant J. 53, 300–311 [DOI] [PubMed] [Google Scholar]
- 47. Yen H. C., Chang E. C. (2003) Int6: A link between the proteasome and tumorigenesis. Cell Cycle 2, 81–83 [PubMed] [Google Scholar]
- 48. Li L., Deng X. W. (2003) The Cop9 signalosome: An alternative lid for the 26 S proteasome? Trends Cell Biol. 13, 507–509 [DOI] [PubMed] [Google Scholar]
- 49. Sharon M., Mao H., Boeri Erba E., Stephens E., Zheng N., Robinson C. V. (2009) Symmetrical modularity of the Cop9 signalosome complex suggests its multifunctionality. Structure 17, 31–40 [DOI] [PubMed] [Google Scholar]
- 50. Pickart C. M., Cohen R. E. (2004) Proteasomes and their kin: Proteases in the machine age. Nat. Rev. Mol. Cell Biol. 5, 177–187 [DOI] [PubMed] [Google Scholar]
- 51. Valásek L., Hasek J., Nielsen K. H., Hinnebusch A. G. (2001) Dual function of eIF3j/Hcr1p in processing 20 S pre-rRNA and translation initiation. J. Biol. Chem. 276, 43351–43360 [DOI] [PubMed] [Google Scholar]
- 52. Paz-Aviram T., Yahalom A., Chamovitz D. A. (2008) Arabidopsis eIF3e interacts with subunits of the ribosome, Cop9 signalosome and proteasome. Plant Signal Behav. 3, 409–411 [DOI] [PMC free article] [PubMed] [Google Scholar]
- 53. Finley D. (2009) Recognition and processing of ubiquitin-protein conjugates by the proteasome. Annu. Rev. Biochem. 78, 477–513 [DOI] [PMC free article] [PubMed] [Google Scholar]