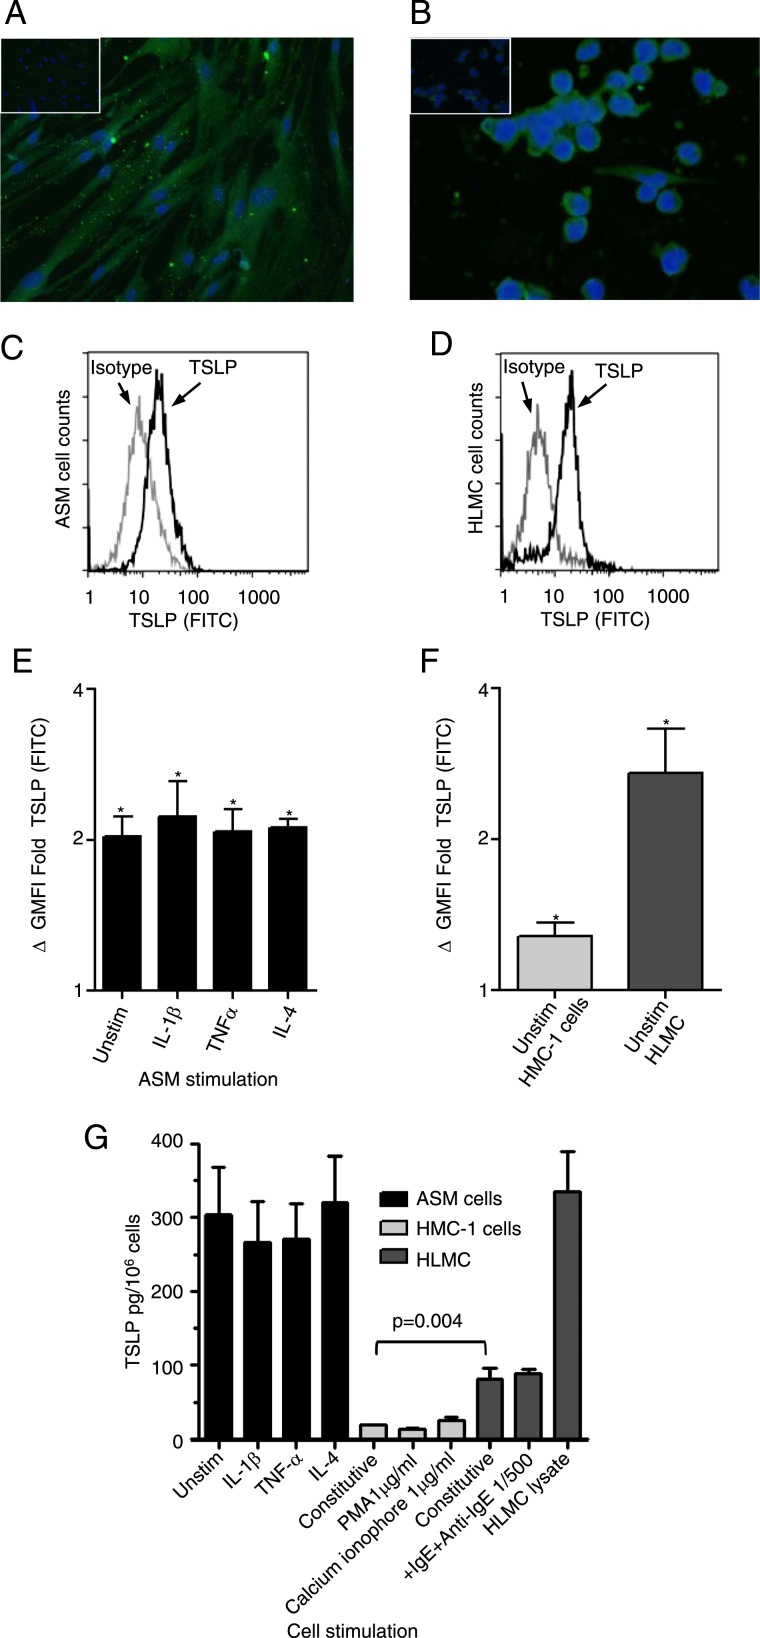
Figure 2.
TSLP expressed by ex vivo ASM and mast cells. A, B, TSLP expression was confirmed in (A) ASM and (B) HMC-1 cells by immunofluorescence (nuclei stained blue, TSLP stained green, isotype shown as insert, magnification × 400, n = 3). C, D, The example fluorescent histograms for (C) ASM and (D) HLMC cells represent populations of TSLP (black line) plotted with the corresponding isotype control (gray line). E, The expression of intracellular TSLP was investigated by flow cytometry on unstimulated and stimulated ASM cells with 10 ng/mL proinflammatory cytokines IL-1β, TNFα, and IL-4 over 20 h (n = 8; *P < .05 compared with isotype control). F, Expression was also seen in unstimulated mast cells (n = 3-5; *P < .05 compared with isotype control). G, TSLP protein release was measured by enzyme-linked immunosorbent assay (ELISA) in ASM (n = 8-11, unstimulated and stimulated for 20 h), HMC-1 (n = 4), and HLMC (n = 3-5) supernatants (and lysate for HLMC). HMC-1 cell protein release was studied in cell supernatants following PMA stimulation with 1 μg/mL or calcium ionophore 1 μg/mL over 24 h and HLMC IgE sensitized (2.4 μg/mL) and then activated with anti-IgE (1:500) for 1 h. All data presented as mean ± SEM. Statistical differences were assessed using the t tests, and P values are as shown FITC = fluorescein isothiocyanate; GMFI = geometric mean fluorescence intensity; HLMC = human lung mast cell; HMC-1 = human mastocytoma cell line; PMA = phorbol myristate acetate; TNF = tumor necrosis factor; Unstim = unstimulated. See Figure 1 legend for expansion of other abbreviations.

