Abstract
Computer simulations are an attractive means by which to probe the self-assembly and molecular level organization of lipids in biological membranes. In this work, we study a simple skin lipid system to demonstrate the ability of the coarse-grained models used for fatty acids, cholesterol, and water to self-assemble, thus validating the models for use in further studies of the complex lipid mixtures found in the outermost layer of the skin. Specifically, the ability of the models to predict the correct self-assembled structures from molecular dynamics simulations is compared against those seen experimentally and from all-atom simulations of preassembled bilayers. The nature of the molecular interactions and their roles in the self-assembly process is elucidated and heuristics for self-assembly established. Additionally, the coarse-grained models have been used to characterize the effect of varying cholesterol composition on bilayer properties and the mechanism of bilayer destabilization by short and long chain fatty acids in the presence of cholesterol.
Keywords: Self-assembly, fatty acids, cholesterol, water, bilayer, molecular dynamics
1. Introduction
The skin barrier plays an essential role in human physiology by preventing water loss from the body and providing protection from external physical, chemical and biological attack1. The barrier function of the skin is believed to be localized to the stratum corneum, which is composed of dead skin cells embedded in a lipid-rich environment. The lipids of the stratum corneum consist mainly of ceramides, cholesterol and free fatty acids, with small proportions of cholesterol sulfate and cholesteryl esters.2 The lipid mixture is biologically unusual in that it does not contain any phospholipids, which are the major components of most biological membranes. While much is known about the nature of the skin lipids and the minimum number and type of lipids needed to achieve self-assembly into the structures seen in native skin,3–6 a clear understanding of how and why these molecules assemble into the structures observed through microscopy and biophysical measurements does not yet exist.
Several models of skin lipid organization have been proposed in the literature based on experimental observations;7 however, the molecular-level arrangement of the lipids cannot be elucidated experimentally and several different proposed organizations equally support the experimental data.7 Computer simulation is therefore ideally suited to differentiate between the proposed models and probe the molecular arrangement of the skin lipids. Molecular dynamics simulations, in particular, have been widely used to study biological membranes (see for example [8–11]). However, the time scale on which self-assembly takes place in mixed lipid systems is typically beyond the reach of detailed atomistic simulations, resulting in the need for coarse-grained (CG) models.12–19 In a CG model, groups of atoms are represented by single sites (or beads) in order to drastically reduce the degrees of freedom in the simulation and enable the modeling of larger system sizes over longer time scales. Although the specific details of developing a CG potential or force field vary, in all cases, the CG interactions must be optimized against target data in order to reproduce desired properties or phenomena. This can be experimental data, such as in the development of the Martini force field18, 19 for which the model parameters are chosen to reproduce free energies of solvation or phase changes, or atomistic simulation data, which is typically used in the development of center of mass based numerical coarse-grained potentials that can be optimized through methods such as force-matching,20 inverse Monte Carlo,21 or iterative-Boltzmann inversion.22, 23 For an overview of CG model development and its application to biological self-assembly the reader is directed to several excellent reviews.17, 24–26
In previous work, we successfully utilized the iterative-Boltzmann inversion (IBI) method as implemented by Reith, Pütz, and Müller-Plathe,22, 23 to develop amorphous and crystalline potentials for two key stratum corneum lipids; saturated fatty acids ranging from 16 to 30 carbons in length27 and cholesterol.28 In addition, a CG water model29 was developed that dynamically maps four water molecules to each CG bead. This was uniquely achieved through the combination of the IBI method and the k-means clustering algorithm,30, 31 and enabled the development of coarse-grained beads that represent multiple-water molecules and are compatible with center of mass based coarse-graining methods. Since the IBI method uses radial distribution function (RDF) data extracted from atomistic simulations as the target of the optimization, the models developed retain the structural properties seen in the atomistic counterpart system on the CG level. Since the models were specifically developed to provide an accurate description of the structure, we have not considered thermodynamic properties; however, we note that Toth32 found accurate thermodynamics and structure to be mutually exclusive at the CG level.
The self-assembling capabilities of the models developed are investigated in this work through the simulation of a cholesterol/hexadecanoic acid (a fully saturated fatty acid of 16 carbons, denoted by C16:0) system that has also been studied experimentally by Lafleur and coworkers due to both its simplicity and relevance to the stratum corneum.33, 34 In the experimental work, the phase behavior of cholesterol and C16:0 in well-hydrated mixtures was examined and the effects of temperature and lipid composition determined. The authors found cholesterol and C16:0 existed in a bilayer phase only at temperatures between the melting points of the acid and cholesterol (between 328 K and 422 K); outside of this range, the experimental data suggested high concentrations of cholesterol exist locally within the bilayer in cholesterol-rich domains. Additionally, the authors found the structures varied only slightly with large changes in cholesterol composition from 25% to 65%. The authors hypothesized that the cholesterol and fatty acids form a symbiotic relationship in the bilayer phase where the acid group provides hydrophobic shielding to minimize the contact between the hydrophobic portions of the lipids and bulk water while maximizing the hydrophobic van der Waals (VDW) contacts. Additionally, the rigidifying nature of cholesterol is thought to induce order in the acid tails allowing a bilayer phase to be maintained.
Through the simulation of the C16:0/cholesterol/water system reported herein, we extend the applicability of the CG models developed27–29 to mixed lipid systems and provide additional support for the experimental hypotheses by studying the effects of fatty acid chain length and cholesterol composition on bilayer formation on the molecular level. In addition, the simulations highlight how the different components of the lipid mixture affect the self-assembly process. Furthermore, to provide additional support for the accuracy of the CG models and verification of the structures formed, we have also performed atomistic simulations from preassembled bilayers of C16:0 mixed with cholesterol at temperatures above the melting point of C16:0, thereby matching the experiments as much as possible. Although atomistic simulations have previously been performed by Holtje et al. on preassembled bilayers containing a mixture of C16:0 and C18:0 fatty acids with cholesterol,35 the simulations were performed at temperatures well below the melting point of the fatty acids and experimental results were unavailable for comparison at the time of publication.
2. Simulation Details and Coarse-Graining Methodology
Atomistic simulations have been performed from two initial configurations of a preassembled C16:0/cholesterol bilayer with 144 molecules per leaflet in an equimolar ratio of cholesterol to C16:0 and solvated by 6000 water molecules. In the first configuration, the C16:0 and cholesterol were randomly distributed throughout the leaflets, while in the second an alternating configuration in which the nearest neighbor to each fatty acid is a cholesterol and vice-versa was considered. The CHARMM force field was used to model the C16:036–38 and cholesterol39, 40 with the TIP3P water model41 for the solvent, since the CHARMM force field is based on the use of the TIP3P water model.36–38 After stabilizing the two systems for approximately 500 ps by slowly increasing the temperature from 298 to 333 K and the timestep to 1 fs, the bilayers were equilibrated for a further 5 ns, and then run until the area per lipid remained constant for a total of 30 ns with a 1.0 fs timestep. A simulation time of 30 ns was determined to be sufficient for the atomistic simulations based on the agreement between the two simulations that started from different initial configurations, as described below.
Both atomistic and CG simulations were performed using the LAMMPS molecular dynamics code42 at a temperature of 333 K and a pressure of 1.0 bar using the Nosé-Hoover thermostat and barostat in an NPT ensemble in which each axis of the simulation box is changed independently but remains orthorhombic.43
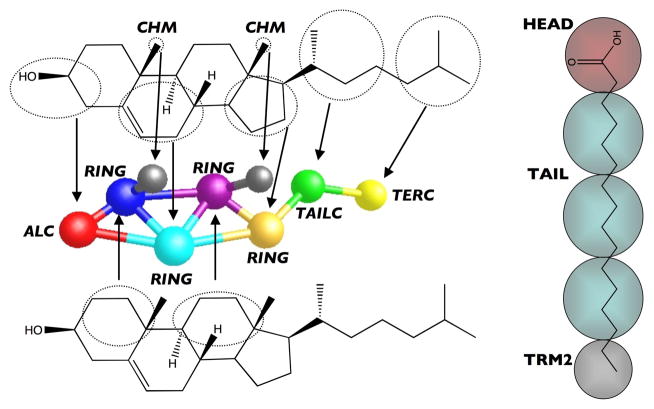
The mapping of the molecules to the CG level is shown in Figure 1. The fatty acid model consists of a chain of tail beads (TAIL) connected to a terminal bead (TER2) and the hydrophilic acid head bead (HEAD).27 The cholesterol model contains a rigid multi-ring structure composed of one hydrophilic bead (ALC), representing the location of the alcohol group, and four hydrophobic beads (RING), attached to a 2-bead (TAILC and TERC) flexible tail. In addition, the chiral methyls of cholesterol are mapped as explicit beads (CHM) separate from the ring structure in order to give the model a distinction between the smooth and rough face of cholesterol.28 Finally, the CG water model (H2O4) represents an average of four waters clustered together in a hydrogen-bonded network.29 Although we have already developed the CG force-fields for the fatty acids, cholesterol and water, to avoid the issues of transferability to different thermodynamic conditions (333 K versus room temperature), the pure interactions were re-optimized at a temperature of 333 K in an amorphous state in the exact same manner as the original models.27,28,29 Once the CG force-fields for the fatty acids, cholesterol and water were obtained the cross-interactions required to study a mixture of the bilayer constituents then needed to be determined; therefore, atomistic NVT simulations were performed for the binary mixtures (equimolar simulations of cholesterol and C16:0 and equivolume simulations of the lipids and water) at 333 K and densities corresponding to 1.0 bar in order to obtain appropriate RDFs for optimizing the missing cross-interactions, as discussed in section 4. The CG simulations were again performed under the same conditions as the atomistic simulations.
Figure 1.
Coarse-grained mapping used for cholesterol (left) and fatty acids (right).
As stated earlier, the IBI method 22, 23 was used in previous work to optimize the non-bonded and bonded interactions in the development of CG models for fatty acids,27 cholesterol 28, and water.29 The IBI method applies an iterative Boltzmann inversion to update the potentials until the RDF of the CG model matches the target RDF extracted from the atomistic trajectory mapped to the CG level. As in previous work, the target RDFs were found to have minimal differences from simulations running for 1, 5 or 25 ns; 27,28 therefore, the optimization simulations were run for 1 ns. In the CG simulations, to optimize the missing cross interactions, potentials for similar interactions were used as an initial guess in conjunction with the previously optimized interactions for the pure species to produce a CG RDF. For example, ALC-ALC was used as the initial guess for the ALC-HEAD interaction. The CG RDF was then extracted from the simulation trajectory and compared against the target RDF and the CG potential updated via a modified Boltzmann inversion, viz:
| (1) |
where Vi (r ) is the potential, gi (r) is the CG RDF, and g* (r) the target RDF, all at distance r and iteration number i. This process is repetitively iterated until there is a negligible change in the potential. We note that the pressure correction process in the original RPM method was not implemented and an iterative procedure in which the potentials are optimized in the NPT ensemble and then reoptimized in the NVT ensemble was used instead to ensure appropriate pressures.27 In equation (1), δ is a damping factor added to the original IBI method to aid in stabilization of the algorithm when optimizing complex CG systems like crystals27, 28 or systems with many interactions to optimize, as discussed in earlier work.27, 28, 44–49
3. Atomistic Simulations Results
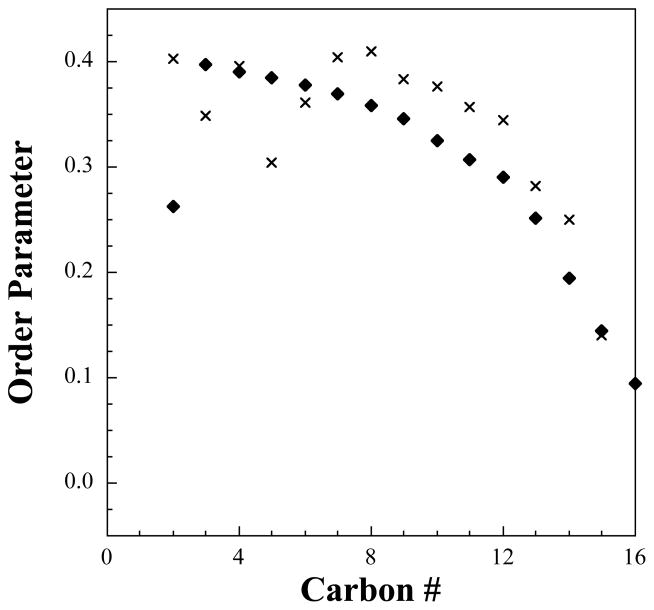
As described above, in order to determine if the initial configuration of the bilayer would affect the results from the atomistic simulations, two atomistic bilayers with different initial configurations were studied. In both simulations, the bilayer remained intact throughout, establishing a bilayer structure is stable for a mixture of cholesterol and hexadecanoic acid. Additionally, independent of the initial configuration, both simulations produced the same area per lipid (33.1 Å) and bilayer height (32 Å), the latter in very good agreement with the experimental value of 32 Å. Furthermore, a comparison of lateral RDFs measured between the hydrophilic groups (ALC-ALC, ALC-HEAD, and HEAD-HEAD) in both simulations confirms the same final structure in terms of the relative location of the cholesterol and fatty acid molecules. To further verify the accuracy of the atomistic simulations, the order parameter of the lipid tails, which is a measure of how well trans-gauche conformations are adopted, was also calculated and compared to experimental data. The order parameter is determined from,
| (2) |
where the brackets represent an ensemble average and θ is the angle calculated between the bilayer normal and the normal vector of the plane formed from each carbon’s hydrogens. An order parameter of 1.0 indicates the tail is completely parallel with the axis of the molecule, a value of 0.0 represents complete disorder in the tail, and a value of −0.5 indicates that the tails are perpendicular to the reference axis. In Figure 2, we present the order parameter measured from the atomistic simulations compared to the experimentally measured values,33 which follow a trend commonly seen for bilayers containing cholesterol, namely, the carbon bonds near the ring structure have a higher order parameter than those near the flexible tail of cholesterol.50–54 However, we note the experimental order parameter is only measured explicitly near the acid group (carbons 2 and 3) and near the terminal carbon atoms (carbons 15 and 16), whereas the values for the middle carbons are assumed to follow a unimodal behavior.33 From the simulations we see that the order parameters are consistently larger than the experimental values, but the data is unimodal for carbons 7 through 16. Additionally, while following the same trend as the remainder of the experimental points (if they were extrapolated), carbon 2 has a much higher degree of order than the experimental target. When considering the experimental assumptions, the rotational order of the fatty acid tails in our simulations appears to be fairly accurate. Finally, in both configurations, cholesterol-rich domains form within the bilayer as seen in Figure 3, which is in further agreement with experimental findings.33
Figure 2.
Order parameter for the fatty acid tails from atomistic molecular dynamics simulations (crosses) compared to experimental data (diamonds).
Figure 3.
Top down view from an atomistic bilayer simulation illustrating the cholesterol rich domains (highlighted yellow regions). In the figure, the cyan/red molecules are cholesterols and the silver/blue molecules fatty acids.
4. Coarse-grained Model Development
Since the capability of the IBI method to produce CG potentials that yield RDFs in good agreement with the atomistic target is well established (see for example references [22, 23, 27–29, 44–48, 55–57]), the RDFs fitted in this work to optimize the missing cross interactions are not shown. Rather, we focus on the procedures used to determine appropriate cross interaction potentials and the self-assembly studies performed utilizing the CG potentials to demonstrate the accuracy of the CG models and their suitability for studying skin lipid self-assembly. By combining the CG potentials obtained from the pure lipid systems studied in previous work27,28,29 and the cross-interaction potentials optimized from simple binary mixture simulations, a mixed lipid system of C16:0, cholesterol, and water can be studied on the CG level. While transferability of the pure interactions to mixed systems has been studied and validated in previous work,27,28,29 here we consider a more complex lipid mixture and have developed a new method to assess transferability through the comparison of RDFs from single-bead simulations, as discussed below.
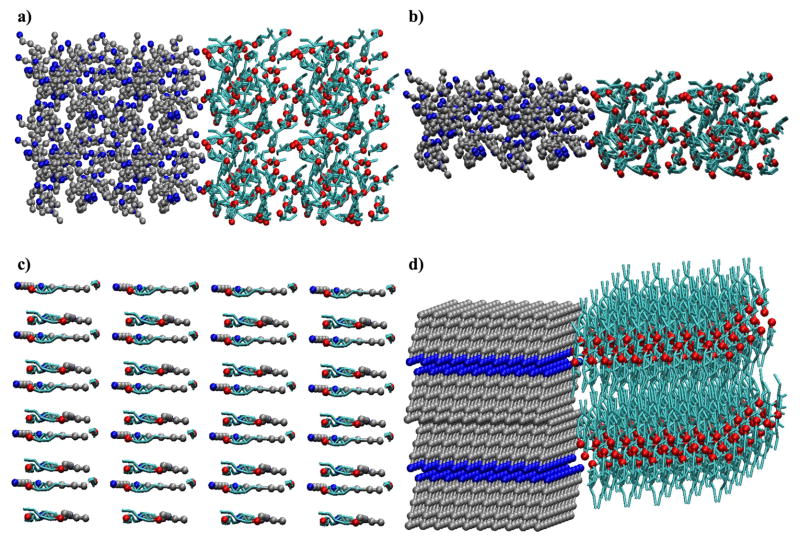
In the self-assembly simulations 400 cholesterol, 400 C16:0, and 7,000 water beads (35 waters/lipid) were combined in four separate initial configurations as shown in Figure 4. Configurations 4a and 4b were built from the final configurations observed in cholesterol/water and C16:0/water simulations (which are phase-separated) to represent an initially immiscible state. In both, the fatty acids were placed on the left and cholesterol placed on the right and then duplicated on a grid. The configuration in 4c represents a “well-mixed configuration, while the remaining configuration, 4d, represents a cholesterol crystal and a fatty acid crystal solvated by water. In simulations with all four of these initial configurations, lipid aggregation was observed after less than 1.0 ns of simulation, but a definitive structure did not form. At this point we should note that the dynamics in the CG simulations are faster than those seen on the atomistic level and so 1.0 ns in a CG simulation does not represent 1.0 ns in the atomistic simulations; the times reported should therefore be interpreted in a relative or comparative sense.
Figure 4.
Initial configurations used in self-assembly studies of cholesterol (cyan/red) and hexadecanoic acid (silver/blue). a) an immiscible state with a 2 × 2 × 2 duplication grid, b) an immiscible state generated using a 4 × 1 × 2 duplication grid, c) a well-mixed state, and d) separate crystal states. Water is not shown for clarity.
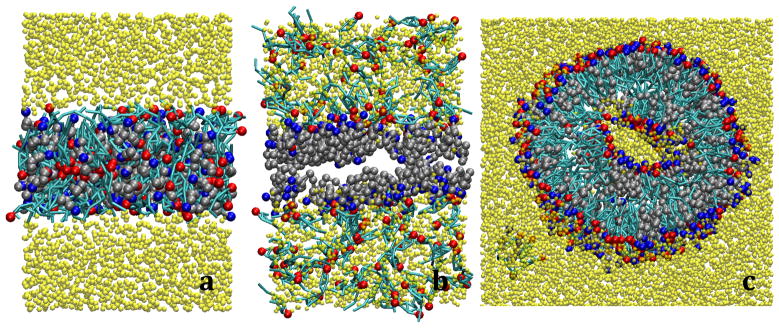
To probe if the force field was capable of self-assembling on any timescale, a preassembled bilayer was studied, since a preassembled bilayer in an equilibrated state should retain its structure on the CG level if the force-field is appropriate. In this case, although the lipids stayed phase-separated from water as shown in Figure 5a, a bilayer structure was not retained; the head groups migrated away from the lipid-water interface, which allowed the hydrophobic groups to interact directly with the water beads. While the pure interactions may be different in a mixed system and could be improved by re-optimization, earlier work suggests that potentials derived from pure systems can be used in mixed systems successfully.29 Therefore, in order to minimize the changes to the potentials developed thus far, and keep the model development as simple and as consistent as possible, we focused on alternative strategies to determine the appropriate cross-interactions.
Figure 5.
Simulation snapshot from screening simulations of cholesterol (cyan/red) and fatty acids (silver/blue) surrounded by water (yellow) using a) the simple, b) the mixture and c) the updated potentials, after 5.0 ns.
The first approach involved optimizing both pure interactions and cross-interactions from the simple binary mixtures (i.e., cholesterol/water, hexdecanoic acid/water, and cholesterol/hexdecanoic acid). For clarity, these potentials will be referred to as the mixture potentials and the potentials with only the cross interactions optimized from the binary mixture simulations will be referred to as the simple potentials. If the preassembled bilayer screening simulation is repeated with the mixture potentials, two different interactions can be used for the pure interactions. For example, the H2O4-H2O4 interaction could be taken from the cholesterol/water simulation or the fatty acid/water simulation. For clarity, the different potential sets used in this study are listed in Table 1. As a result, eight separate combinations of mixture potentials (labeled mixture A through mixture H potential) for the pure and cross-interactions can be tested; however, none of these combinations were found to be capable of retaining a bilayer structure and either formed a phase-separated lipid region, as in Figure 5a, or the cholesterol phase separated from the fatty acids, as seen in Figure 5b.
Table 1.
List of potential sets studied indicating were the interactions in each are taken from and how those interactions were fitted; (all) indicates that both the cross and pure interactions were fitted, (cross) indicates that just the cross interactions were fitted. Key refers to the key cross-interactions (ALC-HEAD, HEAD-H2O4, ALC-H2O4, TAIL-H2O4, RING-H2O4).
| Potential Set | CHOL | FFA | Water | CHOL-FFA | CHOL-Water | FFA-Water | Key |
|---|---|---|---|---|---|---|---|
| Simple | pure | pure | pure | binary (cross) | binary (cross) | binary (cross) | |
| Mixture A | CHOL-FFA (all) | CHOL-FFA (all) | CHOL-water (all) | binary (all) | binary (all) | binary (all) | |
| Mixture B | CHOL-FFA (all) | CHOL-FFA (all) | FFA-water (all) | binary (all) | binary (all) | binary (all) | |
| Mixture C | CHOL-FFA (all) | FFA-water (all) | CHOL-water (all) | binary (all) | binary (all) | binary (all) | |
| Mixture D | CHOL-FFA (all) | FFA-water (all) | FFA-water (all) | binary (all) | binary (all) | binary (all) | |
| Mixture E | CHOL-water (all) | CHOL-FFA (all) | CHOL-water (all) | binary (all) | binary (all) | binary (all) | |
| Mixture F | CHOL-water (all) | CHOL-FFA (all) | FFA-water (all) | binary (all) | binary (all) | binary (all) | |
| Mixture G | CHOL-water (all) | FFA-water (all) | CHOL-water (all) | binary (all) | binary (all) | binary (all) | |
| Mixture H | CHOL-water (all) | FFA-water (all) | FFA-water (all) | binary (all) | binary (all) | binary (all) | |
| Bilayer | bilayer (all) | bilayer (all) | bilayer (all) | bilayer (all) | bilayer (all) | bilayer (all) | |
| Updated | pure | pure | pure | binary (cross) | binary (cross) | binary (cross) | bilayer (key) |
| Final | pure | pure | pure | binary (cross) | binary (cross) | binary (cross) | bilayer* (key) |
After the ALC-HEAD interaction is shifted through equation (3). Numerical tables of the potentials can be obtained by contacting the authors.
These simulations demonstrate how both the simple and mixture potentials cannot reproduce the desired behavior and bilayer structure, most likely due to how differently the molecules behave in the simple binary mixtures compared to the bilayer. Considering a bilayer can only form experimentally in a mixture of the two lipids in the presence of water, this conclusion appears to be reasonable.
De-coupled single-bead simulations
To help determine the CG potential required for self-assembly, all of the CG interactions were optimized against target RDFs obtained from a pre-assembled atomistic bilayer simulation containing 64 lipids per leaflet (referred to as the bilayer potentials) and compared to the simple and the mixture potentials. Initially, the interaction potentials obtained were compared, but the differences provided little insight into how to overcome the preference for general agglomeration rather than self-assembly into an ordered structure. Furthermore, in any system with multiple interaction types, the potentials experience a coupling effect (i.e., changes in one potential can affect all of the RDFs). Therefore, in an effort to decouple the interactions and more clearly define the differences between the potentials, simulations of 225 beads in a cubic box of 30 Å (corresponding to the density of CG water) using the interaction of interest were performed. From these simulations, we found that not only do the single-bead simulations indicate which CG potentials can be treated transferably and which need to change, as discussed below, they also elucidate how the functional groups in the lipids need to interact in order to maintain a bilayer structure.
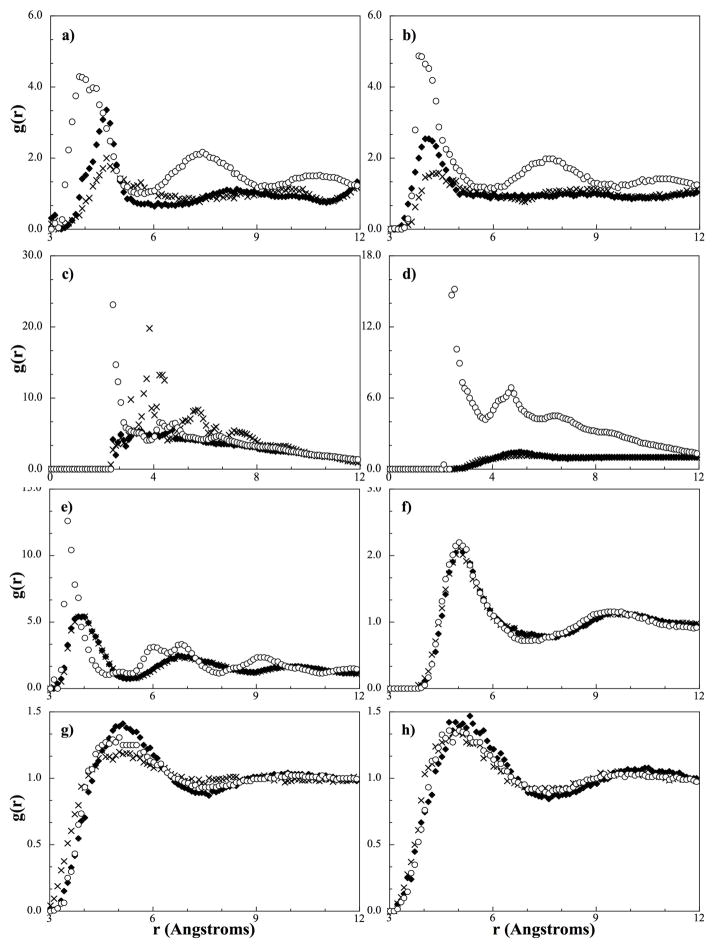
In the CG force field, the HEAD, TAIL, ALC, RING, and H2O4 beads were considered to be the most important because of their large numbers and so the pure and cross-interactions between these beads were the focus of the single bead simulations. Before the results of the de-coupled single bead simulations are discussed, we note that a well-structured RDF with many sharp peaks is assumed to come from a relatively strong potential. As such, in further discussion, if an interaction is said to be stronger, this statement stems from observing sharper and higher peaks in the RDFs. The differences observed in RDFs obtained from each of the interaction potentials (i.e., simple, mixed and bilayer) is shown in Figure 6a for the pure fatty acid HEAD bead. From this figure, the bilayer potential can be seen to have the strongest HEAD-HEAD interaction, the mixture potential the weakest, and the simple potential lying in between. This indicates the potential between HEAD beads obtained from the simulation of a binary fatty acid/water mixture does not have the strength needed to induce the required order in the lipids and achieve self-assembly. A similar trend is obtained for the ALC-ALC interactions as seen in Figure 6b; the bilayer potential has the highest peak and the mixture potential has the lowest.
Figure 6.
Comparison of RDFs from de-coupled single bead simulations with different interaction potentials. a) HEAD-HEAD, b) ALC-ALC, c) HEAD-H2O4, d) ALC-H2O4, e) HEAD-ALC, f) RING-RING, g) RING-H2O4, and h) TAIL-H2O4. Diamonds correspond to the RDF obtained from the simple potential, crosses the mixture potential, and circles the bilayer potential.
A slightly different trend is seen between the HEAD beads and water as shown in Figure 6c; while it is obvious that the bilayer potential has the strongest interaction, the interaction from the mixture potential is stronger than the simple potential. In the mixture potentials, the interaction strength between HEAD beads is decreased compared to the simple potential, and, as a result, the HEAD-H2O4 potential compensates by becoming stronger. In addition, although the mixture HEAD-H2O4 interaction is strong, the interaction from the bilayer potential is significantly stronger due to the well-defined phase boundary (the continuous plane of head groups bordered by water) found in a uniform bilayer. In other words, the high degree of structure at the phase boundary leads to sharp peaks in the target atomistic RDF, which further leads to stronger attraction by way of fitting to the more ordered target atomistic RDFs.
From Figure 6d we can see that the interaction between the alcohol group of cholesterol and water also exhibits similar RDFs in the simple potential and the mixture potential, but is completely different to that seen from the bilayer potential. Furthermore, the ALC-H2O4 interaction in the mixture potential appears to be relatively weak compared to those in Figures 6a-c; however, when considering the hydrogen bonding capabilities between water and an alcohol compared to the hydrogen bonding in the other systems, this trend is expected (i.e., water will have a stronger attraction to an acid group than to alcohol). If the interactions were of the same magnitude, the alcohol group of cholesterol would provide sufficient hydrophobic shielding and would not require the fatty acids to maintain a bilayer structure. Also from Figure 6c and 6d, the ALC-H2O4 RDF and the HEAD-H2O4 RDF from the bilayer potential appear to exhibit a similar shape and magnitude, indicating there should be minimal preference between water and a specific hydrophilic lipid bead in the bilayer phase.
If we consider the cross interaction between two head beads (HEAD-ALC) as shown in Figure 6e, similar to the earlier observation, the well-defined phase boundary in the bilayer causes the cross-interaction between the hydrophilic groups of the two different lipids in the simple and mixture potential to be very different than that obtained from the bilayer potential. Although clustering of the different hydrophilic groups occurs in the binary mixtures, they are not as ordered or as densely packed in an amorphous configuration as in a bilayer; due to the lack of a well-defined phase boundary, the lipids actually arrange themselves in the same amorphous manner as in a water-free binary lipid mixture. In short, the differences in structuring between the binary mixture and bilayer simulations results in higher order structuring in the target bilayer RDFs compared to those from the binary mixtures, which in turn results in stronger interactions in potentials derived by fitting to the bilayer RDFs.
For interactions involving hydrophobic beads, we find negligible differences between the different potentials (as an example the RING-RING RDF is presented in Figure 6f). This indicates the structure of the hydrophobic groups is independent of the specific phase induced by the hydrophilic interactions and the potentials derived from pure simulations are transferable to a bilayer system. We hypothesize this phenomenon stems from the fact that all of the hydrophobic beads have very similar chemical makeup (carbons and hydrogens) and interactions (i.e., weak electrostatic interactions, minimal dipoles, and non-existent hydrogen bonding capabilities). Without strong directional interactions, the atomistic counterparts will interact with themselves with the same interaction strength in most orientations, but when atomistic components hydrogen bond, the relative interactions between sites can vary from system to system because of the orientational dependence. This behavior can be inferred from Figures 6a–e; the hydrogen bonding network found in the simple mixtures is not as extensive and ordered as that found in the bilayer phase, forcing those interactions to deviate from that observed in a bilayer.
The exception to the above generalization is the interactions between hydrophobic beads and water. Although not as different as the hydrophilic RDFs, a small difference does exist between the three potentials, as can be seen in Figure 6g for the RING-H2O4 interaction, which is presented as an example. The interaction strength between RING and H2O4 beads is slightly higher in the simple potential compared to the bilayer and mixture potentials. In the simple potential, the strong interaction between ALC groups and the ALC-H2O4 interaction causes the ring beads to be too isolated from the bulk water and as a result, the RING-H2O4 interaction compensates and is stronger in order to match the target atomistic RDF. In contrast, the weaker ALC-ALC interaction in the mixture force-field allows an appropriate mixing between the hydrophobic beads and water with a weaker RING-H2O4 interaction. In the bilayer potential, water has minimal contact with the RING beads, which is reflected by the near repulsive RING-H2O4 interaction. These conclusions also hold true for the TAIL-H2O4 interactions when considering the RDFs presented in Figure 6h.
Following the above analysis five cross-interactions (HEAD-H2O4 ALC-H2O4, HEAD-ALC, RING-H2O4 and TAIL-H2O4) were identified as sufficiently different between the bilayer and simple or mixture potentials. While the HEAD-HEAD interaction was also significantly different between the simple and the bilayer potential, pure interactions were not updated in order to minimize the changes to the potentials developed thus far and maintain the simplicity of the coarse-graining framework, since in future work additional, more complex, lipid mixtures will be studied.
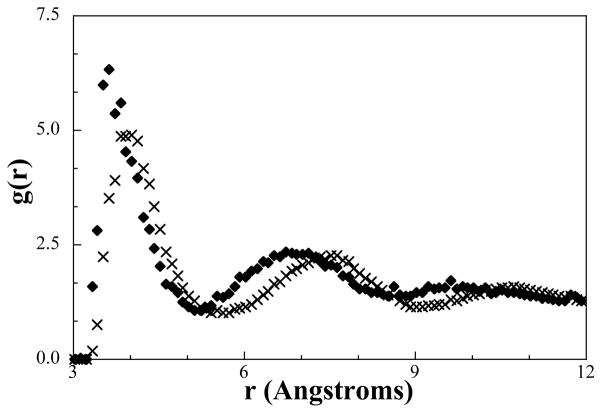
The five cross-interactions in need of updating were replaced in the simple potential by optimizing their interactions against the bilayer RDFs in the ternary bilayer system while keeping all other interactions constant. A CG simulation with the updated potential was then performed and self-assembly achieved; however, a vesicle was formed rather than a bilayer as shown in Figure 5c. This result suggests that the HEAD-ALC RDF measured from a vesicle is within the optimization tolerance of the target RDF measured from a bilayer. This result is not surprising considering the small degree of curvature and the continued presence of a well-defined phase boundary. Molecules capable of self-assembly either form a spherical, cylindrical, bilayer, or vesicle shape based on the area/volume ratio of the molecule.58 Assuming the volume cannot be changed and the area is dependent upon the location of the HEAD-ALC potential minimum, the HEAD-ALC potential was shifted to exhibit a larger repulsive region by moving the potential minimum to larger distances as described by,
| (3) |
where V (r) is the potential at position r and λ is the magnitude of the shift (the distance between the single bead RDF peaks) applied. By altering the potential in this way (λ = 0.5), a more accurate local minima is achieved following re-optimization as shown in Figure 7, where we can see the first peak in the de-coupled RDF has clearly shifted to a higher value indicating the repulsion diameter has increased. With this final potential, following a simulation of a pre-assembled bilayer that retained its structure, simulations were again performed from all four of the initial configurations shown in Figure 4 and self-assembly observed in each case over the course of 25 ns.
Figure 7.
Qualitative comparison of RDFs from the de-coupling single-bead simulations using the HEAD-ALC potential from the bilayer potentials (diamonds), which forms vesicles, and the final potential (crosses) that forms a bilayer.
5. Coarse-Grained Self-Assembly Heuristics
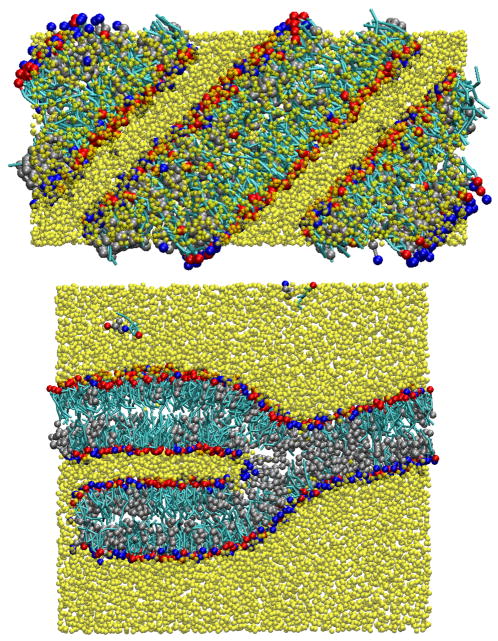
Although self-assembly occurred from all of the initial configurations studied with the final form of the CG potential, all but the simulation starting from the configuration shown in Figure 4b formed a bilayer that spanned the periodic boundaries at an angle as shown in Figure 8a. Independent of how long the simulations were run, the spanned bilayer was found to be too stable to reform into a continuous bilayer. Such a configuration typically indicates the amount of water in the simulation is not large enough, and so the lipids do not have sufficient working volume to form a single bilayer within the simulation cell; essentially, the bilayer is stabilized prematurely by connecting pieces of a bilayer across the reflections from the periodic boundaries. When the amount of water was increased from 35 to 50 waters per lipid, a continuous bilayer formed from configuration (4b), and branched bilayers formed from configurations (4a), (4c), and (4d), similar to that seen in Figure 8b. In configuration (4b), the initial configuration contained lipids in the same plane at a thickness similar to the atomistic bilayer height allowing for self-assembly in a shorter amount of time (less than 5.0 ns). The branched portion of the bilayer in the other configurations was, again, too stable to reform into a uniform bilayer. However, the bilayers formed in all of the configurations did not span across the periodic boundaries, as seen in Figure 9a, indicating solvating the system with 50 waters per lipid was appropriate.
Figure 8.
Snapshot from a self-assembly simulation in which a bilayer of cholesterol (cyan/red) and hexadecanoic acid (silver/blue) solvated by water (yellow) (a) bridges across the periodic boundaries and (b) forms branches.
Figure 9.
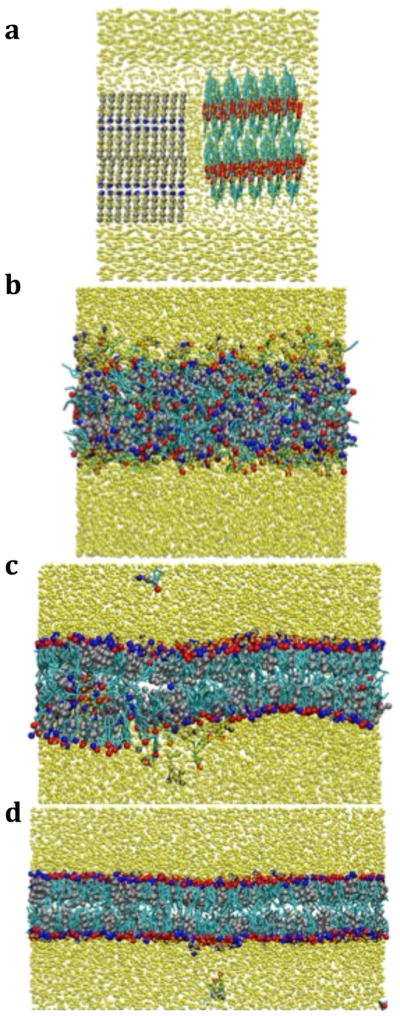
Series of snapshot from a self-assembly simulation of cholesterol (cyan/red) and hexadecanoic acid (silver/blue) solvated by water (yellow). The simulation starts from an initial configuration of separate crystals surrounded by water (a), the lipids aggregate (b), form a bilayer on switching the potential (c), and becomes defect free after 25 ns (d).
These results suggest the initial configuration may be biasing the structure formed; developing a strategy to ensure bilayer self-assembly independent of the initial configuration was therefore desirable. In the simulations performed thus far, the lipids phase separate from the water and aggregate independent of the initial configuration, but only with the final CG force field do the lipids shift from an aggregated state to an ordered phase. These observations indicate the separate roles each bead type plays in self-assembly; specifically, that the hydrophobic interactions drive the lipid aggregation in water, while the hydrophilic interactions induce structure and order into the lipid region in order to form a bilayer. If these two phenomena can be isolated in a step-wise fashion in the equilibration scheme, the formation of bilayers instead of meta-stable configurations should be observed. This can be achieved by exaggerating the roles the bead types exhibit, by initially utilizing the original force field (the simple potential) for driving lipid aggregation through the attraction between the hydrophobic beads followed by switching the five key hydrophilic interactions (resulting in the final potential) to induce the aggregated lipid phase to rearrange into a bilayer structure with a well-defined phase boundary. In this way, the hydrophilic interactions are prevented from inducing order in the lipids prematurely and forcing the structure into a local minimum (e.g. structures found in Figure 8). The strength of the updated potentials (i.e., primarily the ALC-HEAD interaction) causes the shift in structure and discourages transition to metastable configurations.
In Figure 9, a series of snapshots from a CG simulation using the initial configuration shown in Figure 4d and the equilibration scheme outlined above are presented. From the figure, the two lipid crystals combine and form a continuous aggregated lipid phase (Figure 9b). Following the replacement of the key hydrophilic interactions, the lipids orientate themselves so the hydrophilic beads isolate the hydrophobic beads from the bulk water. Throughout the equilibration, defects form and undulations occur as seen in Figure 9c. After some time, more lipids diffuse from the interior of the lipid phase and continue building the bilayer along the x-axis until the system achieves a uniform thickness and is essentially defect free (Figure 9d). When 50 waters/lipid are used to solvate the configurations found in Figure 4, a bilayer is formed in every case using the equilibration strategy described within approximately 25 ns, but only configuration (4b) forms a bilayer when 35 waters/lipid are used. When solvated by 35 waters/lipid, the lipids from configurations (4a), (4c), and (4d) span each axis to stabilize artificial structures. This therefore provides further support for the conclusion that 50 waters/lipid is necessary for bilayer self-assembly with the CG models developed. Although self-assembly can occur with less water, the boundary effects discussed above prevent self-assembly into a bilayer from most of the initial configurations studied.
Finally, the effect of system size was examined through simulations of an equimolar mixture of two lipid crystals containing 256 or 1024 molecules per leaflet solvated by 50 waters/lipid on the CG level. In the large system (1024 lipids/leaflet), self-assembly of a stable bilayer phase occurred over 50 ns (as compared to 25 ns for the original system studied). Although the larger number of lipids is contributing to the longer self-assembly time, the small and large system share a common difference as compared to the original (400 lipids per leaflet) system in that the aspect ratio of the simulation cell in the original system is close to cubic, but, by maintaining the same water to lipid ratio, the aspect ratio of the simulation cell in the small and large lipid systems is far from cubic. Essentially, similar boundary effects as shown in Figure 8 delayed the final stabilization of a uniform bilayer when the simulation box was far from a cubic shape. As further discussed in section 6, each bilayer system with the same molar ratio of cholesterol to fatty acid had the same area/lipid, bilayer height, and lateral RDFs, independent of size. As such, there were no observed system size effects with respect to the final self-assembled structure. In further simulations, 256 lipids per leaflet was found to be the smallest system capable of self-assembling into a uniform bilayer; with 144 lipids per leaflet, boundary effects dominated and prevented the formation of a uniform bilayer.
6. Coarse-Grained Bilayer Results
Equimolar C16:0/CHOL System
With a CG model capable of self-assembly determined, the initially crystalline system was studied for a further 50 ns beyond bilayer formation for analysis. From this simulation, the average bilayer height was determined to be 30 Å, which is ~6% different from the atomistic and experimental value of 32 Å. Although not available experimentally, the average area per lipid was also calculated and found to be in good agreement with the atomistic bilayer at 33.3 Å2 (atomistic value of 33.1 Å2). The observation of a CG bilayer with an accurate area per lipid but smaller than expected thickness could indicate that the water is compressing the bilayer. The average density of the bulk water phase was calculated and compared between the CG and atomistic systems. In the atomistic simulations, the density was found to be 0.984 g/cc in the bulk water phase at 333 K compared to 0.987 g/cc in a pure water system, while the density was found to be 1.345 g/cc in the CG simulation. In the CG simulation the water beads are therefore packing more tightly than in the pure water simulations, resulting in a higher density.
To investigate, the water potential minimum was shifted to larger distances through the use of equation (3) and the simulation rerun with modified water potentials. As expected, the density of the water phase decreased and the average bilayer height increased, but the structure of the lipids was lost. Considering the model predicts the density of pure water to within 0.1% of the experimental value, the updated HEAD-H2O4 and ALC-H2O4 interactions appear to be the source of the compression. Since the average area per lipid indicates the lateral structure is accurate on the CG level and self-assembly cannot occur without the updates to those interactions, the CG force field was not modified to account for the compression effect.
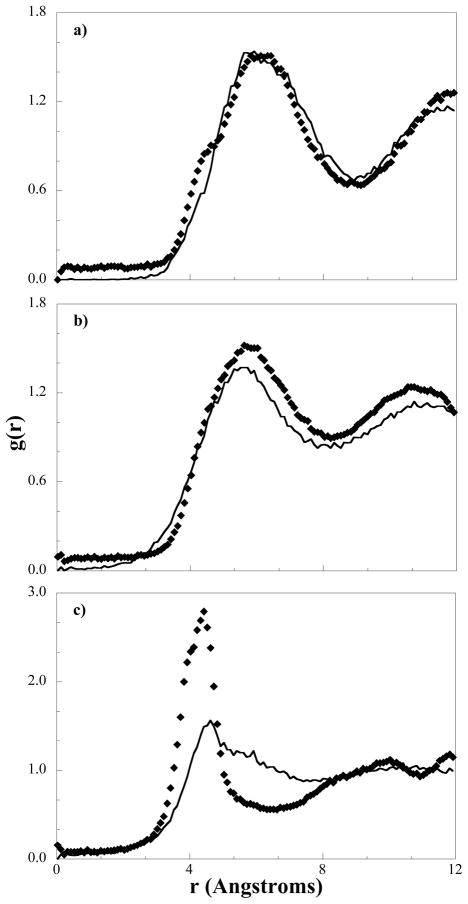
To further verify the structures obtained on the CG level are in agreement with the atomistic simulations, we can also compare lateral RDFs from the atomistic bilayer and the CG bilayer. As representative examples, the ALC-ALC RDF and the HEAD-ALC RDF are shown in Figure 11 and can be seen to be in good agreement with the target data, indicating that the cholesterol molecules are packing and are arranged in the same manner on both length scales. The agreement between the RDFs and the visual identification of cholesterol clusters (similar to Figure 3) confirms the presence of cholesterol-rich domains as hypothesized by Pare et al.33 Although the HEAD-ALC RDF is slightly higher in the CG system, it is consistently higher at an average value of 0.07 and may be a consequence of the mismatch in the HEAD-HEAD RDF shown in Figure 11c; the RDF on the CG level has a much higher and thinner peak than the atomistic target indicating the spacing between HEAD groups exhibits little variation throughout the bilayer. The location of the RDF peak is reproduced in the CG bilayer, supporting the conclusion that the lipids are packing correctly and is further demonstrated by the agreement in the area per lipid measurements between the CG bilayer and the atomistic simulation. The discrepancy in the broadness of the peak can be rationalized when one considers that, atomistically, the acid groups hydrogen bond with water, but also hydrogen bond laterally with cholesterol and other acids; the pairs within a hydrogen bond continuously change throughout the target atomistic simulation, so the distance between the atomistic acid group and a neighboring acid group varies significantly. On the CG level, the hydrogen bonding is implicit and the interaction is isotropic, so the relative positions of interacting (hydrogen bonding) HEAD beads exhibits little variance, resulting in a sharp peak in the RDF.
Figure 11.
Lateral RDFs from coarse-grained bilayer simulations (diamonds) compared to those obtained from mapping atomistic simulation trajectories to the CG level (solid line) for a) ALC-ALC, b) HEAD-ALC, and c) HEAD-HEAD interactions.
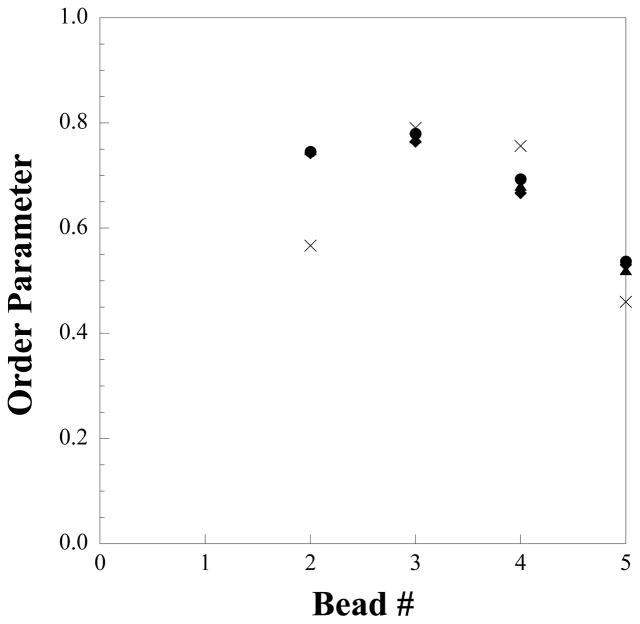
To verify the ordering effect of cholesterol on the CG level, we can measure the order parameter of the fatty acid tails. In comparison to the atomistic system, the definition of θ in equation (2) must change to the angle between the vector formed along the CG bond and the bilayer normal due to the lack of a hydrogen plane. Although the experimental values for the order parameter cannot be reported on the CG level, the CG results can be compared against values measured from atomistic simulations mapped to the CG level as seen in Figure 12. Other than for the first bond, the CG values match the trend of decreasing order at larger bead numbers seen in the atomistic simulation, which implies the rigid structure of cholesterol induces order in the tails, and the flexible tail of cholesterol is not as effective at inducing order in the fatty acid tails towards the center of the bilayer on both the atomistic and CG levels.
Figure 12.
Order parameter of hexadecanoic acid tails from atomistic simulations (crosses) and coarse-grained simulations of differing cholesterol concentrations: 25% (diamonds), 50% (triangles), 65% (circles).
Effect of Cholesterol Concentration
With the CG models shown to self-assemble into structures in good agreement with experimental results, we also investigated the effects of different cholesterol concentrations on bilayer structure. To mirror the work of Paré et al.,33 the effects of differing cholesterol concentrations in the bilayer structure were examined through additional simulations of 400 lipids per leaflet with 25% and 65% cholesterol. From these simulations, increasing the amount of cholesterol was found to have minimal effect on the ordering of the CG flexible tails, as reflected by the order parameter shown in Figure 12, and is consistent with results obtained from atomistic phospholipid/cholesterol bilayer simulations.59 At each bond, the order parameter is within a value of 0.01 from each other, which translates to a ~0.5° difference in the average value of θ. In addition, the fluidizing effect of cholesterol on the CG level is seen when the area/lipid is measured and compared between the systems with differing cholesterol concentrations. As the concentration of cholesterol is increased from 25% to 50% to 65%, the area/lipid increases (from 31.5 to 33.3 to 34.2 Å2, respectively) due to the mismatch in shape and lack of efficient packing between the cholesterol and the hexadecanoic acid. Although Lafleur and co-workers did not measure the area/lipid of this system at any cholesterol concentration and so direct experimental comparison is not possible, a trend of increasing area/lipid with increasing cholesterol concentration has been observed in other lipid bilayer systems59.
The coarse-grained simulations at differing cholesterol concentrations also provide insight into the kinetics of the self-assembly process, in that the acid-rich mixture was found to form a bilayer much faster (~12 ns) than the equimolar system, while the CHOL-rich system self-assembled on a longer timescale (~35 ns). This is likely a result of the increasing amount of fatty acid in the system producing a larger degree of hydrophobic shielding to provide a lower energy barrier and increased driving force for the self-assembly. As stated previously, the role of cholesterol to induce order in the acids is relatively constant for all of the compositions studied. In contrast, the higher concentration of highly hydrophilic beads (HEAD as compared to ALC beads) creates an increasing driving force for structuring, which, in turn, affects the kinetics of the self-assembly. In addition, cholesterol has a lower diffusivity than hexadecanoic acid 27, 28, so a higher level of cholesterol slows down the migration of the molecules into the defect-free bilayer configuration. Finally, we note how the effect of the smaller bilayer density in the 65% cholesterol system appears to be minimal, considering a less compact system would be expected to have higher mobility leading to faster self-assembly.
Effect of Fatty Acid Chain Length
Finally, the transferability and accuracy of the coarse-grained model developed was tested for equilimolar systems containing C12:0 and cholesterol and C24:0 with cholesterol. Ouimet et al. were experimentally able to observe bilayer formation with C14:0 and C18:0 acids mixed with cholesterol, but not for mixtures containing fatty acids with tails longer than 18 carbons or shorter than 14 carbons.34 The authors hypothesized that fatty acids with short or long tails cannot form a bilayer with cholesterol because of the hydrophobic size mismatch between the two molecules,34 while hexadecanoic acid’s and cholesterol’s matching length permits strong van der Waals interactions.
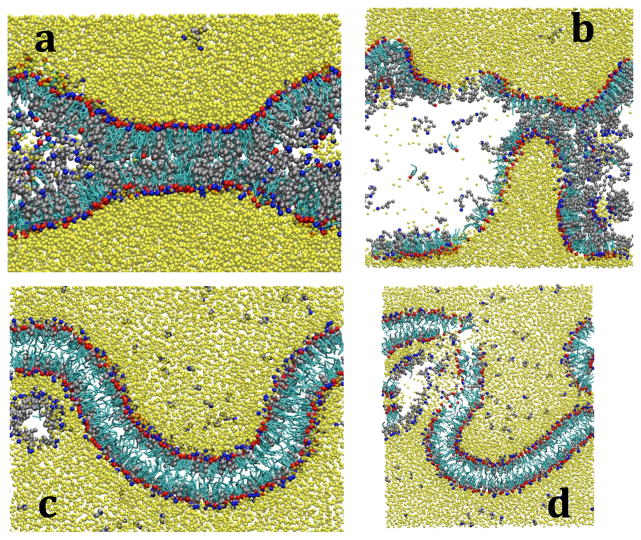
To validate this hypothesis, simulations with both acids from two different initial configurations were studied. The first initial configuration was similar to that shown in figure 4d, while the second configuration was a preassembled bilayer. For C12:0, in the preassembled system, the fatty acids were seen to slowly diffuse out of the bilayer and into the bulk water phase and ultimately form spherical micelles. Micelles were also observed to form in tandem with the bilayer phase in simulations from the crystal configuration. In both configurations, the bilayer tends to wrap around the spherical micelles, as seen in Figure 13a, which increases the degree of contact and curvature of the bilayer, eventually causing the bilayer to buckle and rupture (shown in Figure 13b).
Figure 13.
Snapshots illustrating how C12:0 (a and b) and C24:0 (c and d) fatty acids (silver/blue) destabilize fatty acid/cholesterol bilayers.
In the C24:0 system, the mechanism causing the destabilization of the bilayer is different than that seen for C12:0, but again shows the same behavior from the two different initial configurations. In this case, the extra length in the fatty acid tails prevents the leaflets from being in close contact with each other, resulting in the formation of voids or pockets. These voids create an energetically favorable midpoint for the water along the strong concentration gradient created by the bilayer. As a result, water penetrates the bilayer and collects within the pockets as shown in Figure 13d. As more and more water collects between the leaflets, the hydrophobic repulsion of the tails forces the bilayer to unzip, as seen in Figure 13d. The separation of the leaflets from each other propagates the instability of the system resulting in a similar separated configuration as seen in the C12:0 simulations. The coarse-grained models are, therefore, in good agreement with the experimental observations, not only showing destabilization occurs with a hydrophobic mismatch, but also providing molecular level insight into the mechanism of how the mismatch between the fatty acid and cholesterol destabilizes the bilayer configurations.
7. Conclusions
As a first step towards the development of a suite of CG models for stratum corneum lipids capable of self-assembly, models for cholesterol, fatty acids, and water have been developed and the cross interactions needed to study the self-assembly of a hydrated fatty acid/cholesterol system parameterized. A novel de-coupling strategy was applied to the force field to not only identify the required changes for the CG bead interactions, but also highlight how differently the lipids interact with each other in the presence and absence of water and how the synergistic interactions of these skin lipids differ with respect to how the self-assembly process is driven. Specifically, the hydrophobic interactions drive the lipid aggregation, with the hydrophilic interactions directing the nature of the self-assembled structure. Additionally, the effect of system size, initial configuration and level of hydration on self-assembly was investigated and heuristics developed to facilitate future simulations involving more complex lipid systems.
From simulations on both the atomistic and CG levels, the bilayers studied predict the behavior and structure observed experimentally with respect to cholesterol rich domains, average bilayer height, and the rotational order of the fatty acid tails. In addition, lateral RDFs and the average area per lipid were found to be very similar between the atomistic and CG simulations, further verifying the validity of the CG models developed. In addition, on increasing cholesterol concentrations in the bilayer, the CG simulations predicted behavior consistent with experimental observations and simulations on the effect of increasing cholesterol concentration in phospholipid bilayers 59 and highlighted composition effects on the kinetics of self-assembly. The CG models were also able to characterize the bilayer destabilization behavior exhibited experimentally by short- and long-chain fatty acids. Specifically, C12:0 was shown to destabilize the bilayer by diffusing out of the bilayer and forming spherical micelles that caused the bilayer to buckle and rupture, while the extra length of the C24:0 tail was shown to create pockets for water to enter between the leaflets, which in turn causes the leaflets to unzip.
Figure 10.
Snapshot of self-assembly simulation where cholesterol (cyan/red) and hexadecanoic acid (silver/blue) form a bilayer, but a column bridges the periodic boundaries in the bilayer normal while surround by water (yellow).
Acknowledgments
The project described was supported by Grant Number R01 AR057886-01 from the National Institute of Arthritis and Muscoskeletal and Skin Diseases. Resources were also provided by the National Energy Research Scientific Computing Center, supported by the Office of Science of the Department of Energy under Contract No. DE-AC02-05CH11231, and the National Science Foundation through TeraGrid grant number MCB080117N. We also acknowledge Annette Bunge for useful discussions.
References
- 1.Bouwstra JA, Ponec M. Biochimica Et Biophysica Acta-Biomembranes. 2006;1758:2080–2095. doi: 10.1016/j.bbamem.2006.06.021. [DOI] [PubMed] [Google Scholar]
- 2.Yardley HJ, Summerly R. Pharmacology & Therapeutics. 1981;13:357–383. doi: 10.1016/0163-7258(81)90006-1. [DOI] [PubMed] [Google Scholar]
- 3.de Jager MW. PhD thesis. Leiden University; 2006. [Google Scholar]
- 4.de Jager M, Groenink W, van der Spek J, Janmaat C, Gooris G, Ponec M, Bouwstra J. Biochimica Et Biophysica Acta-Biomembranes. 2006;1758:636–644. doi: 10.1016/j.bbamem.2006.04.001. [DOI] [PubMed] [Google Scholar]
- 5.Groen D, Gooris GS, Ponec M, Bouwstra JA. Biochimica Et Biophysica Acta-Biomembranes. 2008;1778:2421–2429. doi: 10.1016/j.bbamem.2008.06.015. [DOI] [PubMed] [Google Scholar]
- 6.Van Smeden J, Hankemeijer T, Vreeken RJ, Bouwstra JA. Journal of Pharmacy and Pharmacology. 2010;62:807–807. [Google Scholar]
- 7.Kessner D, Ruettinger A, Kiselev MA, Wartewig S, Neubert RHH. Skin Pharmacology and Physiology. 2008;21:58–74. doi: 10.1159/000112956. [DOI] [PubMed] [Google Scholar]
- 8.Bond PJ, Holyoake J, Ivetac A, Khalid S, Sansom MSP. Journal of Structural Biology. 2007;157:593–605. doi: 10.1016/j.jsb.2006.10.004. [DOI] [PubMed] [Google Scholar]
- 9.Edholm O. Computational Modeling of Membrane Bilayers. Vol. 60. Elsevier Academic Press Inc; San Diego: 2008. pp. 91–110. [Google Scholar]
- 10.Marrink SJ, Lindahl E, Edholm O, Mark AE. J Am Chem Soc. 2001;123:8638–8639. doi: 10.1021/ja0159618. [DOI] [PubMed] [Google Scholar]
- 11.Lyubartsev AP, Rabinovich AL. Soft Matter. 2011;7:25–39. [Google Scholar]
- 12.Goetz R, Lipowsky R. J Chem Phys. 1998;108:7397–7409. [Google Scholar]
- 13.Goetz R, Gompper G, Lipowsky R. Phys Rev Lett. 1999;82:221–224. [Google Scholar]
- 14.Shelley JC, Shelley MY, Reeder RC, Bandyopadhyay S, Moore PB, Klein ML. J Phys Chem B. 2001;105:9785–9792. [Google Scholar]
- 15.Stevens MJ. J Chem Phys. 2004;121:11942–11948. doi: 10.1063/1.1814058. [DOI] [PubMed] [Google Scholar]
- 16.Lyubartsev AP. European Biophysics Journal with Biophysics Letters. 2005;35:53–61. doi: 10.1007/s00249-005-0005-y. [DOI] [PubMed] [Google Scholar]
- 17.Venturoli M, Sperotto MM, Kranenburg M, Smit B. Phys Rep-Rev Sec Phys Lett. 2006;437:1–54. [Google Scholar]
- 18.Marrink SJ, de Vries AH, Mark AE. J Phys Chem B. 2004;108:750–760. [Google Scholar]
- 19.Marrink SJ, Risselada HJ, Yefimov S, Tieleman DP, de Vries AH. J Phys Chem B. 2007;111:7812–7824. doi: 10.1021/jp071097f. [DOI] [PubMed] [Google Scholar]
- 20.Izvekov S, Parrinello M, Burnham CJ, Voth GA. J Chem Phys. 2004;120:10896–10913. doi: 10.1063/1.1739396. [DOI] [PubMed] [Google Scholar]
- 21.Lyubartsev AP, Laaksonen A. Phys Rev E. 1995;52:3730–3737. doi: 10.1103/physreve.52.3730. [DOI] [PubMed] [Google Scholar]
- 22.Reith D, Putz M, Muller-Plathe F. J Comput Chem. 2003;24:1624–1636. doi: 10.1002/jcc.10307. [DOI] [PubMed] [Google Scholar]
- 23.Milano G, Goudeau S, Muller-Plathe F. J Polym Sci Pt B-Polym Phys. 2005;43:871–885. [Google Scholar]
- 24.Nielsen SO, Lopez CF, Srinivas G, Klein ML. Journal of Physics-Condensed Matter. 2004;16:R481–R512. [Google Scholar]
- 25.Ayton GS, Izvekov S, Noid WG, Voth GA. Computational Modeling of Membrane Bilayers. Vol. 60. Elsevier Academic Press Inc; San Diego: 2008. pp. 181–225. [Google Scholar]
- 26.Voth GA. Coarse-Graining of Condensed Phase and Biomolecular Systems. Taylor & Francis; 2008. [Google Scholar]
- 27.Hadley KR, McCabe C. J Chem Phys. 2010;132:134505. doi: 10.1063/1.3360146. [DOI] [PMC free article] [PubMed] [Google Scholar]
- 28.Hadley KR, McCabe C. Biophysical Journal. 2010;99:2896–2905. doi: 10.1016/j.bpj.2010.08.044. [DOI] [PMC free article] [PubMed] [Google Scholar]
- 29.Hadley KR, McCabe C. J Phys Chem B. 2010;114:4590–4599. doi: 10.1021/jp911894a. [DOI] [PMC free article] [PubMed] [Google Scholar]
- 30.MacQueen JB. 5th Berkeley Symposium on Mathematical Statistics and Probability; Berkeley, CA. 1967. [Google Scholar]
- 31.Steinley D. British Journal of Mathematical & Statistical Psychology. 2006;59:1–34. doi: 10.1348/000711005X48266. [DOI] [PubMed] [Google Scholar]
- 32.Toth G. Journal of Physics-Condensed Matter. 2007:19. doi: 10.1088/0953-8984/19/33/335220. [DOI] [PubMed] [Google Scholar]
- 33.Pare C, Lafleur M. Langmuir. 2001;17:5587–5594. [Google Scholar]
- 34.Ouimet J, Lafleur M. Langmuir. 2004;20:7474–7481. doi: 10.1021/la0491293. [DOI] [PubMed] [Google Scholar]
- 35.Holtje M, Forster T, Brandt B, Engels T, von Rybinski W, Holtje HD. Biochimica Et Biophysica Acta-Biomembranes. 2001;1511:156–167. doi: 10.1016/s0005-2736(01)00270-x. [DOI] [PubMed] [Google Scholar]
- 36.Schlenkric M, Brickmann J, MacKerrel AD, Jr, Karplus M. In: Biological Membranes: A Molecular Perspective from Computation and Experiment. Roux KMaB., editor. Birkhauser; Boston: 1996. [Google Scholar]
- 37.Feller SE, MacKerell AD. J Phys Chem B. 2000;104:7510–7515. [Google Scholar]
- 38.Feller SE, Gawrisch K, MacKerell AD. J Am Chem Soc. 2002;124:318–326. doi: 10.1021/ja0118340. [DOI] [PubMed] [Google Scholar]
- 39.Cournia Z, Vaiana AC, Ullmann GM, Smith JC. Pure and Applied Chemistry. 2004;76:189–196. [Google Scholar]
- 40.Cournia Z, Smith JC, Ullmann GM. J Comput Chem. 2005;26:1383–1399. doi: 10.1002/jcc.20277. [DOI] [PubMed] [Google Scholar]
- 41.Jorgensen W, Chandrasekhar J, Madura J, Impey R, Klein M. Journal of Chemical Physics. 1983;79:926–935. [Google Scholar]
- 42.Plimpton SJ. Journal of Compututational Physics. 1995;117:1–19. [Google Scholar]
- 43.Hoover WG. Phys Rev A. 1985;31:1695–1697. doi: 10.1103/physreva.31.1695. [DOI] [PubMed] [Google Scholar]
- 44.Ashbaugh HS, Patel HA, Kumar SK, Garde S. J Chem Phys. 2005:122. doi: 10.1063/1.1861455. [DOI] [PubMed] [Google Scholar]
- 45.Sun Q, Faller R. Comput Chem Eng. 2005;29:2380–2385. [Google Scholar]
- 46.Bedrov D, Ayyagari C, Smith GD. Journal of Chemical Theory and Computation. 2006;2:598–606. doi: 10.1021/ct050334k. [DOI] [PubMed] [Google Scholar]
- 47.Elezgaray J, Laguerre M. Computer Physics Communications. 2006;175:264–268. [Google Scholar]
- 48.Rakshit A, Picu RC. J Chem Phys. 2006:125. doi: 10.1063/1.2362820. [DOI] [PubMed] [Google Scholar]
- 49.Chan ER, Zhang X, Lee CY, Neurock M, Striolo A, McCabe C, Cummings PT, Kieffer J, Glotzer SC. Abstracts of Papers of the American Chemical Society. 2005;230:U1253–U1254. [Google Scholar]
- 50.Khelashvili GA, Scott HL. J Chem Phys. 2004;120:9841–9847. doi: 10.1063/1.1724814. [DOI] [PubMed] [Google Scholar]
- 51.Pandit SA, Chiu SW, Jakobsson E, Grama A, Scott HL. Langmuir. 2008;24:6858–6865. doi: 10.1021/la8004135. [DOI] [PMC free article] [PubMed] [Google Scholar]
- 52.Pandit SA, Vasudevan S, Chiu SW, Mashl RJ, Jakobsson E, Scott HL. Biophysical Journal. 2004;87:1092–1100. doi: 10.1529/biophysj.104.041939. [DOI] [PMC free article] [PubMed] [Google Scholar]
- 53.Rog T, Pasenkiewicz-Gierula M. Biophysical Journal. 2006;91:3756–3767. doi: 10.1529/biophysj.106.080887. [DOI] [PMC free article] [PubMed] [Google Scholar]
- 54.Zhang Z, Bhide SY, Berkowitz ML. J Phys Chem B. 2007;111:12888–12897. doi: 10.1021/jp074037i. [DOI] [PubMed] [Google Scholar]
- 55.Chan ER, Striolo A, McCabe C, Cummings PT, Glotzer SC. J Chem Phys. 2007;127:4102. doi: 10.1063/1.2753493. [DOI] [PubMed] [Google Scholar]
- 56.Chen LJ, Qian HJ, Lu ZY, Li ZS, Sun CC. J Phys Chem B. 2006;110:24093–24100. doi: 10.1021/jp0644558. [DOI] [PubMed] [Google Scholar]
- 57.Johnson ME, Head-Gordon T, Louis AA. J Chem Phys. 2007;126:10. doi: 10.1063/1.2715953. [DOI] [PubMed] [Google Scholar]
- 58.Israelachvili J. Intermolecular and surface forces. 2. Academic Press; London: 1991. [Google Scholar]
- 59.Chiu SW, Jakobsson E, Mashl RJ, Scott HL. Biophysical Journal. 2002;83:1842–1853. doi: 10.1016/S0006-3495(02)73949-0. [DOI] [PMC free article] [PubMed] [Google Scholar]


