

Abstract
We investigated the contractile phenotype of skeletal muscle deficient in the titin’s M-band exons MEx1 and MEx2 (KO) by using the cre-lox recombination system and a multidisciplinary physiological approach to study skeletal muscle contractile performance. At a maximal tetanic stimulation frequency, intact KO EDL muscle was able to produce wildtype levels of force. However, at submaximal stimulation frequency force was reduced in KO mice giving rise to a rightward shift of the force-frequency curve. This rightward shift of the force-frequency curve could not be explained by altered sarcoplasmic reticulum Ca2+ handling as indicated by analysis of Ca2+ transients in intact myofibers and expression of Ca2+ handling proteins, but can be explained by the reduced myofilament Ca2+ sensitivity of force generation that we found. Western blotting experiments suggested that the excision of titin exons MEx1 and MEx2 did not result in major changes in expression of titin M-band binding proteins or phosphorylation level of the thin filament regulatory proteins, but rather in a shift towards expression of slow isoforms of the thick filament-associated protein myosin binding protein-C (MyBP-C). Extraction of MyBP-C from skinned muscle normalized myofilament Ca2+ sensitivity of KO EDL muscle. Thus, our data suggest that the M-band region of titin affects the expression of genes involved in the regulation of skeletal muscle contraction.
Keywords: titin, M-band, skeletal muscle, Ca2+ sensitivity
INTRODUCTION
Titin is a giant (~3-4 MDa) protein that comprises the third myofilament of striated muscle, with a single molecule spanning the half-sarcomere. The molecule starts with its N-terminus in the Z-line, which is followed by an elastic region that runs through the I-band in parallel with the thin filaments and a C-terminal region that forms part of the thick filament and that ends at the M-band (18). Despite its abundance in striated muscle, titin is one of the least understood constituents of the sarcomere. Previous work has shown that titin plays crucial roles in muscle development (49) and that it acts as a molecular spring that is responsible for the passive elasticity of muscle (17). In addition to its structural and mechanical roles, titin has been proposed to perform signalling functions based on its serine/threonine kinase domain at the M-band region (26).
Very little is known about the function of the titin kinase. In vitro studies with a mutant kinase domain have provided evidence that T-cap (also known as telethonin) is a titin kinase substrate in embryonic muscle (33). Furthermore, the titin kinase has been suggested to play a role in embryonic sarcomere development, i.e. in the integration of titin into the A-band (49) and in sarcomere structure maintenance (15). Finally, it has been proposed that the titin kinase is a mechano-sensor that regulates muscle protein expression in a strain-dependent fashion (28;43).
Whether the titin kinase affects contractile performance of muscle has not been extensively investigated. Using a conditional knockout of the titin kinase region, it has been shown that the kinase region modulates contractility of cardiac muscle through effects on Ca2+ handling (41). However, the role of the titin kinase region in skeletal muscle contractile performance is not known. Here we studied the contractile phenotype of skeletal muscle deficient in titin’s M-band exon MEx1 (which encodes the kinase domain) and the small neighbouring exon MEx2 (to maintain the open reading frame), by using the cre-lox recombination system with cre expression under control of a MCK promoter. We found that in the absence of titin’s M-band region, the submaximal force generation of intact muscle is impaired, and that the mechanism includes decreased myofilament Ca2+ sensitivity.
MATERIALS AND METHODS
Animal model and tissue harvesting
The titin M-band deficient mouse model has been described previously (15). In brief, MCKcre transgenic animals were used to target deletion of the titin kinase region (M-band exons 1 and 2 were floxed) to striated muscle cells. Animals heterozygous for the MCKcre allele, and homozygous for the floxed titin kinase region are referred to as KO mice. At 20 days of age, animals were anesthetized using isoflurane and the left ventricle (LV), soleus, and extensor digitorum longus (EDL) were dissected. The left EDL was skinned overnight in a solution containing, in mM: 20 BES, 10 EGTA, 6.56 MgCl2, 5.88 NaATP, 1 DTT, 46.35 K-propionate, 15 creatine phosphate, and 1% (w/v) Triton X-100 (pH 7.0 at 20°C). Subsequently, the skinned EDL was washed overnight in relaxing solution (skinning solution without Triton X-100), and stored in relaxing solution containing 50% (v/v) glycerol at −20°C. The right EDL, soleus, and LV were weighed and quick-frozen in liquid nitrogen and stored for protein analyses. Tibia length was measured for muscle weight normalization. All animal experiments were approved by IACUC and followed the NIH Guidelines “Using Animals in Intramural Research” for animal use.
Intact muscle contractility protocol
For intact muscle experiments, mice were anesthetized and left EDL muscles were quickly dissected and, using silk suture, mounted vertically in a tissue bath between a dual-mode lever arm and a fixed hook (1200A Intact Muscle Test System, Aurora Scientific Inc., Canada). The muscle was bathed in continuously oxygenated (95% O2-5% CO2) mammalian Ringer solution with pH 7.40 at 30°C. Temperature of the solution was maintained at 30°C during the experiment. The muscle was stimulated directly by using platinum plate electrodes placed in close apposition to the muscle. Muscle preload force was adjusted until optimal fibre length for maximal twitch force was achieved (pulse duration of 200 μs).
Post-tetanic twitch potentiation protocol
First a single twitch was induced followed after 20 seconds by a 2-second tetanus using a stimulation frequency of 200 Hz (sufficient to induce maximal tetanic force in EDL muscle). Ten seconds after completion of the tetanus a second twitch contraction was measured (53). From these data maximal tetanic force, tetanic half-relaxation time and twitch-potentiation was calculated.
Force-frequency protocol
Five minutes after completion of the post-tetanic twitch potentiation protocol, the muscle was stimulated at various incremental stimulation frequencies (1, 5, 10, 20, 40, 60, 80, 100, 150, and 200 Hz). Data was discarded when the stimulation at 200 Hz rendered a force less than 95% of the force generated at 200 Hz stimulation during the post-tetanic twitch potentiation protocol. Stimuli were applied with a train duration of 400 ms, and a 90 second interval.
After completion of the contractility measurements, length and weight of the EDL muscles were determined. Cross-sectional area (in mm2) was calculated by dividing EDL muscle weight (g) by muscle length (cm) multiplied by specific density (1.056 g/ml) x 100. Force was normalized to muscle cross-sectional area (in mN/mm2).
Determination of Ca2+ transients
For these experiments we selected the flexor digitorum brevis (FDB) muscle because of its very short fibers which reduces movement artefacts. Thus, FDB is a commonly used muscle for Ca2+ handling studies (4;5;22;42;47). The procedure for isolating intact fibers was as described previously (5), with minor modifications. Briefly, muscles were dissected and incubated for ~90 minutes at 36°C in mammalian Ringer solution (in mM, 145 NaCl, 2.5 KCl, 1.0 MgSO4, 1.0 CaCl2, 10 glucose, 10 HEPES at pH 7.4 at 20°C) containing 2 mg/ml collagenase Type II (Worthington CLS2). After incubation, the muscles were washed four times with mammalian Ringer solution and gently separated from tendons by sucking the muscle gently though a small bore pipette. Subsequently, the dissociated single muscle fibers were loaded with the ratiometric Ca2+ indicator Fura 2FF/AM (the ester form of fura 2FF; Teflabs, Austin, TX, USA) for 45 minutes at 20°C at a concentration of 4 μM. Fibers were transferred to the experimental chamber and allowed to adhere to its glass bottom. The experimental chamber was mounted on the stage of an inverted Olympus IX70 microscope equipped for fluorescence. A 360/380 nm excitation wavelength pair was used with a 510 nm emission filter set, which permitted continuous excitation at 380 nm, while fluorescence excited at 360 nm was interpolated (at this wavelength fura 2FF fluorescence yield is independent of Ca2+ concentration). Fluorescence signals were collected from an area of approximately 20x20 μm, using a photomultiplier system (IonOptix, Milton, MA, USA). Intact fibers were activated with electrical field stimulation (at 1 Hz for 10 sec), and the change in the ratio of the fluorescence measured at 380 and 360 nm excitation was calculated to determine Ca2+ transients. This procedure allowed Ca2+ transient recordings from numerous fibers located within the chamber. The myosin inhibitor N-benzyl-p-toluene sulphonamide (BTS, 10 μM) was used to depress contractions and limit movement artifacts. Temperature was maintained at 20°C during the whole experiment. The recordings of ten consecutive transients per fiber were averaged and analyzed using Ionwizard software (Ionoptix, Milton, MA, USA).
Skinned muscle protocols
Contractility experiments
The procedures for skinned muscle contractility were as described previously (38;39), with minor modifications. In short, EDL muscle from KO and control mice were skinned overnight at ~4°C in relaxing solution (in mM; 20 BES, 10 EGTA, 6.56 MgCl2, 5.88 NaATP, 1 DTT, 46.35 K-propionate, 15 creatine phosphate, pH 7.0 at 20°C) containing 1% (w/v) Triton X-100. The skinning procedure renders the membranous structures in the muscle fibres permeable, which enables activation of the myofilaments with exogenous Ca2+. Preparations were washed thoroughly with relaxing solution and stored in 50% glycerol/relaxing solution at −20°C. Small muscle bundles (diameter ~0.01 mm2) were dissected from the skinned muscles. Muscle bundles were attached to a strain gauge and a high-speed motor using aluminum foil clips. Experiments were performed at 20°C. Sarcomere length (SL), measured with an on-line laser-diffraction system (19), was adjusted to 2.5 μm. The XY (width) and XZ (depth, using a prism) bundle diameters were measured with a x40 objective. The muscle bundle cross-sectional area (CSA) was calculated from the average of three width and depth measurements made along the length of the muscle bundle. The preparation was activated at pCa 4.5 to obtain maximal Ca2+-activated force. Maximal stress was determined by dividing the force generated at pCa 4.5 by CSA. To determine force-pCa relationships, the force generated in response to incubation with incremental [Ca2+] (pCa 9, 6.5, 6.25, 6.0, 5.75, 5.5, and 4.5) was recorded. Graphpad software (Graphpad Software Inc., San Diego, CA, USA) was used to calculate the [Ca2+] required for half-maximal activation (pCa50) as an index of Ca2+ sensitivity, and the nH as an index of cooperativity. Similar procedures were followed for skinned soleus measurements. Rigor cross-bridge based tension was studied by determining the force-pMgATP relationships in skinned EDL bundles. Force generated in response to incubation with incremental [MgATP] (pMgATP 4.4, 4.2, 4.1, 4.0, 3.9, 3.8, 3.7, 3.6, 3.4, and 3.25) was recorded, and the [MgATP] required for half-maximal activation (pMgATP50) was calculated. Ionic strength, and free [Mg2+] of the various solutions were kept constant; the free ion composition of the solution was calculated according to Fabiato et al (10). To extract MyBP-C from skeletal muscle a protocol described by Hofmann et al (24;25) was used, with minor modifications. Briefly, EDL bundles were slightly stretched and bathed for 3h at 20°C in a solution containing (in mM) 10 EDTA, 31 Na2HPO4, and 124 NaH2PO4 at pH 5.90. To prevent extraction of troponin and myosin light chain 2, 0.40 mg/ml purified rabbit fast skeletal muscle troponin and 0.40 mg/ml recombinant murine myosin light chain 2 (both kindly provided by Dr. Danuta Szczesna) were added to the extraction solution. After 5-10 minutes in extracting solution the bundles were slightly shortened to release rigor tension. Following extraction, the bundles were bathed for 10 minutes in relaxing solution containing 0.40 mg/ml skeletal muscle troponin and 0.40 mg/ml light chain 2 to restore troponin or light chain 2 lost during extraction. Then, to determine force-pCa relationships the force generated in response to incubation with incremental [Ca2+] was again determined as described above. Passive stress, measured during stretch, was determined by dividing the passive force by CSA.
Gel electrophoresis and Western blotting
Titin Gel Electrophoresis
SDS-agarose electrophoresis studies were performed as previously described (48). Wet gels were scanned and analyzed with One-D scan EX (Scanalytics Inc., Rockville, MD, USA) software. The integrated optical density of titin, truncated titin, total titin, nebulin, and myosin heavy chain (MHC) were determined as a function of the volume of solubilized protein sample that was loaded (a range of volumes was loaded on each gel). The slope of the linear range of the relation between integrated optical density and loaded volume was obtained for each protein.
Titin binding proteins
For MURF-1, MURF-2, and FHL2 12% acrylamide gels were used, for myomesin-1 and myomesin-2 6% acrylamide gels, and 1% SDS-agarose gels for obscurin. Western blotting was performed using the antibodies X148a-149 against MURF-1 (kind gift from Dr. Siegfried Labeit), 3910g (Biogenes) against MURF-2, 50055-3 (Medical and Biological Laboratories) against FHL2, N-14 (Santa Cruz Biotechnology) against myomesin-1, N-20 (Santa Cruz Biotechnology) against myomesin-2, and I48/49 (Biogenes) against obscurin. Titin binding protein levels were normalized to myosin heavy chain levels (antibody: MYH (Y-20), Santa Cruz Biotechnology), except for MURF-1 which was normalized to actin (antibody: actin (H-300), Santa Cruz Biotechnology). Infrared-labeled secondary antibodies were used for detection. One or two-color IR western blots were scanned (Odyssey Infrared Imaging System, Li-Cor Biosciences, NE. USA) and the images analyzed with One-D scan EX (Scanalytics Inc., Rockville, MD, USA).
Myosin heavy chain isoform composition
The skinned EDL bundles that were used for contractile experiments were detached from the force transducer and servo-motor and placed in SDS sample buffer containing 62.5 mM Tris_HCL, 2% (wt/vol) SDS, 10% (vol/vol) glycerol, and 0.001% (wt/vol) bromophenol blue at a pH of 6.8. The samples were stored at −80°C until assayed. The samples were denatured by boiling for 2 min. The stacking gel contained a 4% acrylamide concentration (pH 6.7), and the separating gel contained 7% acrylamide (pH 8.7) with 30% glycerol (v/v). Control samples of mouse soleus and tibialis cranialis muscle were run on the gels for comparison of migration patterns of the myosin heavy chain isoforms. Sample volumes of 10 μl were loaded per lane. The gels were run for 24h at 15°C and a constant voltage of 275V. Finally, The gels were silver-stained, scanned, and analyzed with One-D scan EX software.
MyBP-C
Muscle samples were homogenized and analyzed on SDS-acrylamide gels as described previously (34). MyBP-C expression was determined using a vertical slab gel (0.75 mm thickness) composed of 6% acrylamide-0.16% bisacrylamide. Gels were scanned and analyzed with One-D scan EX software. For Western blot analysis of slow and fast MyBP-C expression an antibody against slow and fast isoforms of MyBP-C was used (#BB-211 and BB-88, respectively, kind gift from Dr. Furst). The magnitude of MyBP-C extraction (see skinned muscle protocols) was determined using 6% SDS-acrylamide gels. Gels were silver silver-stained using a kit from Bio-Rad (#161-0449, Bio-Rad, Hercules, CA).
Regulatory proteins
For thin-filament based regulatory protein analyses 3.75-12% acrylamide gels were used. For troponin expression patterns, Western blotting was performed using fast-skeletal and slow-skeletal specific antibodies (ss-TnI: cs-20645; fs-TnI: sc-8120; ssTnT: sc-28269; fs-TnT sc-8123), and a troponinC antibody (sc-8117) that recognizes both slow- and fast-skeletal troponinC (Santa Cruz Biotechnology Inc, USA). For tropomyosin expression, Western blotting was performed using an antibody directed against both α- and β-tropomyosin (CH1, Hybridoma Bank, University of Iowa). Secondary antibodies conjugated with fluorescent dyes with infrared excitation spectra were used for detection. One or two-color IR western blots were scanned (Odyssey Infrared Imaging System, Li-Cor Biosciences, NE. USA) and the images analyzed with One-D scan EX.
Sarcoplasmic reticulum Ca2+ handling proteins
For analysis of SR Ca2+ handling proteins 12% acrylamide gels were used, except for sarcolipin for which 4-20% gradient gels were used. Western blotting was performed using antibodies against SERCA-1 (MA3-912, Affinity BioReagents), SERCA-2 (MA3-919, Affinity BioReagents), calsequestrin-1 (MA3-913, Affinity BioReagents), calsequestrin-2 (PA1-913, Affinity BioReagents), parvalbumin (PV28, Swant), and sarcolipin (1867/07 #5, kind gift from Dr. Siegfried Labeit). Protein levels were normalized to myosin heavy chain levels (antibody: MYH (Y-20), Santa Cruz Biotechnology). The antibodies were visualized as described above.
MLC-2 phosphorylation
Urea glycerol PAGE was used as described previously (23). In brief, the resolving gel consisted of 10% acrylamide, and the stacking gel of 5% acrylamide. Gels were stained with Coomassie blue (0.1% brilliant blue G 250 in 25% methanol and 5% acetic acid) for 1 h and scanned with an Epson Expression 1680 scanner using software v 1.01e. The densitometric analysis of the protein bands was carried out with One-D scan EX software. The integrated optical density of the MRLC and the MRLC-P was used to obtain the percentage of MRLC-P
Phosphorylation of myofilament proteins
2-7% gradient SDS-PAGE was used for separation of myofilament proteins with high molecular weight, and 12% SDS-PAGE for lower molecular weight proteins. The gels were fixed in 100 ml 50% methanol and 10% acetic acid. Gels were washed three times with 100 ml of ultrapure water 10 min each, and immersed in 100 ml of Pro-Q Diamond (Molecular Probes/Invitrogen) and incubated 90 min under gentle agitation in the dark. After destaining the gels were scanned with Typhoon 9400 (Amersham Biosciences), excitation filter 532 nm and emission filter 580 nm bandpass. Then the gels were stained with Coomassie blue, destained and scanned with an Epson Expression 1680 scanner. The images were analyzed with One-Dscan software (Scanalytics, Inc.). The integrated optical density of the Pro-Q diamond stain was divided by the integrated optical density of the Coomassie blue stain in order to normalize for loading.
Statistical analysis
For muscle mechanics experiments, typically 5-6 muscle preparations were studied per mouse, and 6-7 mice per group. For the gel-electrophoresis and Western blotting studies typically five mice were analyzed per group. The data are presented as means ± SEM. Statistical analyses were performed by t-test between KO and control mice; p < 0.05 was considered statistically significant.
RESULTS
Mouse model of titin M-band region deficient skeletal muscle
To delete titin’s M-band region exon MEx1 (which encodes the kinase domain) and the small neighbouring exon MEx2 (to maintain the open reading frame) were floxed and excised using Cre-induced recombination under control of the muscle creatine kinase promoter (MCKcre) (15), resulting in expression of a truncated titin isoform (for a schematic, see figure 1). Previous work using this model revealed body weight loss and myopathic changes in titin kinase region deficient mice at 30 days of age (40). Because our goal was to investigate early effects of deficiency of titin’s M-band region on muscle contractile performance, we chose to study 20 day old mice in order to minimize secondary effects on muscle function. At day 20, body weights were comparable between KO and control mice (9.4 ± 0.3 vs 9.7 ± 0.4, respectively, figure 2A). Moreover, we observed no difference in wet weight of soleus, EDL and LV muscle between KO and control mice (figure 2B).
Figure 1.

Schematic of titin’s M-band region, including the two excised exons MEx1 (containing the kinase domain) and the flanking exon MEx2 (MEx2 was excised to maintain the open reading frame). The excised exons code for 1974 amino acids (AA). Also shown are the titin M-band binding proteins MURF-1, nbr1, myomesin, and obscurin. Note that obscurin binds to MEx6 (thus not to an excised exon).
Figure 2.

Muscle weight and sarcomeric protein expression. A) At 20 days, body weight was similar in control and KO mice. B) Muscle mass was comparable between control and KO extensor digitorum longus (EDL), soleus, as was left ventricular (LV) muscles. C) SDS-agarose electrophoresis was used to determine expression of the three major sarcomeric proteins. Left panel: typical gel result showing the truncated titin isoform. Right panel: At 20 days, 30-40% of total titin is titin kinase region deficient; in LV this percentage is slightly higher. D) Expression levels of three major sarcomeric proteins titin, nebulin and myosin heavy chain (MHC) is similar in KO and control EDL, soleus, and LV.
Using SDS-agarose gel-electrophoresis we detected expression of a single titin isoform in EDL and soleus muscle of 20 day old control mice. KO mice expressed a truncated titin isoform with higher mobility (for typical gel-result see figure 2C). At 20d of age, 30-40% of total titin is truncated in EDL and soleus muscle of KO mice; at the same age LV muscle contains ~50% truncated titin (figure 2C, right panel). Importantly, the total amount of titin protein content was comparable between KO and control muscle (figure 2D). Deletion of the titin kinase region did not affect expression of other major sarcomeric proteins such as myosin heavy chain and nebulin (figure 2C, bottom panel). Thus, at 20d of age the KO mice exhibit (1) significant amounts of truncated titin with similar results for slow and fast twitch skeletal muscle, and (2) no distinct effects of deletion of titin’s M-band region on macroscopic muscle morphology as indicated by normal muscle weights, and normal expression of major sarcomeric proteins.
Expression of titin binding proteins
Multiple proteins bind in and near the titin kinase region (muscle specific ring finger protein-1 (MURF-1), four-and-a-half LIM protein-2 (FHL2), myomesin, nbr1, obscurin, see also figure 1). MURF-1 binds titin directly adjacent to the kinase and is a member of the MURF family that consists of MURF 1-3. MURF-1 acts as a ubiquitin-ligase and plays an important role in controlling proteasome-mediated protein degradation (3). It was recently proposed that MURF-2 binds indirectly to the titin kinase domain and that it forms together with nbr1 and p62 a signalosome that regulates protein expression in a strain-dependent fashion (28). FHL2 binds metabolic enzymes (27), myomesin cross-links thick filaments at the M-band (1), and obscurin participates in myofibril organization during muscle development (12). Considering that these proteins play important roles in muscle physiology and that their binding site at titin’s M-band region is deleted in the KO mice, we determined whether expression levels of these proteins were affected in the KO skeletal muscle. Due to lack of commercially available nbr1 antibodies we were unable to determine nbr1 protein levels. Using quantitative Western blotting we determined MURF-1, MURF-2, FHL2, myomesin-1 (ubiquitously expressed) and −2 (mainly expressed in fast-twitch fibers), and obscurin levels. MURF-2 and FHL2 expression was undetectable in both KO and control EDL (similar antibody dilutions did show staining in both soleus and LV, with no difference between KO and control mice, data not shown). As shown in figure 3, levels of titin binding proteins were not significantly different between KO and control EDL. Similar findings were obtained in soleus muscle from KO and control mice (data not shown). Thus, excision of titin exons MEx1 and MEx2 did not result in major changes in expression of titin M-band binding proteins.
Figure 3.
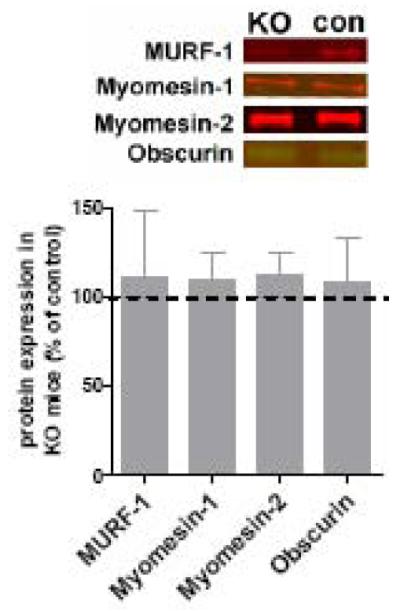
The upper panel shows representative Western blot results for titin M-band binding proteins. Lower panel: Levels of the titin M-band binding proteins MURF-1, myomesin-1, and −2, and obscurin in EDL muscle (normalized to MHC) showed no significant difference between KO and control EDL. (The titin M-band binding protein FHL2 was not detectable in control or KO EDL.)
Altered contractility of intact skeletal muscle from KO mice
To determine whether deficiency of titin’s M-band region affects skeletal muscle contractility, we measured contractile performance of intact EDL muscle. EDL has been widely used for intact muscle studies, mainly due to its relatively small size which facilitates oxygenation, its well-defined tendons, and because it is a commonly used representative of fast-twitch muscles. In line with previous work on EDL muscle (13;31), maximal tetanic stress generation was found to be ~350 mN/mm2 in control EDL, and maximal stress of KO EDL was not significantly different (for a typical response to maximal tetanic stimulation, see figure 4A). It should be noted that, rather than maximal activation, skeletal muscle undergoes submaximal activation during most daily-life activities. Therefore, in addition to maximal stimulation, we also determined the stress generating capacity of EDL muscle in response to twitch and submaximal tetanic stimulation. As shown in figure 4B, twitch stress was on average lower in KO compared to control EDL, but this difference was not significant. However, the twitch/tetanus ratio of KO muscle was significantly lower compared to control (figure 4C), and these findings prompted us to determine the stress generating capacity of EDL muscle in response to various submaximal stimulation frequencies. As shown in figure 4D the corresponding force-frequency curve is shifted to the right in KO compared to control EDL, indicating that at similar submaximal stimulation frequency KO muscle generates less force. Thus, the force generating capacity of intact muscle from titin M-band deficient mice is impaired during submaximal activation.
Figure 4.

Intact skeletal muscle contractility. A) Left panel: typical force tracing in response to maximal tetanic stimulation (200 Hz) of intact KO and control extensor digitorum longus (EDL) muscle. Right panel: Maximal stress generation during tetanic stimulation is comparable between KO and control EDL. B) Left panel: typical force tracing in response to twitch stimulation of KO and control EDL. Right panel: Maximal twitch stress. C) The twitch/tetanus force ratio is significantly lower in KO compared to control muscle. D) Force-frequency curve; note the rightward shift of the curve in KO EDL. *: significantly different from control, p<0.05.
To determine whether the reduced force generation at submaximal activation in titin M-band deficient muscle (figures 4C&D, respectively) reflects changes in sarcoplasmic reticulum Ca2+ release, we measured Ca2+ transients in intact muscle fibres. Figure 5A depicts typical Ca2+ transient recordings from twitch activated single fibers. On average there was no significant difference in baseline Ca2+ levels, time to peak Ca2+ release (data not shown), or in the amount of Ca2+ released upon stimulation (figure 5A, middle panel). Thus, these data suggest that reduced Ca2+ release does not explain the reduced submaximal force generating capacity of KO muscle.
Figure 5.

A) Left panel: Typical Ca2+ transient recording from muscle fibers from KO and control mice, using the ratiometric Ca2+ dye fura 2FF/AM. Note the faster Ca2+ reuptake in KO fibers. Middle panel: The amount of Ca2+ release upon twitch stimulation was comparable between KO and control fibers. Right panel: The rate of Ca2+ reuptake by the sarcoplasmic reticulum was significantly faster in KO mice as indicated by decreased time constant of transient decay (i.e. tau). B) Magnification of the relaxation phase of tracings shown in 4A, normalized to maximal force. Inset: tetanic half-relaxation time is significantly decreased in KO vs control EDL. C) Expression analysis of proteins involved in sarcoplasmic reticulum Ca2+ handling showed no significant difference between KO and control EDL (phospholamban was undetectable in both KO and control), except that sarcolipin (SLN) which was upregulated. (CSQ: calsequestrin; PLN: phospholamban) *: significantly different from control, p<0.05.
A significant finding of our work was that the rate of Ca2+ reuptake was significantly faster in KO fibers compared to control fibres, as indicated by lower values for tau (i.e. the time course of transient decay, derived from a mono-exponential fit, figure 5A, right panel): 7.8 ± 0.3 and 11.2 ± 0.8 ms, respectively. In line with faster Ca2+ reuptake, muscle relaxation was faster in KO compared to control muscle after tetanic stimulation (as indicated by the shorter half-relaxation time: 23 ± 0.3 vs 26 ± 0.8 ms, respectively, figure 5B); although twitch contractions of KO EDL showed on average shorter half-relaxation times as well, this difference was not significantly different (15.9 ± 0.7 and 16.9 ± 2.0 ms, KO vs control, respectively). Previously, work on a cardiac-specific KO model (with a titin M-band region deletion that was identical to the deletion in the present model) revealed slower Ca2+ reuptake in KO cardiomyocytes (41). Therefore, to further test whether titin M-band region deficiency differentially affects Ca2+ reuptake in skeletal vs. cardiac muscle, we also studied Ca2+ transients in cardiomyocytes of the present KO model, and in line with the previous study (41) Ca2+ reuptake was slower in KO than control cardiomyocytes (tau: 93 ± 2 and 79 ± 1 ms, KO and control, respectively). Thus, in contrast to cardiac muscle, Ca2+ reuptake in skeletal muscle from KO mice is enhanced, resulting in faster muscle relaxation. The changes in SR Ca2+ handling were not accompanied by altered expression of Ca2+ regulating proteins of the SR (figure 5C), with the exception that expression of the SERCA-inhibitor sarcolipin was increased ~8 fold in KO vs control EDL (see also Discussion).
Reduced Ca2+ sensitivity of force generation in KO skinned muscle fibres
We next studied whether the mechanisms underlying the reduced submaximal force generation in KO EDL (figure 4D) include changes in myofilament Ca2+ sensitivity. We used skinned EDL muscle preparations and determined the force response when exposed to various concentrations of Ca2+ (for typical response, see figure 6A). As depicted in figure 6B (right panel, top), maximum Ca2+-activated force was comparable between KO and control EDL. However, we found a rightward shift of the force-pCa curve (figure B, left panel) indicating that a given submaximal Ca2+ concentration generated less force in KO EDL fibres, with a pCa50 of 5.93 ± 0.01 and 6.02 ± 0.01, KO and control respectively (figure 6B, right panel, bottom). Hill-coefficients were 2.8 ± 0.2 and 3.8 ± 0.3, KO and control, respectively, suggesting reduced cooperativity of activation. To test whether titin M-band region deficiency reduces Ca2+ sensitivity in EDL only or whether it is a more universal phenomenon, we also studied the slow-twitch soleus muscle. The Hill coefficient was not different in KO vs. control. However, as shown in figure 6B (right panel, bottom), Ca2+ sensitivity was significantly reduced (pCa50: 5.98 ± 0.02 and 6.11 ± 0.03, KO and control, respectively).
Figure 6.

Force-Ca2+ characteristics of skinned muscle from KO and control mice. A) Typical chart recording showing the force response to incremental Ca2+ concentrations in control EDL. B) Left panel: the force generated in response to incubation with incremental increase of [Ca2+]; note the rightward shift of the force-Ca2+ relationship in KO vs control EDL. Right panel, top: maximal Ca2+-activated stress of EDL and soleus muscle were comparable between KO and control mice; bottom: the Ca2+ concentration needed for 50% of maximal force generation was significantly higher (i.e., lower pCa50) in KO vs control in both EDL and soleus, indicating decreased Ca2+ sensitivity of force generation. *: significantly different from control, p<0.05.
To test for molecular changes underlying the reduced myofilament Ca2+ sensitivity in KO skeletal muscle, we first studied the thin filament regulatory proteins TnI, TnT, TnC and tropomyosin (Tm) and included in the analysis slow and fast skeletal isoforms and both alpha- and beta-Tm. Figure 7 indicates that expression of both fast-isoforms and slow-isoforms of the troponins, normalized to myosin heavy chain, were not significantly different between KO and control EDL. Similar results were found for the relative expression of alpha- and beta-Tm expression. The function of skeletal muscle thin filament proteins does not appear to be regulated through phosphorylation (this in contrast to cardiac muscle (14)). Nevertheless we analyzed the phosphorylation status of thin filament regulatory proteins as well as titin and nebulin in KO vs control skeletal muscle. As shown in figure 7B, the phosphorylation levels of troponin T, troponin I, and MyBP-C (upper panel), and titin and nebulin (lower panel) were not significantly different between KO and control EDL. Based on these analyses we consider it unlikely that changes in thin filament regulatory proteins account for the reduced Ca2+ sensitivity of KO skeletal muscle.
Figure 7.

A) Expression analysis of proteins regulating sarcomeric force generation. Protein levels of tropomyosin isoforms (alpha and beta), and the slow and fast isoforms of troponin I, T, and C (normalized to MHC) were comparable between KO and control EDL muscle. B) Analysis of myofilament protein phosphorylation by Pro-Q Diamond staining. Phophorylation levels of troponin I (TnI), troponin T (TnT), and MyBP-C (normalized to protein levels of TnI, TnT and MyBP-C from Coomassie-blue stained gels) were not significantly different between control and KO EDL (upper panel); similar results were obtained for titin and nebulin (lower panel). Note that the 2-7% gradient gels used for the phosphorylation assays do not resolve the wt and truncated titin T1 band in KO muscle (cf. the 1% agarose gels in figure 2C).
The reduced Ca2+ sensitivity in KO skeletal muscle involves the thick filament
To test whether the reduced Ca2+ sensitivity in KO skeletal muscle is based on changes in thick filaments we evaluated Ca2+-independent cross-bridge formation by exposing skinned EDL preparations to various concentrations of MgATP in the absence of Ca2+ (for typical response, see figure 8A, left panel). In this way, rigor cross-bridge-based thin filament activation can be studied: decreasing the MgATP concentration induces rigor-cross bridge formation, which activates the thin filament and accelerates the attachment of neighbouring cross-bridges to thin filaments, thereby developing force. As shown in figure 8B, the force-MgATP curve was shifted to the left in KO EDL (pMgATP50: 3.98 ± 0.04 and 3.80 ± 0.04, KO and control, respectively) suggesting that the reduced Ca2+ sensitivity of force generation (see above) involves changes downstream from Ca2+ binding to troponin C, presumably at the cross-bridge level. Thus, in skeletal muscle, titin M-band region deficiency reduces Ca2+ sensitivity of force generation, likely through modulation of Ca2+-independent cross-bridge formation.
Figure 8.

Ca2+-independent rigor cross-bridge induced force development. A) Typical chart recording showing the force response of rigorizing skinned EDL muscle and then incrementally increasing MgATP concentrations in the absence of Ca2+. B) Note the leftward shift of the force-MgATP relationship in KO vs control EDL. Inset: the MgATP concentration needed for 50% of maximal rigor force was significantly lower (i.e., higher pMgATP50) in KO vs. control EDL, indicating altered cross-bridge-induced force development in KO vs. control muscle. *: significantly different from control, p<0.05.
To test for molecular changes in thick filament proteins that might explain the reduced Ca2+ sensitivity in KO skeletal muscle, we first focused on myosin and analyzed expression of myosin heavy chain (MHC) isoforms. No significant differences were found in MHC isoform expression between KO and control muscle (figure 9A). We also studied myosin regulatory light chain (MRLC) phosphorylation. As shown in figure 9B, in resting conditions MRLC phosphorylation was similar in KO and control EDL. During intact muscle activation, additional MRLC phosphorylation induces twitch force potentiation (53). To test whether titin M-band deficiency affects twitch force potentiation we measured post-tetanic twitch potentiation in KO and control intact EDL muscle. Figure 9C shows that post-tetanic twitch potentiation was not significantly different between KO and control EDL. Thus, the depressed Ca2+ sensitivity in KO skeletal muscle is not modulated by myosin regulatory light chain phosphorylation.
Figure 9.

Myosin heavy chain isoform and myosin light chain studies. Left: typical SDS-PAGE result; note the predominance of myosin heavy chain (MHC) 2X and 2B isoforms in both KO and control EDL. In addition to control and KO EDL, mouse tibialis cranialis (TC) and soleus were loaded to compare isoform migration. Right panel: Relative MHC isoform expression was comparable between KO and control EDL. B) Left panel: Typical gel result showing myosin regulatory light chain unphosphorylated (MRLC), and phosphorylated MRLC (MRLC-P) (protein identification was based on the relative mobility of the proteins on urea-glycerol PAGE). Right panel: the percentage of MRLC-P to total MRLC was comparable between control and KO EDL. C) Left two panels: Typical chart recording showing twitch-force before and after (superimposed) maximal tetanic stimulation. Right panel: Post-tetanic twitch potentiation was comparable between control and KO EDL muscle.
To study whether changes in myosin binding protein C (MyBP-C) might be involved in reduced Ca2+ sensitivity of force generation in KO skeletal muscle, we determined total MyBP-C expression as well as expression levels of its slow and fast isoforms in EDL muscle. Analysis of MyBP-C isoform expression by Western blotting showed that KO muscle expresses more slow MyBP-C (figure 10A upper panel, KO: 200 ± 15 % of control value, normalized to MHC), and less fast MyBP-C (figure 10B lower panel, KO: 40 ± 7 % of control value, normalized to MHC) when compared to control. Total expression levels of MyBP-C, normalized to MHC expression, were comparable between control and KO muscle (figure 10C, left, 17 ± 3 vs. 17 ± 4 %, respectively).
Figure 10.

Myosin binding protein-C expression and contractile performance in control and TK-DEF EDL muscle before and after MyBP-C extraction. A). Left panel: example of a dual color Western blot with antibodies against the slow isoform of MyBP-C and MHC. Right panel: quantitative analysis showed that, normalized to MHC, KO EDL muscle expressed more slow MyBP-C compared to control EDL. B) Left panel: example of a dual color Western blot with antibodies against the fast isoform of MyBP-C and MHC. Right panel: KO EDL muscle expressed more fast MyBP-C compared to control EDL. C) Total MyBP-C expression (as a percentage of MHC expression) was comparable between KO and control EDL. D) Quantitative analysis of MyBP-C extracted from skinned EDL bundles showed that the extraction procedure resulted in ~70% reduction of MyBP-C content. E) Two left panels: Extraction of MyBP-C did not affect maximum Ca2+-activated stress in skinned EDL muscle. Two right panels: MyBP-C extraction completely abolished the rightward shift of the force-pCa curve in KO EDL muscle. *: significantly different from control, p<0.05.
To test whether the shift in MyBP-C isoform expression contributes to the reduced Ca2+ sensitivity in KO muscle, we determined the force-pCa curve of EDL bundles from which MyBP-C was extracted and compared those to the force-pCa curve of untreated bundles from the same muscles. MyBP-C was extracted as described previously by the Moss group (24;25). To prevent loss of troponin and myosin light chain-2 from the muscle preparations, troponin and light chain-2 were added to the extraction solution (24;25). Consistent with Hofmann et al. (25), the extraction procedure resulted in ~70% loss of MyBP-C (figure 10D); the magnitude of extraction was comparable between control and KO muscle, and the extraction procedure equally affected the MyBP-C isoforms (it should be noted that the content of other myofilament proteins such as myosin heavy chain, actin, troponins, and tropomyosin was not significantly affected by the extraction procedure, data not shown). As shown in figure 7E top, untreated bundles from KO EDL muscle displayed lower Ca2+ sensitivity of force generation (pCa50: 5.92 ± 0.04 and 6.02 ± 0.03; Hill-coefficient: 3.0 ± 0.3 and 4.4 ± 1.1, KO and control, respectively), confirming our previous findings (figure 6B). MyBP-C extraction did not affect maximal force production (figure 10E bottom), which is consistent with previous work (24;25). However, after extraction of MyBP-C the difference in Ca2+ sensitivity between KO and control muscle was abolished (pCa50: 6.02 ± 0.03 and 6.00 ± 0.05; Hill-coefficient: 2.1 ± 0.2 and 2.5 ± 0.2, KO and control, respectively, figure 10E bottom).
DISCUSSION
Whereas our understanding of titin’s Z-line and I-band regions is rapidly increasing, the role of titin’s kinase domain near the M-band remains relatively obscure. Recent work has suggested that the titin kinase region influences cardiac contractility through effects on SR Ca2+ handling (41). So far, the role of titin’s kinase domain in skeletal muscle contractility has not been evaluated. The conditional knock-out model used here, survives until five weeks of age. For our experiments we used the mice at 20 days of age: at that age 30-40% of total titin in skeletal muscle was deficient in the M-band exons MEx1 and MEx2 which encompass the titin kinase region, but muscle weights, body weight, and maximal tetanic force generating capacity were not different from control mice. Moreover, heart weight, left ventricular wall stress and cardiac sarcomeric protein content were unaffected in KO mice, suggesting absence of cardiomyopathy. Thus, by using 20 day old mice we were able to conduct extensive studies on KO skeletal muscle without any apparent confounding secondary myopathic changes. We discovered distinct changes in contractile performance at multiple levels of organization, which appeared to be mediated by altered expression of MyBP-C isoforms. Thus, the present study is the first to suggest that titin’s M-band region affects the expression of genes that are involved in the regulation of skeletal muscle contractile function.
Titin’s M-band region affects skeletal muscle relaxation and submaximal force generation
Using intact muscle preparations we observed faster muscle relaxation, as well as a rightward shift of the force-frequency curve in KO skeletal muscle (figure 4&5). The speed of skeletal muscle relaxation depends on both the sensitivity of the myofilaments for Ca2+ and the speed of Ca2+ reuptake into the SR after stimulation (2). Our data indicate that faster SR Ca2+ reuptake (figure 5) likely contributes to the faster relaxation of intact KO skeletal muscle, and might suggest that titin’s M-band region plays a role in inhibiting SR Ca2+ reuptake and slowing of skeletal muscle relaxation. Unexpectedly, we found no changes in expression of proteins involved in SR Ca2+ handling, except that the SERCA-inhibitor sarcolipin was 8-fold upregulated in EDL of KO mice (figure 5). Previous work (38;45) has shown that upregulation of sarcolipin depresses the rate of Ca2+ reuptake and skeletal muscle relaxation. Interestingly, recent work has shown that sarcolipin can be phosphorylated, and that when phosphorylated it increases the speed of Ca2+ handling (16). Whether phosphorylation of the upregulated sarcolipin in titin M-band KO tissue contributes to the increased Ca2+ reuptake speed warrants further investigation. Alternatively, a yet to be identified mechanism accelerates SR Ca2+ reuptake and muscle relaxation in the absence of titin’s M-band region, and the upregulation of sarcolipin is a cellular adaptation aimed at restoring normal Ca2+ kinetics. An important finding is also the rightward shift of the force-frequency curve in KO skeletal muscle (figure 4C), indicating impaired submaximal force generation. Theoretically, such rightward shift could result from reduced Ca2+ release by the SR at a given stimulation frequency and/or by reduced Ca2+ sensitivity of the myofilaments. However, we found no effect of deletion of titin’s M-band region on the magnitude of Ca2+ release during stimulation of intact single myofibers (figure 5). On the other hand, the force-pCa curve of skinned EDL muscle from KO mice was significantly shifted to the right (figure 6B), thereby providing a myofilament-based mechanism for the depressed submaximal force of intact KO muscle, as well as for the faster muscle relaxation. Importantly, the change in myofilament Ca2+ sensitivity was not muscle-type specific as similar results were found in slow-type soleus muscle from KO mice (figure 6B, right). Previous work in cardiac muscle showed no effect of deletion of titin’s M-band region on Ca2+ sensitivity of force generation (41). Therefore, titin’s M-band region appears to differentially affect myofilament Ca2+ sensitivity in skeletal and cardiac muscle. Expression of different MyBP-C isoforms in skeletal versus cardiac muscle might provide an explanation for this differential affect on Ca2+ sensitivity (further explained below).
The titin M-band-mediated effects on myofilament Ca2+ sensitivity are thick-filament-based
An important determinant of myofilament Ca2+ sensitivity is the activation level of the thin filament. Thin filament activation requires Ca2+ binding to the thin filament regulatory proteins as well as cross-bridge formation. To identify a mechanism for the reduced Ca2+ sensitivity in KO skeletal muscle, we first evaluated the expression levels of thin filament regulatory proteins. As shown in figure 7, we detected no major alterations in expression of the troponin C, T and I isoforms or in tropomyosin expression in KO skeletal muscle. Furthermore, troponin phosphorylation levels were similar in control and KO muscle (figure 7B). Thus, these findings suggest that the observed depression of Ca2+ sensitivity resides outside the thin filament. To explore the role of thick filament based protein we used a technique previously described by Metzger et al. (36) in which skinned fibres are exposed to various concentrations of MgATP (in absence of Ca2+) which allows a Ca2+-independent study of cross-bridge-induced cross-bridge formation. The observed leftward shift of the force-MgATP curve in KO skeletal muscle (figure 8) provides evidence that deficiency of titin’s M-band region suppresses cross-bridge formation by altering MyBP-C expression which in turn affects actomyosin interaction. Taken together these data suggest that the reduced Ca2+ sensitivity of force generation in KO muscle is thick filament-based.
Established thick filament-based modulators of Ca2+ sensitivity in skeletal muscle are MyBP-C expression and myosin regulatory light chain phosphorylation, presumably by regulating cross-bridge displacement away from the thick filament to the thin filament and thereby increasing the likelihood of myosin-actin interaction (7;8;25;32;44;51). Resting phosphorylation levels of myosin regulatory light chain, as well as post-tetanic twitch potentiation, a process caused by myosin regulatory light chain phosphorylation (53), were comparable between control and KO skeletal muscle (figures 9B&C), suggesting that myosin regulatory light chain phosphorylation does not play an important role in the reduced Ca2+ sensitivity in KO skeletal muscle. Previous work by Hoffman et al (25) has shown that MyBP-C plays a role in myofilament Ca2+ sensitivity: extraction of MyBP-C increases Ca2+ sensitivity. MyBP-C is an ~140 kDa protein found in the A-band region of the sarcomere where it associates with the thick filament and binds to myosin and titin (9;30;37;50). Four isoforms of MyBP-C have been described: a cardiac isoform, and three skeletal muscle isoforms (29;34;52). Expression of the three skeletal isoforms shows high correlation with myosin heavy chain isoform expression, and are therefore typed as slow, intermediate, and fast isoforms (34). MyBP-C expression analysis of KO skeletal muscle showed a significant shift in expression towards slow isoforms, without a change in total expression level (figure 10). This shift in MyBP-C expression was not a reflection of altered myosin heavy chain isoform expression, as the distribution of the latter was not different between KO and control muscle (figure 9A). To date, the effects of MyBP-C isoforms on myofilament Ca2+ sensitivity have not been investigated. Therefore, to investigate the physiological significance of this isoform shift in the KO model, we obtained force-pCa relations from EDL preparations from which MyBP-C was selectively extracted. Interestingly, after extraction the previously observed reduced Ca2+ sensitivity in KO EDL was completely abolished (figure 10E), suggesting a role for MyBP-C isoform expression in modulating myofilament Ca2+ sensitivity in KO skeletal muscle. Future studies on MyBP-C-extracted muscle that is reconstituted with fast MyBP-C isoforms are needed to further examine the correlation between MyBP-C isoform expression and Ca2+-sensitivity of force generation. Our observation that the depression of Ca2+ sensitivity in KO skeletal muscle is mediated by MyBP-C isoform changes might explain its absence in cardiac muscle (41): cardiac muscle expresses only one cardiac-specific MyBP-C isoform (11), which precludes an isoform shift, and thus a change in myofilament Ca2+ sensitivity. We did not observe an effect of MyBP-C extraction on Ca2+-sensitivity in control EDL muscle (pCa50: 6.02 ± 0.03 vs 6.00 ± 0.05, pre-extraction vs post-extraction), although the amount of slow MyBP-C in control EDL was decreased by the extraction procedure. This might be explained by the >2-fold lower expression level of slow MyBP-C in controls compared to KO (figure 10A), indicating that the window for slow MyBP-C reduction is much smaller in control EDL. Finally, it should be noted that, unlike the EDL where we observed a shift towards slow MyBP-C in KO, MyBP-C isoform expression in soleus muscle was comparable between KO and control (data not shown). These findings suggest that the MyBP-C isoform shift towards slow isoforms is not universal across skeletal muscles in the KO mice and can not explain the decrease in Ca2+ sensitivity in all muscle types.
So far, in vitro studies have identified only few targets of the titin kinase (33). Although highly speculative, the present study suggests a functional relation between the titin kinase region and MyBP-C that is isoform-specific and regulates skeletal muscle contractility. Yeast-two-hybrid screens did not reveal a direct interaction of the titin kinase with MyBP-C (data not shown) and it is likely therefore that the interaction between titin kinase and MyBP-C is indirect, possibly with titin-binding proteins as intermediates. For instance, MURF-1 has been shown to bind titin’s M-line region (6), and to be localized in the nucleus (35) where it regulates transcription (20). Although our work showed that the total level of MURF-1 was not different in titin M-band deficient muscle (Figure 3), this does not exclude changes in the localization. Therefore, losing the MURF-1 binding site in the M-band region might result in its translocation to the nucleus, where it might affect MyBP-C transcription. Clearly, future studies are required to unravel the mechanism underlying the MyBP-C isoform shift in KO EDL muscle.
In summary, our data suggest that titin’s M-band region affects the expression of genes involved in myofilament Ca2+ sensitivity of force generation and that in the presence of titin’s M-band region, the equilibrium between force and non-force producing cross bridges is shifted towards force production. These effects might prove important for gross muscle function, especially considering that skeletal muscle mainly undergoes submaximal activation during normal daily-life activities. Finally, the present findings might be relevant for understanding of the pathophysiology of myopathies associated with titin and elucidating why different point mutations in titin’s M-band region show distinct muscular phenotypes (21;28;46). Future studies should address whether decreased myofilament Ca2+ sensitivity contributes to skeletal muscle weakness in these patients.
Acknowledgments
We thank Dr. Furst for kindly providing the MyBP-C antibody, Dr. Siegfried Labeit for kindly providing the antibodies X148a-149 against MURF-1, and 1867/07#5 against sarcolipin, and Dr. Szczesna for providing the skeletal muscle troponin and light chain-2 proteins. We are grateful to Diana Acuna, Luann Wyly, Eric Rogers, and Gem Stark, for expert technical assistance. This work was supported by a Rubicon postdoctoral grant from the Dutch Organization for Scientific Research to C.O., by the German Research Foundation (DFG, KFO 192) to M.G., and by U.S. National Institutes of Health grant HL062881 to H.G.
Footnotes
Publisher's Disclaimer: This is a PDF file of an unedited manuscript that has been accepted for publication. As a service to our customers we are providing this early version of the manuscript. The manuscript will undergo copyediting, typesetting, and review of the resulting proof before it is published in its final citable form. Please note that during the production process errors may be discovered which could affect the content, and all legal disclaimers that apply to the journal pertain.
Reference List
- 1.Agarkova I, Perriard JC. The M-band: an elastic web that crosslinks thick filaments in the center of the sarcomere. Trends Cell Biol. 2005;15:477–485. doi: 10.1016/j.tcb.2005.07.001. [DOI] [PubMed] [Google Scholar]
- 2.Berchtold MW, Brinkmeier H, Muntener M. Calcium ion in skeletal muscle: its crucial role for muscle function, plasticity, and disease. Physiol Rev. 2000;80:1215–1265. doi: 10.1152/physrev.2000.80.3.1215. [DOI] [PubMed] [Google Scholar]
- 3.Bodine SC, Latres E, Baumhueter S, Lai VK, Nunez L, Clarke BA, Poueymirou WT, Panaro FJ, Na E, Dharmarajan K, Pan ZQ, Valenzuela DM, DeChiara TM, Stitt TN, Yancopoulos GD, Glass DJ. Identification of ubiquitin ligases required for skeletal muscle atrophy. Science. 2001;294:1704–1708. doi: 10.1126/science.1065874. [DOI] [PubMed] [Google Scholar]
- 4.Bruton JD, Dahlstedt AJ, Abbate F, Westerblad H. Mitochondrial function in intact skeletal muscle fibres of creatine kinase deficient mice. J Physiol. 2003;552:393–402. doi: 10.1113/jphysiol.2003.050732. [DOI] [PMC free article] [PubMed] [Google Scholar]
- 5.Capote J, Bolanos P, Schuhmeier RP, Melzer W, Caputo C. Calcium transients in developing mouse skeletal muscle fibres. J Physiol. 2005;564:451–464. doi: 10.1113/jphysiol.2004.081034. [DOI] [PMC free article] [PubMed] [Google Scholar]
- 6.Centner T, Yano J, Kimura E, McElhinny AS, Pelin K, Witt CC, Bang ML, Trombitas K, Granzier H, Gregorio CC, Sorimachi H, Labeit S. Identification of muscle specific ring finger proteins as potential regulators of the titin kinase domain. J. Mol. Biol. 2001;306:717–726. doi: 10.1006/jmbi.2001.4448. [DOI] [PubMed] [Google Scholar]
- 7.Colson BA, Bekyarova T, Fitzsimons DP, Irving TC, Moss RL. Radial displacement of myosin cross-bridges in mouse myocardium due to ablation of myosin binding protein-C. J Mol Biol. 2007;367:36–41. doi: 10.1016/j.jmb.2006.12.063. [DOI] [PMC free article] [PubMed] [Google Scholar]
- 8.Colson BA, Bekyarova T, Locher MR, Fitzsimons DP, Irving TC, Moss RL. Protein kinase A-mediated phosphorylation of cMyBP-C increases proximity of myosin heads to actin in resting myocardium. Circ. Res. 2008;103:244–251. doi: 10.1161/CIRCRESAHA.108.178996. [DOI] [PMC free article] [PubMed] [Google Scholar]
- 9.Craig R, Offer G. The location of C-protein in rabbit skeletal muscle. Proc. R. Soc. Lond B Biol. Sci. 1976;192:451–461. doi: 10.1098/rspb.1976.0023. [DOI] [PubMed] [Google Scholar]
- 10.Fabiato A, Fabiato F. Calculator programs for computing the composition of the solutions containing multiple metals and ligands used for experiments in skinned muscle cells. J Physiol Paris. 1979;75:463–505. [PubMed] [Google Scholar]
- 11.Flashman E, Redwood C, Moolman-Smook J, Watkins H. Cardiac myosin binding protein C: its role in physiology and disease. Circ. Res. 2004;94:1279–1289. doi: 10.1161/01.RES.0000127175.21818.C2. [DOI] [PubMed] [Google Scholar]
- 12.Fukuzawa A, Lange S, Holt M, Vihola A, Carmignac V, Ferreiro A, Udd B, Gautel M. Interactions with titin and myomesin target obscurin and obscurin-like 1 to the M-band: implications for hereditary myopathies. J Cell Sci. 2008;121:1841–1851. doi: 10.1242/jcs.028019. [DOI] [PubMed] [Google Scholar]
- 13.Gong B, Legault D, Miki T, Seino S, Renaud JM. KATP channels depress force by reducing action potential amplitude in mouse EDL and soleus muscle. Am. J Physiol Cell Physiol. 2003;285:C1464–C1474. doi: 10.1152/ajpcell.00278.2003. [DOI] [PubMed] [Google Scholar]
- 14.Gordon AM, Homsher E, Regnier M. Regulation of contraction in striated muscle. Physiol Rev. 2000;80:853–924. doi: 10.1152/physrev.2000.80.2.853. [DOI] [PubMed] [Google Scholar]
- 15.Gotthardt M, Hammer RE, Hubner N, Monti J, Witt CC, McNabb M, Richardson JA, Granzier H, Labeit S, Herz J. Conditional expression of mutant M-line titins results in cardiomyopathy with altered sarcomere structure. J. Biol. Chem. 2003;278:6059–6065. doi: 10.1074/jbc.M211723200. [DOI] [PubMed] [Google Scholar]
- 16.Gramolini AO, Trivieri MG, Oudit GY, Kislinger T, Li W, Patel MM, Emili A, Kranias EG, Backx PH, MacLennan DH. Cardiac-specific overexpression of sarcolipin in phospholamban null mice impairs myocyte function that is restored by phosphorylation. Proc. Natl. Acad. Sci U. S. A. 2006;103:2446–2451. doi: 10.1073/pnas.0510883103. [DOI] [PMC free article] [PubMed] [Google Scholar]
- 17.Granzier HL, Irving TC. Passive tension in cardiac muscle: contribution of collagen, titin, microtubules, and intermediate filaments. Biophys. J. 1995;68:1027–1044. doi: 10.1016/S0006-3495(95)80278-X. [DOI] [PMC free article] [PubMed] [Google Scholar]
- 18.Granzier HL, Labeit S. The giant protein titin: a major player in myocardial mechanics, signaling, and disease. Circ. Res. 2004;94:284–295. doi: 10.1161/01.RES.0000117769.88862.F8. [DOI] [PubMed] [Google Scholar]
- 19.Granzier HL, Wang K. Interplay between passive tension and strong and weak binding cross-bridges in insect indirect flight muscle. A functional dissection by gelsolin-mediated thin filament removal. J Gen. Physiol. 1993;101:235–270. doi: 10.1085/jgp.101.2.235. [DOI] [PMC free article] [PubMed] [Google Scholar]
- 20.Gregorio CC, Perry CN, McElhinny AS. Functional properties of the titin/connectin-associated proteins, the muscle-specific RING finger proteins (MURFs), in striated muscle. J Muscle Res. Cell Motil. 2005;26:389–400. doi: 10.1007/s10974-005-9021-x. [DOI] [PubMed] [Google Scholar]
- 21.Hackman P, Vihola A, Haravuori H, Marchand S, Sarparanta J, De Seze J, Labeit S, Witt C, Peltonen L, Richard I, Udd B. Tibial muscular dystrophy is a titinopathy caused by mutations in TTN, the gene encoding the giant skeletal-muscle protein titin. Am. J Hum. Genet. 2002;71:492–500. doi: 10.1086/342380. [DOI] [PMC free article] [PubMed] [Google Scholar]
- 22.Han R, Grounds MD, Bakker AJ. Measurement of sub-membrane [Ca2+] in adult myofibers and cytosolic [Ca2+] in myotubes from normal and mdx mice using the Ca2+ indicator FFP-18. Cell Calcium. 2006;40:299–307. doi: 10.1016/j.ceca.2006.04.016. [DOI] [PubMed] [Google Scholar]
- 23.Hidalgo C, Wu Y, Peng J, Siems WF, Campbell KB, Granzier H. Effect of diastolic pressure on MLC2v phosphorylation in the rat left ventricle. Arch. Biochem. Biophys. 2006;456:216–223. doi: 10.1016/j.abb.2006.06.026. [DOI] [PubMed] [Google Scholar]
- 24.Hofmann PA, Greaser ML, Moss RL. C-protein limits shortening velocity of rabbit skeletal muscle fibres at low levels of Ca2+ activation. J Physiol. 1991;439:701–715. doi: 10.1113/jphysiol.1991.sp018689. [DOI] [PMC free article] [PubMed] [Google Scholar]
- 25.Hofmann PA, Hartzell HC, Moss RL. Alterations in Ca2+ sensitive tension due to partial extraction of C-protein from rat skinned cardiac myocytes and rabbit skeletal muscle fibers. J Gen. Physiol. 1991;97:1141–1163. doi: 10.1085/jgp.97.6.1141. [DOI] [PMC free article] [PubMed] [Google Scholar]
- 26.Labeit S, Gautel M, Lakey A, Trinick J. Towards a molecular understanding of titin. EMBO J. 1992;11:1711–1716. doi: 10.1002/j.1460-2075.1992.tb05222.x. [DOI] [PMC free article] [PubMed] [Google Scholar]
- 27.Lange S, Auerbach D, McLoughlin P, Perriard E, Schafer BW, Perriard JC, Ehler E. Subcellular targeting of metabolic enzymes to titin in heart muscle may be mediated by DRAL/FHL-2. J Cell Sci. 2002;115:4925–4936. doi: 10.1242/jcs.00181. [DOI] [PubMed] [Google Scholar]
- 28.Lange S, Xiang F, Yakovenko A, Vihola A, Hackman P, Rostkova E, Kristensen J, Brandmeier B, Franzen G, Hedberg B, Gunnarsson LG, Hughes SM, Marchand S, Sejersen T, Richard I, Edstrom L, Ehler E, Udd B, Gautel M. The kinase domain of titin controls muscle gene expression and protein turnover. Science. 2005;308:1599–1603. doi: 10.1126/science.1110463. [DOI] [PubMed] [Google Scholar]
- 29.Locker RH, Wild DJ. A comparative study of high molecular weight proteins in various types of muscle across the animal kingdom. J Biochem. 1986;99:1473–1484. doi: 10.1093/oxfordjournals.jbchem.a135617. [DOI] [PubMed] [Google Scholar]
- 30.Luther PK, Bennett PM, Knupp C, Craig R, Padron R, Harris SP, Patel J, Moss RL. Understanding the organisation and role of myosin binding protein C in normal striated muscle by comparison with MyBP-C knockout cardiac muscle. J Mol Biol. 2008;384:60–72. doi: 10.1016/j.jmb.2008.09.013. [DOI] [PMC free article] [PubMed] [Google Scholar]
- 31.Matar W, Nosek TM, Wong D, Renaud J. Pinacidil suppresses contractility and preserves energy but glibenclamide has no effect during muscle fatigue. Am. J Physiol Cell Physiol. 2000;278:C404–C416. doi: 10.1152/ajpcell.2000.278.2.C404. [DOI] [PubMed] [Google Scholar]
- 32.Maughan DW. Kinetics and energetics of the crossbridge cycle. Heart Fail. Rev. 2005;10:175–185. doi: 10.1007/s10741-005-5248-2. [DOI] [PubMed] [Google Scholar]
- 33.Mayans O, van der Ven PF, Wilm M, Mues A, Young P, Furst DO, Wilmanns M, Gautel M. Structural basis for activation of the titin kinase domain during myofibrillogenesis. Nature. 1998;395:863–869. doi: 10.1038/27603. [DOI] [PubMed] [Google Scholar]
- 34.McCormick KM, Baldwin KM, Schachat F. Coordinate changes in C protein and myosin expression during skeletal muscle hypertrophy. Am. J Physiol. 1994;267:C443–C449. doi: 10.1152/ajpcell.1994.267.2.C443. [DOI] [PubMed] [Google Scholar]
- 35.McElhinny AS, Kakinuma K, Sorimachi H, Labeit S, Gregorio CC. Muscle-specific RING finger-1 interacts with titin to regulate sarcomeric M-line and thick filament structure and may have nuclear functions via its interaction with glucocorticoid modulatory element binding protein-1. J. Cell Biol. 2002;157:125–136. doi: 10.1083/jcb.200108089. [DOI] [PMC free article] [PubMed] [Google Scholar]
- 36.Metzger JM. Myosin binding-induced cooperative activation of the thin filament in cardiac myocytes and skeletal muscle fibers. Biophys. J. 1995;68:1430–1442. doi: 10.1016/S0006-3495(95)80316-4. [DOI] [PMC free article] [PubMed] [Google Scholar]
- 37.Moss RL. Ca2+ regulation of mechanical properties of striated muscle. Mechanistic studies using extraction and replacement of regulatory proteins. Circ. Res. 1992;70:865–884. doi: 10.1161/01.res.70.5.865. [DOI] [PubMed] [Google Scholar]
- 38.Ottenheijm CA, Fong C, Vangheluwe P, Wuytack F, Babu GJ, Periasamy M, Witt CC, Labeit S, Granzier H. Sarcoplasmic reticulum calcium uptake and speed of relaxation are depressed in nebulin-free skeletal muscle. FASEB J. 2008;22:2912–2919. doi: 10.1096/fj.07-104372. [DOI] [PMC free article] [PubMed] [Google Scholar]
- 39.Ottenheijm CAC, Heunks LM, Geraedts MC, Dekhuijzen PN. Hypoxia-induced skeletal muscle fiber dysfunction: role for reactive nitrogen species. Am. J. Physiol Lung Cell Mol. Physiol. 2006;290:L127–L135. doi: 10.1152/ajplung.00073.2005. [DOI] [PubMed] [Google Scholar]
- 40.Peng J, Raddatz K, Labeit S, Granzier H, Gotthardt M. Muscle atrophy in titin M-line deficient mice. J Muscle Res. Cell Motil. 2005;26:381–388. doi: 10.1007/s10974-005-9020-y. [DOI] [PubMed] [Google Scholar]
- 41.Peng J, Raddatz K, Molkentin JD, Wu Y, Labeit S, Granzier H, Gotthardt M. Cardiac hypertrophy and reduced contractility in hearts deficient in the titin kinase region. Circulation. 2007;115:743–751. doi: 10.1161/CIRCULATIONAHA.106.645499. [DOI] [PubMed] [Google Scholar]
- 42.Pinniger GJ, Bruton JD, Westerblad H, Ranatunga KW. Effects of a myosin-II inhibitor (N-benzyl-p-toluene sulphonamide, BTS) on contractile characteristics of intact fast-twitch mammalian muscle fibres. J Muscle Res. Cell Motil. 2005;26:135–141. doi: 10.1007/s10974-005-2679-2. [DOI] [PubMed] [Google Scholar]
- 43.Puchner EM, Alexandrovich A, Kho AL, Hensen U, Schafer LV, Brandmeier B, Grater F, Grubmuller H, Gaub HE, Gautel M. Mechanoenzymatics of titin kinase. Proc. Natl. Acad. Sci U. S. A. 2008;105:13385–13390. doi: 10.1073/pnas.0805034105. [DOI] [PMC free article] [PubMed] [Google Scholar]
- 44.Stelzer JE, Fitzsimons DP, Moss RL. Ablation of myosin-binding protein-C accelerates force development in mouse myocardium. Biophys. J. 2006;90:4119–4127. doi: 10.1529/biophysj.105.078147. [DOI] [PMC free article] [PubMed] [Google Scholar]
- 45.Tupling AR, Asahi M, MacLennan DH. Sarcolipin overexpression in rat slow twitch muscle inhibits sarcoplasmic reticulum Ca2+ uptake and impairs contractile function. J Biol. Chem. 2002;277:44740–44746. doi: 10.1074/jbc.M206171200. [DOI] [PubMed] [Google Scholar]
- 46.Van den Bergh PY, Bouquiaux O, Verellen C, Marchand S, Richard I, Hackman P, Udd B. Tibial muscular dystrophy in a Belgian family. Ann. Neurol. 2003;54:248–251. doi: 10.1002/ana.10647. [DOI] [PubMed] [Google Scholar]
- 47.Wang ZM, Messi ML, Delbono O. Sustained overexpression of IGF-1 prevents age-dependent decrease in charge movement and intracellular Ca(2+) in mouse skeletal muscle. Biophys. J. 2002;82:1338–1344. doi: 10.1016/S0006-3495(02)75489-1. [DOI] [PMC free article] [PubMed] [Google Scholar]
- 48.Warren CM, Krzesinski PR, Greaser ML. Vertical agarose gel electrophoresis and electroblotting of high-molecular-weight proteins. Electrophoresis. 2003;24:1695–1702. doi: 10.1002/elps.200305392. [DOI] [PubMed] [Google Scholar]
- 49.Weinert S, Bergmann N, Luo X, Erdmann B, Gotthardt M. M line-deficient titin causes cardiac lethality through impaired maturation of the sarcomere. J Cell Biol. 2006;173:559–570. doi: 10.1083/jcb.200601014. [DOI] [PMC free article] [PubMed] [Google Scholar]
- 50.Winegrad S. Myosin-binding protein C (MyBP-C) in cardiac muscle and contractility. Adv. Exp. Med. Biol. 2003;538:31–40. doi: 10.1007/978-1-4419-9029-7_3. [DOI] [PubMed] [Google Scholar]
- 51.Yang Z, Stull JT, Levine RJ, Sweeney HL. Changes in interfilament spacing mimic the effects of myosin regulatory light chain phosphorylation in rabbit psoas fibers. J Struct. Biol. 1998;122:139–148. doi: 10.1006/jsbi.1998.3979. [DOI] [PubMed] [Google Scholar]
- 52.Yu F, Stal P, Thornell LE, Larsson L. Human single masseter muscle fibers contain unique combinations of myosin and myosin binding protein C isoforms. J Muscle Res. Cell Motil. 2002;23:317–326. doi: 10.1023/a:1022061706126. [DOI] [PubMed] [Google Scholar]
- 53.Zhi G, Ryder JW, Huang J, Ding P, Chen Y, Zhao Y, Kamm KE, Stull JT. Myosin light chain kinase and myosin phosphorylation effect frequency-dependent potentiation of skeletal muscle contraction. Proc. Natl. Acad. Sci U. S. A. 2005;102:17519–17524. doi: 10.1073/pnas.0506846102. [DOI] [PMC free article] [PubMed] [Google Scholar]