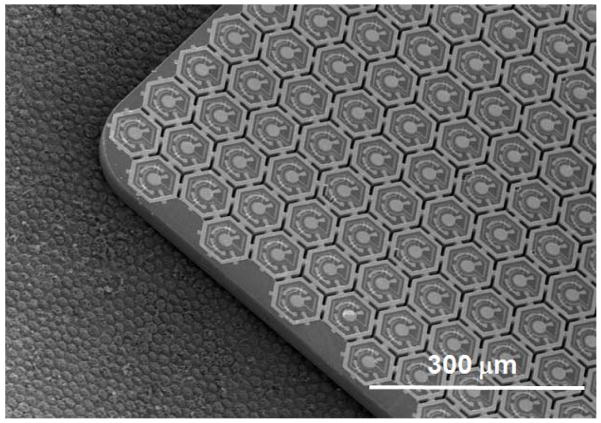
Abstract
Objective
To develop and test a photovoltaic retinal prosthesis for restoring sight to patients blinded by degenerative retinal diseases.
Approach
A silicon photodiode array for subretinal stimulation has been fabricated by a silicon-integrated-circuit/MEMS process. Each pixel in the two-dimensional array contains three series-connected photodiodes, which photovoltaically convert pulsed near-infrared light into bi-phasic current to stimulate nearby retinal neurons without wired power connections. The device thickness is chosen to be 30 μm to absorb a significant portion of light while still being thin enough for subretinal implantation. Active and return electrodes confine current near each pixel and are sputter coated with iridium oxide to enhance charge injection levels and provide a stable neural interface. Pixels are separated by 5 μm-wide trenches to electrically isolate them and to allow nutrient diffusion through the device. Three sizes of pixels (280μm, 140 μm, and 70 μm) with active electrodes of 80 μm, 40 μm and 20 μm in diameter were fabricated.
Main results
The turn-on voltages of one-, two- and three-series-connected photodiode structures are approximately 0.6V, 1.2V and 1.8V, respectively. The measured photo-responsivity per diode at 880 nm wavelength is ~0.36 A/W, at zero voltage bias and scales with the exposed silicon area. For all three pixel sizes, the reverse-bias dark current is sufficiently low (<100 pA) for our application. Pixels of all three sizes reliably elicit retinal responses at safe near-infrared light irradiances, with good acceptance of the photodiode array in the subretinal space.
Significance
The fabricated device delivers efficient retinal stimulation at safe near-infrared light irradiances without any wired power connections, which greatly simplifies the implantation procedure. Presence of the return electrodes in each pixel helps to localize the current, and thereby improves resolution.
Keywords: retinal prosthesis, photodiode, photovoltaic, photo-responsivity, MEMS
1. Introduction
Restoration of sight to patients blinded by retinal degeneration using an electronic retinal prosthesis is currently being studied by several research groups [1–5]. In diseases such as Retinitis Pigmentosa (RP) and Age-Related Macular Degeneration (AMD), the photoreceptor layer slowly dies out while the inner retinal neurons are preserved to a large extent [6–8]. One approach to deliver information to the visual system in such conditions is by patterned electrical stimulation of the remaining retinal circuitry. Electrical stimulation of the remaining neural cells in the retina has been achieved by positioning the electrode array either epiretinally, to interface with the retinal ganglion cells [9–11], or subretinally, to substitute for the degenerated photoreceptors and stimulate the inner retinal neurons (bipolar, amacrine and horizontal cells) [12–14]. Recent studies with patients implanted with the epiretinal ARGUS II prosthesis system (Second Sight® Medical Products, Inc., Sylmar, CA) show improvements of visual function in certain tasks; some patients were able to identify letters, with equivalent visual acuity up to 20/1200 [15–18]. In that system the number of electrodes is limited to 60 and visual information is not linked to eye movements [19]. Subretinal stimulation of the non-spiking inner retinal neurons allows for natural conversion into burst spiking of the retinal ganglion cells. Such utilization of the natural retinal signal processing may result in more natural spiking patterns in response to pulsed stimulation than the direct activation of the ganglion cells in the epiretinal approach. The recent clinical testing by Retina Implant AG shows that subretinally implanted video camera with micro-electrode array provides meaningful visual information to blind patients [19]. However, that implant requires an extraocular power supply to amplify the signals of the photosensitive pixels, which makes the implantation procedure quite complex [19]. Another disadvantage in this version of the subretinal prosthesis is the lack of local return electrodes in each pixel, which is likely to increase the cross-talk between pixels having a common global return. This may explain why, despite the much larger number of pixels in the subretinal implant (1500), the resulting visual acuity in RP patients was similar to the 60-electrode ARGUS II implant: 20/1200 [19].
We designed an optoelectronic prosthetic system in which each pixel of the subretinal array photovoltaically converts patterned pulsed near-infrared (NIR) light projected from video goggles into pulses of bi-phasic electric current to stimulate the nearby retinal neurons [20, 21, 22]. The advantages of this system include: parallel optical transmission of visual information to each pixel; adjustable stimulation parameters (pulse intensity, duration and repetition rate) and image processing algorithms; the capability to superimpose NIR images on any remaining natural vision; and preservation of the natural link between eye movements and visual information [20, 21]. The photodiode array is operated photovoltaically, which avoids complex wired power connections, greatly simplifies the surgical procedure and reduces the chances of infections associated with trans-scleral cables used in powered implants. Each pixel has a local return electrode, which reduces the spatial spread of the electrical stimulation, therefore reducing cross-talk between pixels and improving the spatial resolution of the implant. Each pixel contains three series-connected, trench-isolated photodiodes to increase charge injection levels [22]. Trenches are open between pixels to allow perfusion of nutrient during in-vitro electrophysiological experiments and may help with the integration of the implant with the retina in-vivo. Several arrays could be juxtaposed to tile a larger area and thereby expand visual field. Three sizes of pixels are fabricated to explore the maximum resolution of the implant. We present here the fabrication process of the silicon photodiode array, characterization of its optoelectronic performance, and initial electrophysiological results of retinal stimulation in-vitro and in-vivo.
2. Materials and methods
2.1. Device design and fabrication
We have fabricated photodiode arrays with pixel sizes of 280 μm, 140 μm and 70 μm on lightly boron-doped silicon-on-insulator (SOI) wafers with resistivity of 1–50 Ω·cm. Due to the relatively weak absorption of silicon at wavelengths around 880 nm (α=383 cm−1) [23], we have chosen SOI wafers with 30 μm thick device layer to absorb a significant fraction (~70%) of light while still being thin enough to be implanted underneath the retina. To optimize the stimulation voltage and maximize charge injection levels, each pixel contains three photodiodes connected in series [22]. An active and a return electrode in each pixel confine current flow to provide a localized stimulation of nearby retinal neurons. The electrodes are sputter coated with iridium oxide to provide a high charge-injection, stable neural interface [22]. An anti-reflection coating consisting of 60 nm of thermal silicon dioxide and 70 nm of silicon nitride is chosen to minimize light reflection from the device surface immersed in water, as calculated according to the multiple reflection method for electromagnetic waves propagating in layered dielectric structures [24].
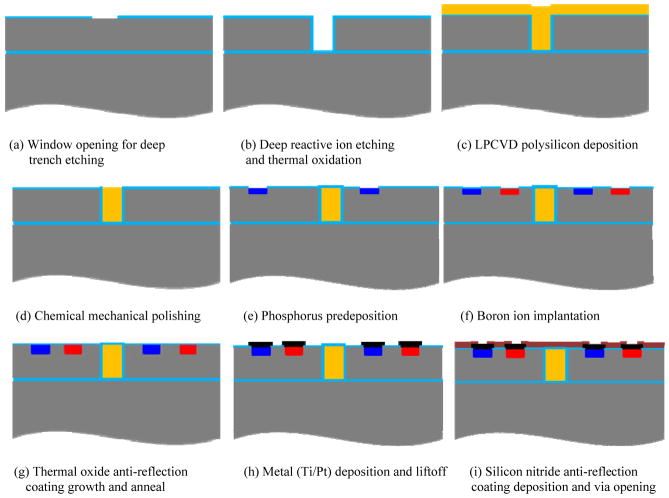
The fabrication process consists of eight mask layers: deep reactive-ion etching (DRIE) for in-pixel photodiode isolation, n+ region doping to form the pn junction, p+ region doping to make ohmic contacts, first via opening, first metal (Ti/Pt) deposition and liftoff, second via opening, removal of polysilicon in selected trenches, and second metal (iridium oxide) deposition and liftoff. The process steps are discussed below and illustrated in detail in figure 1.
Figure 1.
Fabrication process flow.
2.1.1. Deep trench isolation
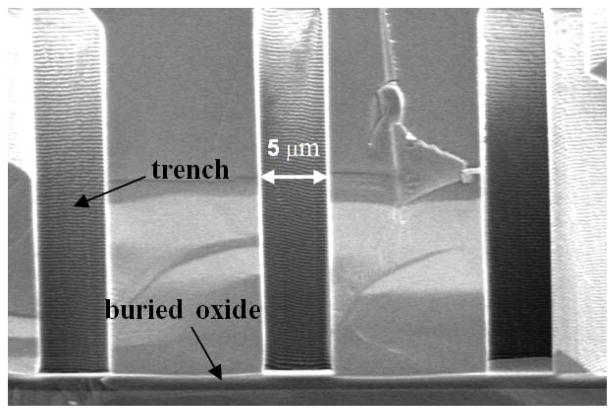
First, the SOI wafers are oxidized in steam at 1000°C to grow a 500 nm thermal oxide to provide a hard mask for the following DRIE process. Photolithography then defines the patterns for the isolation trench etch with the first mask layer. Oxide on top of the opened regions is removed by dry etching, as shown in figure 1(a). Next, a DRIE process etches the 5 μm wide, 30 μm deep trenches (figure 1(b)). The DRIE process alternates between the passivating C4F8 plasma and the silicon etching SF6 plasma, which results in a deep trench profile with vertical and smooth sidewalls, as shown in figure 2. Next, 500 nm of thermally grown oxide passivates the sidewalls and provides isolation between pixels. Then 4 μm polysilicon is deposited by a low-pressure chemical vapour deposition (LPCVD) process, which fills the trenches and planarizes the wafer surface, as shown in figure 1(c). The scanning electron microscope (SEM) image in figure 3 shows that the LPCVD process is conformal so that the trenches are filled and the wafer surface is planarized. Then the 4 μm polysilicon layer on the wafer surface is removed by a chemical mechanical polishing (CMP) process, which stops on the 500 nm thermal oxide layer (figure 1(d)).
Figure 2.
Cross-sectional SEM of trench profile after DRIE etch.
Figure 3.
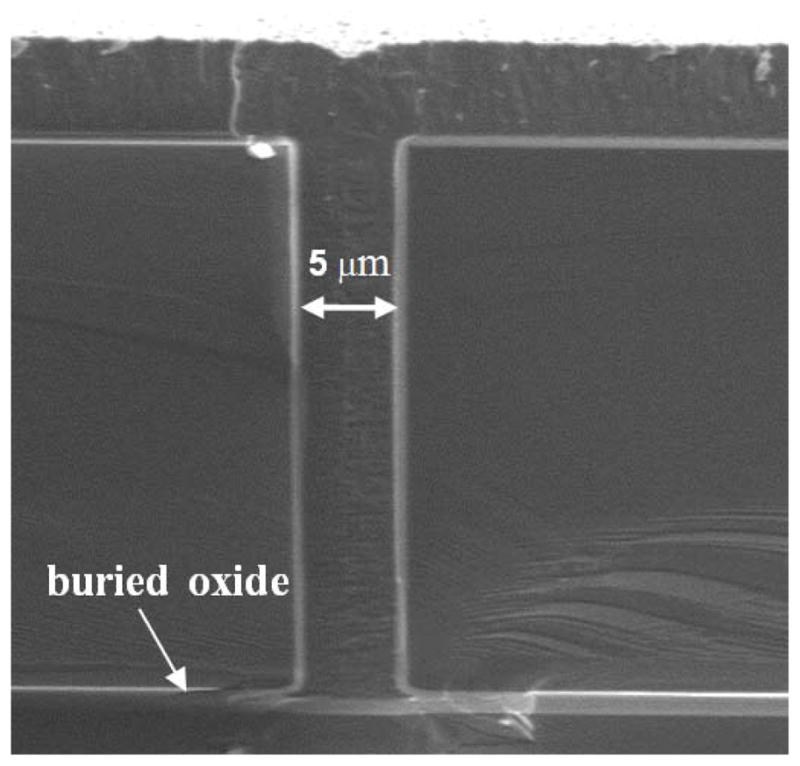
Polysilicon deposited by LPCVD fills trenches (SEM).
2.1.2. pn junction formation
After isolation trench etch and wafer planarization as described in section 2.1.1, a phosphorus pre-deposition process heavily dopes the opened n+ regions to a sheet resistance of about 4 Ω /sq, which forms the pn junctions as well as ohmic contacts to the following metal layers (figure 1(e)). After forming n+ regions, about 260 nm of oxide is grown on top of the n+ regions to block the subsequent boron implantation. Then the p+ regions are opened by dry etching the oxide on top. 13 nm of screen oxide is then grown by a dry oxidation process. The p+ regions are formed by ion implantation of B11 singly charged boron at 20 keV with a dose of 1.3×1015 cm−2 to make an ohmic contact with the subsequent metal layer (figure 1(f)).
2.1.3. Anti-reflection coating and electrode formation
After forming the pn junctions and highly doped contact regions as described in section 2.1.2, a buffered oxide etch (BOE) removes all of the oxide on top of the wafer, and an 80 nm thermal oxide layer is grown by a dry oxidation process to form part of the anti-reflection coating. A 75-minute thermal anneal at 1000°C drives in the dopant to the desired depth (figure 1(g)). Next, the oxide is etched on top of the via regions inside each of the series-connected photodiodes. The first metal layer (20 nm Ti/ 250 nm Pt) is deposited to connect the three in-pixel photodiodes in series (figure 1(h)). A 70 nm silicon nitride layer is deposited by plasma enhanced chemical vapour deposition to provide electrical isolation and form the second layer of the anti-reflection coating. Then vias are opened to connect to the following iridium oxide layer (figure 1(i)). Polysilicon is removed from the trenches between pixels by XeF2 etching to allow diffusion of nutrient during in-vitro and in-vivo testing (figure 1(j)). Due to the highly structured topology of the wafer, we spray coat a thick layer of photoresist into the trenches, remove the thick photoresist layer from the top and re-spin a thin layer of photoresist to define the patterns for the second metal layer. Iridium oxide is then sputter deposited and lifted off to form the active and return electrodes (figure 1(k)). The thick photoresist is removed from the trenches during the metal lift-off stage.
2.1.4. Release of photodiode arrays
The handle wafer is then removed by backside grinding and Tetramethylammonium hydroxide (TMAH) etching, as follows: first, the top surface of the wafer is protected by a 7 μm layer of ProTEK (Brewer Science, Inc.) and a UV release tape; then the backside of the wafer is thinned from 500 μm to 80μm by grinding; next, a 90°C, 10% TMAH solution [25] etches the remaining silicon of the handle wafer and stops on the buried oxide layer; finally, the surface protective ProTEK layer is removed by acetone, and a short ultrasonic process breaks the suspended buried oxide at the bottom of the trenches between pixels to release the arrays (figure 1(l)).
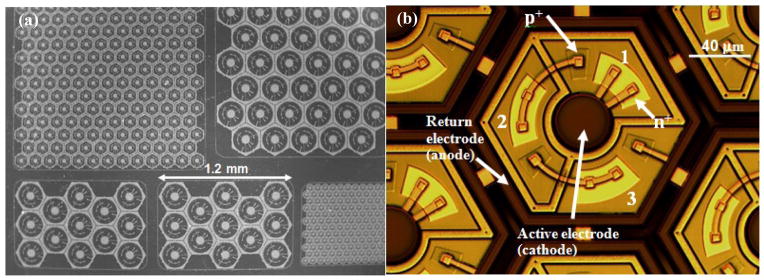
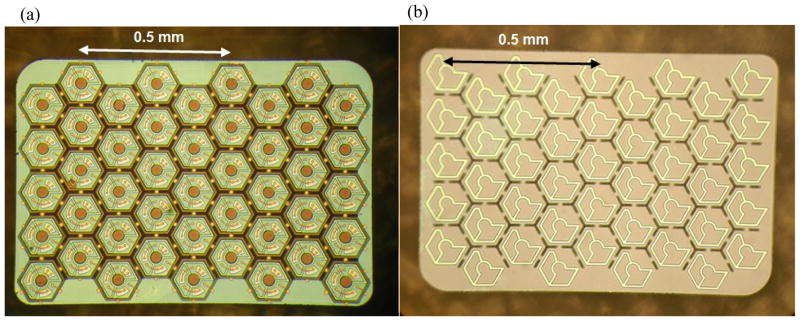
We have fabricated arrays with an overall size of 1.9 mm × 1.9 mm for implantation into large animals and 0.8 mm × 1.2 mm for implantation into rats. SEM images of the small-, medium- and large-pixel arrays on a 4 inch wafer are shown in figure 4(a). Figure 4(b) shows an optical microscope image of an array with medium-size pixels. Under illumination, photocurrent flows into the central active electrode, through the series-connected diodes, and flows out of the concentric return electrode in each pixel. Optical microscope images of the released arrays with medium-size pixels are shown in figure 5. The stimulating electrode array is located on the front side of the array, as shown in figure 5(a). The back-side image of the array shows open trenches (dark hexagonal lines) between the pixels to allow nutrient flow (figure 5(b)). The yellow lines within each pixel show the back of the polysilicon-filled trenches that provide electrical isolation between the three diodes within the pixel.
Figure 4.
(a) SEM image of the large-, medium- and small-pixel arrays on a 4-inch wafer. (b) Optical microscope image of a medium-size pixel showing the central active electrode (cathode) and local concentric return electrode (anode). Diodes 1, 2 and 3 are connected in series; with the n+ and p+ regions of diode 1 indicated in the figure. Under illumination, photocurrent flows into the central active electrode, through the series-connected diodes, and flows out of the concentric return electrode.
Figure 5.
Optical microscope images of the released arrays with medium-size pixels showing (a) the front side and (b) the back side of the device. Open trenches for nutrient flow can be seen as the dark lines between the pixels. The yellow lines within each pixel are the polysilicon filled trenches. The colour difference within each pixel is due to the different thickness of oxide: ~500 nm inside the trenches compared to 100 nm over the rest of the back surface.
2.2. Optoelectronic measurements
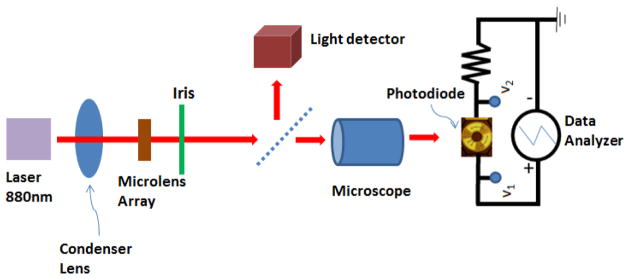
The schematic of the optical measurement setup is shown in figure 6. A 1 kΩ resistor is connected in series with the device under test. The external voltage is swept from −4.5 volts to 1 volt across the device and the resistor, as shown in the figure. The sweeping voltage (V1), the voltage across the 1 kΩ resistor (V2) and the light power measured by the light detector are recorded. To correlate the light intensity on the device with the values recorded by the system we measured the incident light power at the plane of the device.
Figure 6.
Schematic of the system used for optical measurements.
2.3. Electrophysiological testing
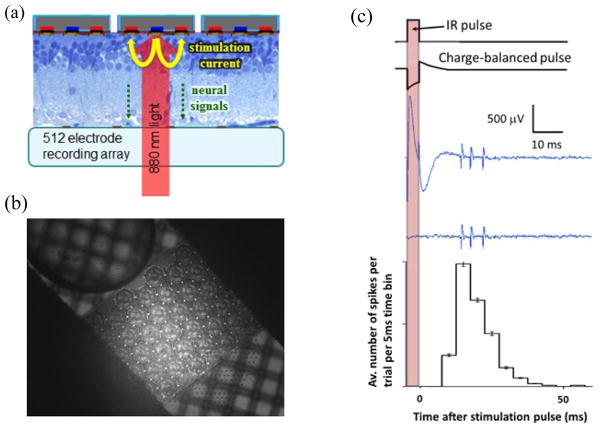
The subretinal prosthesis was evaluated in-vitro using a high-density microelectrode array (MEA) system [26]. Briefly, it consists of 512 independent recording channels, each sampled at 20 kHz. The electrodes are spaced at 60 μm and measure 5 μm in diameter. The system is capable of recording extracellular action potentials from hundreds of neurons simultaneously. Data is processed off-line for further analysis, where spike sorting routines are used to attribute individual action potentials to specific neurons. The electrophysiological experiments began with enucleation of the eye from an anesthetized (35 mg/kg ketamine, 5 mg/kg xylazine, 0.01 mg/kg glycopyrrolate) Long-Evans rat (age 60 days) that was subsequently euthanized. A small piece of retina (~ 3 mm × 3 mm) was isolated and placed retinal ganglion cells (RGC) side down on the recording array with the prosthesis chip placed on the photoreceptor side. This is shown schematically in figure 7(a) and its optical microscope image is shown in figure 7(b). The retina was perfused with Ames’ solution bubbled with 95% oxygen and 5% carbon dioxide and kept at 25 to 30°C.
Figure 7.
(a) A schematic of the experimental setup. The retina is placed between the recording array (ganglion cell side) and the photodiode array (photoreceptor side). (b) Optical microscope image of the implant chip on top of the MEA with the retina in between. Picture was taken by a camera placed at the bottom-side of the transparent MEA. Transmission illumination by visible light allows imaging the MEA, while 880 nm illumination reflected off the prosthesis surface, passes through a 50% mirror onto the CCD camera. (c) An NIR pulse, with variable pulse width and intensity, creates a charge-balanced current waveform in each pixel of the photodiode array. The microelectrode array records the resultant stimulus artefact and retinal responses from each of the 512 electrodes. Stimulation is repeated at least 400 times for each setting. The artefact is then subtracted and the recorded action potentials undergo principal component analysis and automated clustering to attribute spiking waveforms to over 100 RGCs per experiment. A typical peristimulus time histogram representing the average number of spikes of a single neuron per 5 ms time bin per trial is shown at the bottom of (c).
A NIR laser source illuminates the prosthetic device through the optically transparent tracks of the MEA. A pulse of NIR light is converted in each illuminated pixel of the photodiode array into a charge-balanced stimulation pulse (figure 7(c)). This results in a large stimulation-induced electrical artefact on the recording electrode, followed by the retinal response 10 to 50 ms later, which is evident as a burst of RGC spiking that is time-locked to the NIR pulse. The resultant spiking activity can be quantified by creating a peri-stimulus time histogram (PSTH) plot (figure 7(c)) that illustrates the strength, latency and distribution of the NIR-induced electrical stimulation of the retina. The repetition rate of the NIR pulses was 2 Hz, to ensure that the RGC firing rate had returned to the spontaneous level before the next stimulation pulse.
All experimental procedures were conducted in accordance with institutional guidelines and conformed to the guidelines of the Association for Research in Vision and Ophthalmology (ARVO) Statement for the Use of Animals in Ophthalmic and Vision Research.
3. Results
3.1. Electrical characteristics of the photodiodes
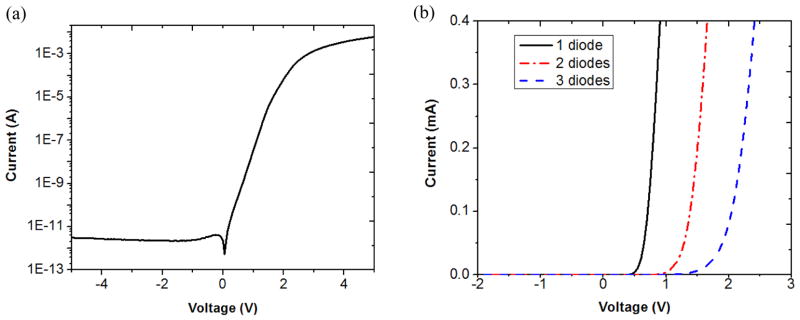
The electrical characteristics of all three pixel sizes (280, 140, and 70 μm) were tested by a semiconductor parameter analyser (HP 4155A, Hewlett Packard Co., Palo Alto, CA). The reverse-bias dark current was in the range of 1–100 pA for three series-connected photodiodes operated at room temperature. The reverse breakdown voltage was larger than 20 V. The current-voltage characteristic of a large pixel with three series-connected photodiodes is shown in figure 8(a) on a semi-log scale. The reverse dark current is less than 10 pA. The I-V characteristics of the large-size pixels with one-diode, two-series-connected-diode, and three-series-connected-diode structures are shown in figure 8(b), in which the turn-on voltages are approximately 0.6 V, 1.2 V and 1.8 V, respectively.
Figure 8.
(a) Semi-log scale I-V characteristic of a large-size pixel with three diodes connected in series, showing dark current in the range of 1–10 pA. (b) Linear scale I-V characteristic showing the turn-on voltages of the large-size pixels with one-diode, two-series-connected-diode, and three-series-connected-diode structures are 0.6 V, 1.2 V and 1.8 V, respectively.
3.2. Optical response of the photodiodes
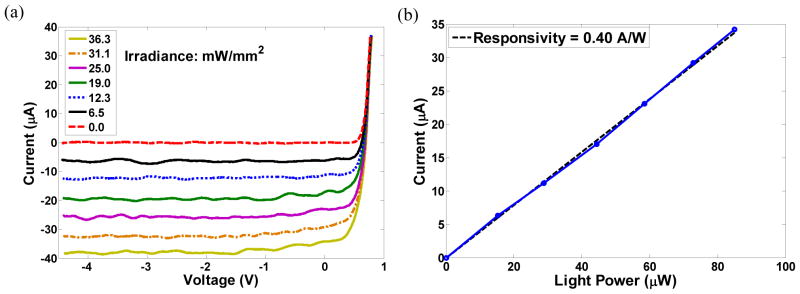
The light irradiance was varied from 0 to 35.4 mW/mm2 on the one-diode test structure and the measured photo-responsivities at 880 nm wavelength for large-, medium- and small-size pixels were 0.33 A/W, 0.40 A/W and 0.36 A/W per diode at zero voltage bias. The measured photocurrent and photo-responsivity for the one-diode test structure of medium-size pixels are shown in figure 9. Photocurrent as a function of bias voltage at various light intensities is shown in figure 9(a). Photo-responsivity at zero bias voltage corresponding to figure 9(a) is shown in figure 9(b).
Figure 9.
Photocurrent and photo-responsivity for a medium-size one-diode test structure: (a) Photocurrent as a function of bias voltage at various light intensities. (b) Photo-responsivity at zero bias voltage of (a).
As can be seen in figure 9(b), the photocurrent scales linearly with light intensity. The measured quantum efficiency was approximately 56%. Due to sub-optimal performance of the anti-reflection coating (deviation of the grown SiO2 thickness from the target thickness), there was some reflection of the NIR light from the wafer surface. The measured photocurrent was 23 μ, 5 μ, and 0.7 μ for large-, medium- and small-size pixels at 6 mW/mm2 light intensity, scaling approximately with the exposed silicon area.
3.3. In vitro electrophysiological testing of RGC stimulation by the implant
The experiment outlined in section 2.3 allowed the examination of the RGC activity in wild-type rat retina in response to NIR-induced electrical stimulation from the subretinal implant (medium-size pixel array, as shown in figure 5). The implant underwent full field illumination (NIR light, λ=880 nm) with RGCs under the prosthesis responding well to stimulation. Figure 10(a) shows a typical response from one of the RGCs in the form of a PSTH. Spiking activity occurs between 10 and 50 ms after the NIR light pulse with a peak latency ~25 ms. Threshold responses (defined as the 50% probability a spike was elicited) occurred at an irradiance level 0.9 mW/mm2 with pulse duration of 1 ms and 0.3 mW/mm2 with pulse duration of 4 ms. Bursts of 2–3 spikes were elicited at higher irradiance levels. Figure 10(b) shows how the number of spikes per burst increases with irradiance and with pulse width. An example of the raw data with 3 elicited spikes can be seen in figure 7(c). Spikes are separated by 3–4 ms, corresponding to an increase in spike rate from a spontaneous background rate of 1–3 Hz to a peak rate of ~250 Hz occurring 25 ms after the stimulation pulse. A previous study [27], involving pharmacological blockers, has indicated that the inner retinal neurons are activated with this mode of stimulation.
Figure 10.
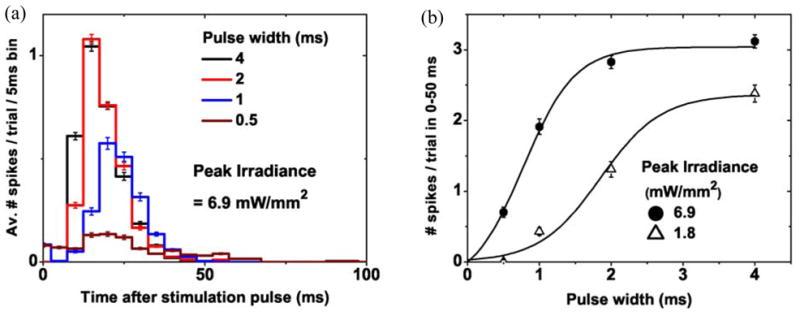
(a) PSTH response from a typical RGC under NIR-induced electrical stimulation by the prosthesis chip. Varying the width of the NIR pulse modulates the strength of the RGC response. (b) Integration of the PSTH response (with the background spontaneous rate subtracted) yields the total number of spikes per trial, which can be varied by modulating the pulse width or NIR irradiance.
3.4. In-vivo implantation and electrophysiology
The fabricated implant is thin, small in size and powered through projected NIR light. This makes the surgical procedure much simpler than that of the other retinal prosthetic approaches, which are connected by a cable to a power/data supply. Implantation procedure in the rat involves a small sclerotomy made 1.5 mm posterior to the limbus, followed by a subretinal injection to create a retinal bleb. The implant is then inserted into the subretinal space using a custom insertion tool [21]. Optical Coherence Tomography (OCT, 870nm) (Spectralis, Heidelberg Engineering, Germany) was performed during the 90-day follow-up period to examine the implant location and anatomy of the retina around it. Importantly, the imaging could demonstrate how close the inner nuclear layer of the retina to the stimulation electrodes was. The colour fundus photo shown in figure 11(a) demonstrates a medium-size pixel implant located under the retina in an 18-week old Long-Evans rat. Figure 11(b) demonstrates an IR image of the same implant, showing retinal blood vessels crossing the device. The OCT image in figure 11(c) demonstrates a cross section of the retina with the subretinal implant (along the line marked in figure 11(b)). OCT measures the optical path length, therefore due to the much larger refractive index of silicon at 870 nm wavelength (n=3.6) [23] than that of water (n=1.3) [28], the implant appears in OCT almost 3 times as thick as it actually is. The OCT image in figure 11(c) demonstrates very close and uniform proximity between the implant surface and the inner nuclear layer 90 days after implantation. Visual evoked potential (VEP) was measured with a 915 nm wavelength beam projected into 1 mm-diameter spot on the subretinal implant in wild-type (WT) and Royal College of Surgeons (RCS) rats [29] using 2 Hz repetition rate of stimulation. Threshold peak irradiance with large- and medium-size pixels using 4 ms pulses was 0.5 mW/mm2 in both species. With small-size pixels the stimulation threshold increased to 1 mW/mm2. When the spot was directed on the retina away from the implant, no response could be detected.
Figure 11.
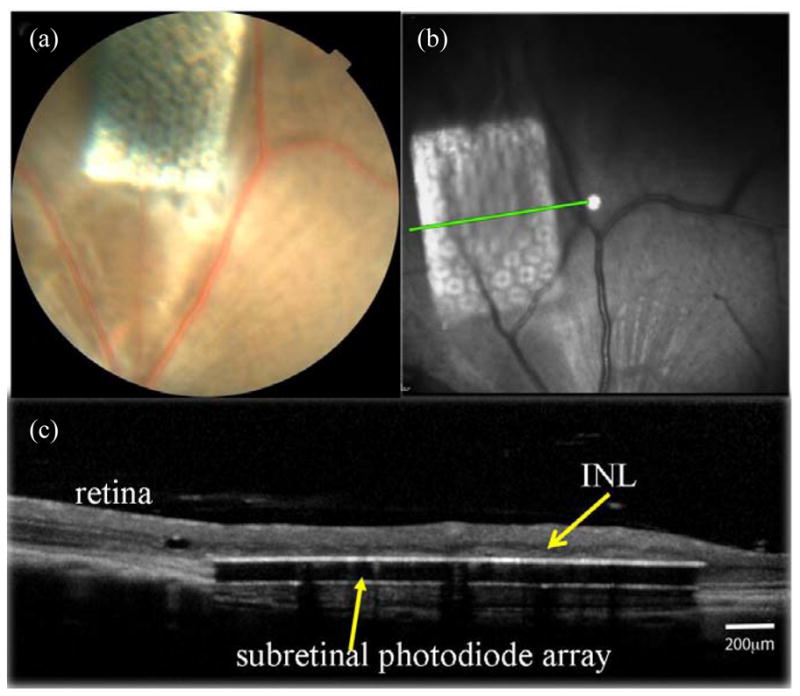
Imaging of the subretinal implant (1.2 mm × 0.8 mm) with medium-size pixels in rat eye 90 days after implantation in-vivo: (a) Colour fundus photo of the implant under the retina. (b) Front view in OCT showing retinal blood vessels above the subretinal implant. (c) OCT image showing the cross section of the retina with the subretinal implant (along the line marked in (b)). Inner nuclear layer (INL) is indicated by an arrow.
To illustrate positioning of the implant above retinal pigment epithelium (RPE), and to provide realistic size comparison, an array with small-size pixels was placed on RPE in a porcine eye, and imaged with a scanning electron microscope. Figure 12 demonstrates the hexagonal RPE mosaic with cell sizes of about 15 μm in width, and a 30μm-thick photovoltaic array with 70 μm pixels.
Figure 12.
SEM image of an array with small-size pixels on retinal pigment epithelium (RPE) in a porcine eye.
4. Discussion
Several groups have investigated photosensitive subretinal prostheses. Optobionics Inc. conducted clinical testing of a 2-mm-diameter 25 μm thick microphotodiode array (artificial silicon retina [ASR]) powered solely by ambient light [30, 31]. These implants have shown some beneficial neurotrophic effect on the retina remote from the chip [32, 33], but failed to produce patterned stimulation and elicit phosphenes due to (a) insufficiently bright and (b) continuous nature of ambient light on the retina, issues we specifically addressed with our pulsed NIR approach. Retina Implant AG developed and tested a subretinal implant with 1500 pixels, each of which has a microphotodiode, an amplifier and a stimulation electrode [19]. Clinical trial demonstrated that this implant provided meaningful vision in patients blinded by Retinitis Pigmentosa [19]. However, the cable connecting the subretinal implant to extraocular power supply greatly complicates the surgical procedure, and the global return electrode in this system is likely to reduce current confinement and cause signal spreading, an effect that we have addressed through the local return electrodes in each of our pixels. The possible drawback of having a local return electrode in each pixel is that the current penetration depth into the tissue is reduced [21], thereby increasing the stimulation threshold. Our in-vitro studies have demonstrated that retinal stimulation can be achieved even with small-size (70 μm) pixels [27]. Stimulation threshold could be reduced using pillar electrodes that penetrate into the inner nuclear layer, thereby providing much closer proximity to the target neurons [21, 34]. This is likely to be especially significant in case of the build-up of a glial layer, which may isolate the remnant retinal neurons [35].
Like all photosensitive retinal implants, our prosthetic system allows parallel transmission of visual information to each pixel and is scalable to a large number of stimulating electrodes. It also maintains the natural link between eye movements and visual perception. The NIR image parameters can be easily adjusted on video goggles according to each individual, and patients can still use any remaining natural vision [20, 21, 22]. Operating the implants photovoltaically eliminates the need for power cables and greatly simplifies the surgery. Multiple arrays can be placed through the same retinotomy to cover larger visual field. The local return electrode in each pixel reduces cross-talk between pixels by confining the electric fields, and channels opened between pixels allow perfusion of nutrient to the retina.
We have demonstrated retinal stimulation with pixel sizes down to 70 μm. Reliable spike bursts were elicited in-vitro at irradiance levels below 5 mW/mm2, whereas retinal damage limits at NIR wavelengths (4ms pulse width and 15 Hz repetition rate) are at least one order of magnitude above this [22]. OCT images of the implanted 30 μm-thick device with perfusion channels surrounding each pixel demonstrated good acceptance of the array in the subretinal space and close proximity to the Inner Nuclear Layer.
Future improvements of the implant will include: optimization of the number of diodes per pixel, optimization of the ratio of the photosensitive area to electrode size, perfecting the anti-reflection coating, adding a biocompatible Parylene coating. Another aspect that can be optimized is the polarity of the stimulation waveform. In the current design, the central active electrode is driven negatively relative to the return electrode, which is the cathodal stimulation configuration [22]. Subretinal anodal stimulation (the reverse polarity) has been shown in recent studies [36–39] to provide stimulation thresholds several times lower. Therefore, a future design will focus on the anodal version of the device. Such devices will be fabricated on a lightly phosphorus doped (n−) silicon device layer with the central active electrode connected to a p+ region. In addition, adding a shunt resistor will help speed-up the discharge phase of the stimulation waveform [22]. We did not integrate shunt resistors into the current devices to reduce process complexity. The current devices have been proven functional in-vitro and in-vivo, operating at repetition rates below 15 Hz. Future devices may require such shunts to attain larger peak current at higher repetition rate.
5. Conclusions
We have designed and fabricated a two-dimensional silicon photodiode array capable of photovoltaic conversion of pulsed near-IR illumination into bi-phasic electrical current in each pixel, and successfully stimulated the retina. The 30 μm device thickness is sufficiently small to allow subretinal implantation, but on the other hand is sufficient to absorb the near-IR light. The fabrication process consists of eight mask layers, and includes a deep reactive-ion etch isolation process. Reverse-bias dark current levels (<100 pA) and breakdown voltages (>20 V) are sufficient for neural stimulation application. Pixels with three photodiodes connected in series have turn-on voltages of about 1.8 V. For pixel sizes of 280 μm, 140 μm, and 70 μm, the measured photo-responsivity per diode ranges from 0.33 to 0.4 A/W. Retinal stimulation was achieved in-vitro at peak irradiance of 0.3 mW/mm2 and in-vivo at 0.5 mW/mm2 using 4 ms pulse duration.
Acknowledgments
This work was supported in part by the National Institutes of Health (grant 5R01EY018608-03), by the RCUK SU2P Science Bridges Award, and by Air Force Office of Scientific Research (grant FA9550-10-10503). Fabrication was performed in part at the Stanford Nanofabrication Facility which is supported by National Science Foundation through the NNIN (grant ECS-9731293).
References
- 1.Zrenner E, Stett A, Weiss S, Aramant RB, Guenther E, Kohler K, Miliczek KD, Seiler MJ, Haemmerle H. Can subretinal microphotodiodes successfully replace degenerated photoreceptors. Vision Res. 1999;39(15):2555–67. doi: 10.1016/s0042-6989(98)00312-5. [DOI] [PubMed] [Google Scholar]
- 2.Caspi A, Dorn JD, McClure KH, Humayun MS, Greenberg RJ, Mcmahon MJ. Feasibility study of a retinal prosthesis: spatial vision with a 16-electrode implant. Arch Ophthalmol. 2009;127(4):398–401. doi: 10.1001/archophthalmol.2009.20. [DOI] [PubMed] [Google Scholar]
- 3.Rizzo JF, Wyatt J, Humayun M, de Juan E, Liu W, Chow A, Eckmiller R, Zrenner E, Yagi T, Abrams G. Retinal prosthesis: an encouraging first decade with major challenges ahead. Ophthalmology. 2001;108(1):13–4. doi: 10.1016/s0161-6420(00)00430-9. [DOI] [PubMed] [Google Scholar]
- 4.Humayun MS, de Juan E, Jr, Dagnelie G, Greenberg RJ, Propst RH, Phillips DH. Visual perception elicited by electrical stimulation of retina in blind humans. Arch Ophthalmol. 1996;114(1):40–6. doi: 10.1001/archopht.1996.01100130038006. [DOI] [PubMed] [Google Scholar]
- 5.Richard G, Keserue M, Feucht M, Post N, Horning R. Visual perception after long-term implantation of a retinal implant. Invest Ophthalmol Vis Sci. 2008;49:1786. [Google Scholar]
- 6.Kim SY, Sadda S, Pearlman J, Humayun MS, de Juan E, Jr, Melia BM, Green WR. Morphometric analysis of the macula in eyes with disciform age-related macular degeneration. Retina. 2002;22(4):471–7. doi: 10.1097/00006982-200208000-00012. [DOI] [PubMed] [Google Scholar]
- 7.Mazzoni F, Novelli E, Strettoi E. Retinal ganglion cells survive and maintain normal dendritic morphology in a mouse model of inherited photoreceptor degeneration. J Neurosci. 2008;28(52):14282–92. doi: 10.1523/JNEUROSCI.4968-08.2008. [DOI] [PMC free article] [PubMed] [Google Scholar]
- 8.Stone JL, Barlow WE, Humayun MS, de Juan E, Jr, Milam AH. Morphometric analysis of macular photoreceptors and ganglion cells in retinas with retinitis pigmentosa. Arch Ophthalmol. 1992;110:1634–1639. doi: 10.1001/archopht.1992.01080230134038. [DOI] [PubMed] [Google Scholar]
- 9.Humayun MS, de Juan E, Weiland JD, Dagnelie G, Katona S, Greenberg R, Suzuki S. Pattern electrical stimulation of the human retina. Vis Res. 1999;39:2569–76. doi: 10.1016/s0042-6989(99)00052-8. [DOI] [PubMed] [Google Scholar]
- 10.Margalit E, et al. Retinal prosthesis for the blind. Surv Ophthalmol. 2002;47:4–335. doi: 10.1016/s0039-6257(02)00311-9. [DOI] [PubMed] [Google Scholar]
- 11.Margalit E, et al. Visual and electrical evoked response recorded from subdural electrodes implanted above the visual cortex in normal dogs under two methods of anesthesia. J Neurosci Meth. 2003;123(2):129–37. doi: 10.1016/s0165-0270(02)00345-x. [DOI] [PubMed] [Google Scholar]
- 12.Zrenner E, et al. Subretinal microphotodiode array as replacement for degenerated photoreceptors? Ophthalmologe. 2001;98(4):357–63. doi: 10.1007/s003470170141. [DOI] [PubMed] [Google Scholar]
- 13.Stett A, Barth W, Weiss S, Haemmerle H, Zrenner E. Electrical multisite stimulation of the isolated chicken retina. Vis Res. 2000;40(13):1785–95. doi: 10.1016/s0042-6989(00)00005-5. [DOI] [PubMed] [Google Scholar]
- 14.Sachs HG, Kobuch K, Koehler M, Schwahn HN, Gekeler FE, Jakob W, Marienhagen J, Zrenner E. Subretinal implantation of electrodes for acute in vivo stimulation of the retina to evoke cortical responses in minipig. Inv Ophthalmol &Vis Sci. 2000;41(4):S102. [Google Scholar]
- 15.Humayun MS, et al. Preliminary 6 month results from the Argus™ II epiretinal prosthesis feasibility study. Conf Proc IEEE Eng Med Biol Soc. 2009:4566–8. doi: 10.1109/IEMBS.2009.5332695. [DOI] [PMC free article] [PubMed] [Google Scholar]
- 16.Ahujia AK, Dorn JD, Caspi A, McMahon MJ, Dagnelie G, da Cruz L, Stanga P, Humayun MS, Greenberg RJ Argus IIStudy Group. Blind subjects implanted with the Argus II retinal prosthesis are able to improve performance in a spatial-motor task. Br J Ophthalmol. 2011;95(4):539–43. doi: 10.1136/bjo.2010.179622. [DOI] [PMC free article] [PubMed] [Google Scholar]
- 17.Weiland JD, Cho AK, Humayun MS. Retinal prostheses: current clinical results and future needs. Ophthalmology. 2011;118(11):2227–37. doi: 10.1016/j.ophtha.2011.08.042. [DOI] [PubMed] [Google Scholar]
- 18.da Cruz L, Coley B, Christopher P, Merlini F, Wuyyuru V, Sahel JA, Stanga P, Filley E, Dagnelie G Argus IIStudy Group. Patients blinded by outer retinal dystrophies are able to identify letters using the Argus™ II retinal prosthesis system. Invest Ophthalmol Vis Sci. 2010;51:E-Abstract 2023. [Google Scholar]
- 19.Zrenner E, et al. Subretinal electronic chips allow blind patients to read letters and combine them to words. Proc R Soc B. 2010:1747. doi: 10.1098/rspb.2010.1747. [DOI] [PMC free article] [PubMed] [Google Scholar]
- 20.Palanker D, Vankov A, Huie P, Baccus S. Design of a high-resolution optoelectronic retinal prosthesis. J Neural Eng. 2005;2:S105–S120. doi: 10.1088/1741-2560/2/1/012. [DOI] [PubMed] [Google Scholar]
- 21.Loudin JD, Simanovskii DM, Vijayraghavan K, Sramek CK, Butterwick AF, Huie P, McLean GY, Palanker DV. Optoelectronic retinal prosthesis: system design and performance. J Neural Eng. 2007;4:S72–S84. doi: 10.1088/1741-2560/4/1/S09. [DOI] [PubMed] [Google Scholar]
- 22.Loudin JD, Cogan SF, Mathieson K, Sher A, Palanker DV. Photodiode circuits for retinal prostheses. IEEE Trans Biomed Circuits Syst. 2011;5(5):468–80. doi: 10.1109/TBCAS.2011.2144980. [DOI] [PMC free article] [PubMed] [Google Scholar]
- 23.Green MA, Keevers MJ. Optical properties of intrinsic silicon at 300 K. Prog Photovoltaics. 1995;3(3):189–92. [Google Scholar]
- 24.Morozov GV, Maev RG, Drake GWF. Multiple reflection method for electromagnetic waves in layered dielectric structures. Quantum Electron. 2001;31(9):767–773. [Google Scholar]
- 25.Tabata O, Asahi R, Funabashi H, Shimaoka K, Sugiyama S. Sens Actuators A (Switzerland) 1992;34:51–7. [Google Scholar]
- 26.Litke AM, et al. What does the eye tell the brain?: development of a system for the large-scale recording of retinal output activity. IEEE T Nucl Sci. 2004;51(4):1434–40. [Google Scholar]
- 27.Mathieson K, Loudin J, Goetz G, Huie P, Wang L, Kamins T, Galambos L, Smith R, Harris JS, Sher A, Palanker D. Photovoltaic retinal prosthesis with high pixel density. Nature Photonics. 2012;6:391–7. doi: 10.1038/nphoton.2012.104. [DOI] [PMC free article] [PubMed] [Google Scholar]
- 28.Hale GM, Querry MR. Optical constants of water in the 200-nm to 200-μm wavelength region. Appl Opt. 1973;12:555–63. doi: 10.1364/AO.12.000555. [DOI] [PubMed] [Google Scholar]
- 29.Bourne MC, Campbell DA, Tansley K. Hereditary degeneration of the rat retina. Br J Ophthalmol. 1938;22:613–23. doi: 10.1136/bjo.22.10.613. [DOI] [PMC free article] [PubMed] [Google Scholar]
- 30.Chow AY, Chow VY, Packo KH, Pollack JS, Peyman GA, Schuchard R. The artificial silicon retina microchip for the treatment of vision loss from retinitis pigmentosa. Arch Ophthalmol. 2004;122:460–9. doi: 10.1001/archopht.122.4.460. [DOI] [PubMed] [Google Scholar]
- 31.Chow AY, Pardue MT, Perlman JI, Ball SL, Chow VY, Hetling JR, Peyman GA, Liang C, Stubbs EB, Jr, Peachey NS. Subretinal implantation of semiconductor-based photodiodes: durability of novel implant designs. J Rehabil Res Dev. 2002;39:313–21. [PubMed] [Google Scholar]
- 32.Pardue MT, Phillips MJ, Yin H, Sippy BD, Webb-Wood S, Chow AY, Ball SL. Neuroprotective effect of subretinal implants in the RCS rat. Investigative Ophthalmology & Visual Science. 2005;46:674–82. doi: 10.1167/iovs.04-0515. [DOI] [PubMed] [Google Scholar]
- 33.DeMarco PJ, Jr, Yarbrough GL, Yee CW, McLean GY, Sagdullaev BT, Ball SL, McCall MA. Stimulation via a subretinally placed prosthetic elicits central activity and induces a trophic effect on visual responses. Invest Ophthalmol Vis Sci. 2007;48(2):916–26. doi: 10.1167/iovs.06-0811. [DOI] [PubMed] [Google Scholar]
- 34.Butterwick A, Huie P, Jones BW, Marc RE, Marmor M, Palanker D. Effect of shape and coating of a subretinal prosthesis on its integration with the retina. Experimental Eye Research. 2009;88:22–9. doi: 10.1016/j.exer.2008.09.018. [DOI] [PMC free article] [PubMed] [Google Scholar]
- 35.Marc RE, Jones BW, Watt CB, Strettoi E. Neural remodeling in retinal degeneration. Prog Retin Eye Res. 2003;22:607–55. doi: 10.1016/s1350-9462(03)00039-9. [DOI] [PubMed] [Google Scholar]
- 36.Jensen RJ, Rizzo JF., III Responses of rabbit retinal ganglion cells to electrical stimulation with a subretinal electrode. Invest Ophthalmol Vis Sci. 2005;46:E-Abstract 5279. [Google Scholar]
- 37.Jensen RJ, Rizzo JF., III Thresholds for activation of rabbit retinal ganglion cells with a subretinal electrode. Exp Eye Res. 2006;83(2):367–73. doi: 10.1016/j.exer.2006.01.012. [DOI] [PubMed] [Google Scholar]
- 38.Stett A, Mai A, Herrmann T. Retinal charge sensitivity and spatial discrimination obtainable by subretinal implants: key lessons learned from isolated chicken retina. J Neural Eng. 2007;4:S7–S16. doi: 10.1088/1741-2560/4/1/S02. [DOI] [PubMed] [Google Scholar]
- 39.Jensen RJ, Rizzo JF., III Activation of ganglion cells in wild-type and rd1 mouse retinas with monophasic and biphasic current pulses. J Neural Eng. 2009;6:1–7. doi: 10.1088/1741-2560/6/3/035004. [DOI] [PubMed] [Google Scholar]


