

Abstract
Objective
Professional organizations recommend a preventive dental visit by one year of age. This study compared dental treatment and expenditures for Medicaid children who have a preventive visit before age 18-months to those who have a visit at age 18-42 months.
Methods
This retrospective cohort study used reimbursement claims for 19,888 children enrolled in North Carolina Medicaid (1999-2006). We compared the number of dental treatment procedures at age 43-72 months for children who had a visit by age 18-months to children who had a visit at age 18-24, 25-30, 31-36 and 37-42 months using a zero inflated negative binomial model. The likelihood and amount of expenditures at age 43-72 months were compared by group using a logit and ordinary least squares regression.
Results
Children who had a primary or secondary preventive visit by age 18-months had no difference in subsequent dental outcomes compared to children in older age categories. Among children with existing disease, those who had a tertiary preventive visit by age 18-months had lower rates of subsequent treatment (18-24 months IDR: 1.19, 95% CI: 1.03-1.38; 25-30 months IDR: 1.21, 95% CI: 1.06 – 1.39; 37-42 months IDR: 1.39, 95% CI: 1.22 – 1.59) and lower treatment expenditures compared to children in older age categories.
Conclusions
In this sample of preventive dental users in Medicaid, we found that children at highest risk of dental disease benefited from a visit before age 18-months, but most children could delay their first visit until age 3-years without an effect on subsequent dental outcomes.
Keywords: Early Childhood Caries, dental treatment, Medicaid claims
Introduction
The most prevalent chronic disease among children younger than 6 years is dental caries, known as early childhood caries (ECC). Over the past decade, the prevalence of ECC among preschool aged children increased significantly.1-2 Low-income children have more dental disease but less access to dental care than other children despite coverage by Medicaid.3-4
Treatment of ECC among Medicaid-enrolled children accounts for millions of dollars in expenditures each year.5 One study of young children enrolled in Iowa Medicaid found that children treated for dental caries in the hospital or ambulatory setting represented less than 5% of children receiving dental care, but consumed 25% to 45% of total dental resources.6 In addition to financial costs, tooth decay can lead to lost hours from school for children and lost hours from work for parents, particularly for low income, minority, and uninsured children.7-8 As a result of ECC, children can experience eating, speaking and learning difficulties, which damages their overall health and quality of life.2
The high prevalence and negative consequences of ECC have prompted professional organizations to seek out ways to increase access to preventive services. Organizations have promoted a first dental visit and establishment of a dental home by one year of age.9-11 Under Early and Periodic Screening, Diagnostic and Treatment (EPSDT) guidelines, dental services must be provided for children enrolled in Medicaid in accordance with a periodicity schedule determined by the state after consultation with recognized dental organizations involved in child health care.12 Many Medicaid programs, including NC, recommend that the first dental visit take place at one year of age, but because of limited dentist supply, do not require it until 3 years of age. Early preventive dental visits have the potential to improve oral health outcomes through early detection and treatment, fluoride regimens, and anticipatory guidance.10, 13 However, there is not strong evidence that a preventive dental visit as early as one year of age provides added benefit relative to starting preventive dental visits at three years of age.
Recent studies on the effects of a preventive visit at a very early age show conflicting results. A study using data from NC Medicaid (1992-1997) found that children who had a preventive visit by one year of age had lower total dental costs at age five years than children who had their first preventive visit at age 2 to 5 years.14 In contrast, studies of children enrolled in the Wisconsin and Michigan Medicaid programs found no association between the age of first visit and total dental costs. The latter studies did not include associated costs from claims for dental care delivered in an emergency department or hospital setting, however.15-16 All three previous studies had small sample sizes, especially for children who had a visit by age one year. Moreover, all three previous studies defined a preventive visit as any visit as long as it included a preventive service. Ours is the first study to examine whether an early dental check-up that follows current clinical guidelines for a preventive visit is associated with subsequent positive outcomes.
The goal of this study was to determine whether the timing of the first preventive visit to the dentist is associated with subsequent oral health outcomes. We compared the amount of caries-related treatment and associated Medicaid expenditures for children at age 43-72 months who had a preventive visit by age 18 months with other ages before 43 months of age.
Methods
Data
The NC Medicaid files included information for enrollment and detailed non-pharmaceutical reimbursement claims from October 1999 to December 2006 for all children born on or after January 1, 1998. All dental visits and procedures provided during a visit can be identified from the claim, as well as whether dental care was delivered in a private dentist’s office, community health clinic, or hospital. The enrollment files provide information about enrollment spells for each child enrolled in Medicaid. The claims and enrollment information for each child were aggregated so that the final dataset included one observation per child.
The NC Health Professions Data System17 provided data on the supply of dentists for each county in NC in each year. The Community-Level Information on Kids data set from the Annie E. Casey Foundation18 provided data on the number of children enrolled in Medicaid in each county in 2004. The rural-urban classifications were derived from the rural-urban continuum codes for each county available from the US Department of Agriculture Economic Research Center.19
Sample
All children who were enrolled in NC Medicaid before their first birthday, enrolled for at least 12 months, and had a paid claim for dental care were eligible for the study (n=165,383). Children were excluded if: 1) they received preventive dental services in a medical office as part of the NC Into the Mouths of Babes fluoride varnish program20 (n=56,225); 2) they did not have a preventive dental visit by 42 months of age (n=86,074); or 3) they were enrolled for less than one year following their first preventive visit (n=3,196). The final sample included 19,888 children.
Variables
To estimate the effect of timing of preventive visits on treatment use, we used an aggregate count of the caries-related treatment procedures the child received during the outcome period (age 43 to 72 months) as the dependent variable. We limited the outcome period to 43-72 months so that all outcomes would be subsequent to the preventive visits; we controlled for the number of months enrolled after 43 months of age. Caries-related treatment procedures were identified using the Current Dental Terminology (CDT) Codes and included restorative treatment (CDT codes = D2000-D2999), endodontic therapy (D3000-D3999), and surgery or extractions (D7000-D7999). We included dental treatment that occurred in a private dentist’s office, community health clinic, or hospital setting, including inpatient hospitals and ambulatory care or surgical centers. We identified treatment occurring in a hospital setting from dental claims with inpatient or outpatient hospital as the place of service or a procedure code of a hospital call submitted by the dentist.
To estimate the effect of early prevention on dental treatment expenditures, we first determined if the child had any dental treatment expenditure with a binary variable indicating any expenditure or not. Conditional on having any expenditure, the log of expenditures per member year was the dependent variable. We summed the expenditures associated with dental treatment procedures incurred from paid claims during the time they were 43-72 months of age and divided the sum by the number of years the child was enrolled during that period.
For visits occurring in a hospital setting, the hospital claims were merged with the dental treatment claims and the hospital expenditures were added to the total cost of dental treatment. In order to standardize fees and account for adjustments over the study period, the total of each hospital/ambulatory care center stay was increased by the change in the medical consumer price index for each year before 2008 that the surgery occurred. To account for changes in dental fees over the seven years included in the study, reimbursement amounts listed in the 2008 Medicaid fee schedule were applied to each CDT code.
In general, disease prevention focuses on three levels of prevention: 1) primary -- preventing disease from starting; 2) secondary -- detecting disease early and preventing disease progression; and 3) tertiary -- reducing complications of disease and restoring functioning. According to American Academy of Pediatric Dentistry guidelines, an early preventive dental visit should include elements of both primary and secondary prevention: an examination for ECC, prophylaxis, fluoride treatment, nutrition guidance, home care guidance, and feeding instructions.10 For our main analysis, we therefore identified visits that included primary and secondary prevention, specifically: 1) a comprehensive evaluation or periodic exam; 2) fluoride application; 3) no more than two restorative treatment procedures (with no other treatment) per visit on the day of the visit or for any visit for 3 months following; and 4) no hospital-based visit within 6 months of the initial visit. We excluded treatment in an office or hospital following the visit because children with existing disease may have been examined in an initial visit and then treated in a follow-up visit. We chose 6 months as the time frame for hospital-based care delivery because the waiting time to be seen in a hospital setting can be long. The main explanatory variable of interest was a categorical variable indicating the age at the first preventive visit: 6-18, 18-24, 25-30, 31-36, and 37-42 months.
For sensitivity analyses, we defined a primary preventive visit as one that had no treatment on the day of visit or for 3 months following that visit and a tertiary preventive visit as one that included a preventive service and more than 2 treatments to determine the effect of early visits for children who had existing disease.
The regression model included both child-level variables and county-level variables based on previous research that found them to be associated with use of dental care and oral health.14,5, 21 The child level covariates in the model included the child’s gender, race (white, black, Hispanic, or other), whether they received treatment before the age of 42 months, whether they were continuously enrolled according to the HEDIS ® definition of continuous enrollment (not more than 45 days of disenrollment for any year), and the number of well child visits from age 12 to 24 months. Because information on race variable was missing in 9% of the sample, we imputed race for observations with missing data with a multinomial regression model based on the child’s other covariates as well as their number of treatment procedures. The county level covariates in the model included the percent of the population under 18 years enrolled in Medicaid, the county’s metropolitan status, and the number of dentists per 10,000 people.
Analysis
A zero-inflated negative binomial (ZINB) model with an intercept-only model for the excess zero component was used to estimate incidence densities of caries-related treatment procedures per time enrolled in Medicaid with the log of exposure time included as the offset. The exposure time was the child’s total enrollment time (in months) in Medicaid during the outcome period and was measured from the time the child was 43 months to the time they were censored either due to turning 72 months of age, disenrollment in Medicaid before 72 months, or the end of the study period (December 31, 2006).
We used a two-part hurdle model to estimate the effect of visits on expenditures. The first part was a logit model to predict having any dental treatment expenditures during the outcome period. The second part was an ordinary least squares (OLS) regression model with the expenditures log transformed controlling for heteroskedasticity with Huber-White standard errors. To control for length of enrollment in both the logit and OLS models, we included a linear spline of the number of months the child was enrolled in Medicaid during the outcome period with four equal categories. We used a spline for enrollment time because we expected the relationship between the number of months enrolled and the amount of expenditures to be non-linear as older children would have more expenditures. We transformed the OLS results into predicted dental expenditures conditional on having any expenditure with smearing for heteroskedastic and normal errors.
The data were analyzed using SAS 9.1 and Stata 12.0. All analyses use p<0.05 as statistically significant. The Institutional Review Board of the author’s institution and the North Carolina Division of Medical Assistance approved this study.
Results
Sample Characteristics
Children who did not have any preventive visit by age 42 months had a larger number of treatments and expenditures at age 43-72 months (Table 2). Among the sample of 19,888 children enrolled in NC Medicaid who had a preventive dental visit by age 42 months, 1,425 (7%) had a preventive visit before age 18 months, 2,842 (14%) at age 18-24 months, 3,733 (19%) at age 25-30 months, 4,882 (25%) at age 31-36 months and 7,006 (35%) at age 37-42 months. As compared to other children, children who had a preventive visit by age 18 months were more likely to be Hispanic, have a higher number of well child visits, be continuously enrolled, be enrolled for fewer months and live in urban counties with a higher number of dentists per capita (Table 2).
Table 2.
Descriptive statistics for children who had a dental visit before 72 months of age
| Primary or secondary preventive visit before 42 mos by age category | Primary preventive visit <42 mos | Teritary preventive visit <42 mos | No preventive visit <42 mos | ||||||
|---|---|---|---|---|---|---|---|---|---|
| Total N=19,888 %/mean (sd) | <18 mos N=1,425 %/mean (sd) | 18-24 mos N=2,842 %/mean (sd) | 25-30 mos N=3,733 %/mean (sd) | 31-36 mos N= 4,882 %/mean (sd) | 37-42mos N= 7,006 %/mean (sd) | Total N=18,869 %/mean (sd) | Total N=14,389 %/mean (sd) | Total N= 34,035 %/mean (sd) | |
| Individual level variables | |||||||||
| Number of caries related treatment procedures (from > 42-72 months) | 2.54 (4.70) | 1.70 (3.78) | 1.93 (4.05) | 2.25** (4.31) | 2.65** (4.73) | 3.05** (5.19) | 2.46 (4.65) | 3.63 (5.64) | 4.45 (6.20) |
| Any dental treatment expenditures (from > 42-72 months) | 68.29 | 58.04 | 59.47 | 62.26* | 69.81** | 76.11** | 68.42 | 70.21 | 89.21 |
| Dental treatment expenditures per year (> 42-72 months) for those with any | 312.91 (594.22) | 313.73 (560.19) | 313.04 (610.84) | 340.69 (699.66) | 330.48 (661.96) | 289.40 (488.05) | 301.26 (527.01) | 320.56 (747.85) | 340.16 (537.30) |
| Total exposure (time enrolled from 43-72 months) | 20.66 (9.16) | 15.14 (9.71) | 16.90** (9.78) | 18.34** (9.98) | 21.34** (8.69) | 24.08** (6.90) | 20.55 (9.19) | 21.56 (8.94) | 26.63 (5.34) |
| Race | |||||||||
| White | 34.01 | 33.33 | 32.76 | 34.37 | 34.54 | 34.09 | 34.05 | 39.29 | 38.57 |
| Black | 49.58 | 45.33 | 49.51 | 47.39 | 50.14* | 51.26** | 49.83 | 40.86 | 45.81 |
| Hispanic | 14.97 | 20.49 | 16.12** | 16.82** | 13.93** | 13.13** | 14.70 | 17.33 | 13.20 |
| Other | 1.44 | 0.84 | 1.62 | 1.42 | 1.39 | 1.53 | 1.43 | 2.52 | 2.42 |
| gender (% female) | 50.09 | 46.39 | 48.28 | 50.31 | 50.80* | 50.97* | 50.11 | 48.75 | 49.48 |
| % Received treatment before 42 months of age | 6.41 | 7.16 | 6.05 | 8.06 | 8.54 | 4.03** | 6.83 | 23.68 | 0.26 |
| Number of well child visits | 1.47 (1.13) | 1.81 (1.09) | 1.68** (1.11) | 1.50** (1.13) | 1.38** (1.14) | 1.35** (1.11) | 1.48 (1.13) | 1.44 (1.14) | 1.11 (1.08) |
| % Continuously enrolled | 62.79 | 70.46 | 67.8 | 65.60* | 61.88** | 58.32** | 63.37 | 59.25 | 45.68 |
| County level variables | |||||||||
| County Metropolitan status | |||||||||
| Urban | 75.43 | 83.23 | 80.44 | 77.39** | 75.05** | 71.04** | 75.52 | 68.89 | 66.11 |
| Non-metropolitan 1 | 21.38 | 15.09 | 17.59 | 19.50** | 21.67** | 24.99** | 21.27 | 26.12 | 28.65 |
| Non-metropolitan 2 | 3.19 | 1.68 | 1.97 | 3.11 | 3.28* | 3.97** | 3.21 | 4.99 | 5.24 |
| Percent of population under 18 enrolled in Medicaid | 32.73 (8.57) | 29.98 (7.59) | 31.31 (7.87) | 32.33 (8.17) | 33.16* (8.48) | 33.78** (9.08) | 32.68 (8.54) | 34.17 (9.07) | 34.67 (8.97) |
| Dentists per capita | 4.56 (2.02) | 5.06 (1.88) | 4.92 (1.95) | 4.74** (2.01) | 4.49** (2.00) | 4.26** (2.05) | 4.57 (2.03) | 4.21 (2.02) | 4.03 (1.94) |
Statistically different at the p<.05 level;
statistically different at the p<.01 level, differences between children who had a visit by age 18 months and the other age categories using pairwise mean comparisons with Tukey’s Honestly Significant Difference test
Treatment
Children in the sample had an average of 2.54 caries-related treatments from age 43-72 months. Children who had a primary or secondary preventive visit by age 18 months had fewer treatments than children who had their first preventive visit at age 25-42 months (Table 2; Tukey p-value < .01); however, children who had a preventive visit by age 18 months were also enrolled in Medicaid for a significantly shorter time (Table 2; Tukey p-value < .01). When (log) months of enrollment is used as an offset in a ZINB model without adjustment for covariates, children who had a preventive visit by age 18 months had no statistically significant difference in treatment rates at age 43-72 months as compared to children in the other categories (results not shown). Likewise, when covariates and the offset were included, children who had a preventive visit by age 18 months had no statistically significant difference in treatment rates at age 43-72 months as compared to other children (Table 3).
Table 3.
Incidence Density Ratios from the zero-inflated negative binomial model for the number of treatment procedures over the months in enrolled in Medicaid age 43 - 72 months
| Primary or Secondary Preventive Visit (N=19,888) | Tertiary Preventive Visit (N=14,389) | |||||
|---|---|---|---|---|---|---|
| IDR | 95% CI | IDR | 95% CI | |||
| Lower | Upper | Lower | Upper | |||
| Age of first preventive visit | ||||||
| < 18 months (Reference) | ||||||
| 18-24 months | 0.98 | 0.87 | 1.11 | 1.19 * | 1.03 | 1.38 |
| 25-30 months | 1.06 | 0.94 | 1.19 | 1.21 ** | 1.06 | 1.39 |
| 31-36 months | 1.08 | 0.96 | 1.20 | 1.13 ± | 0.99 | 1.30 |
| 37-42 months | 1.06 | 0.95 | 1.18 | 1.39 ** | 1.22 | 1.59 |
| Individual level variables | ||||||
| Race | ||||||
| White (Reference) | ||||||
| Black | 0.89 ** | 0.84 | 0.95 | 0.88 ** | 0.84 | 0.94 |
| Hispanic | 1.38 ** | 1.28 | 1.48 | 1.15 ** | 1.08 | 1.24 |
| Other | 1.24 * | 1.01 | 1.52 | 0.96 | 0.82 | 1.13 |
| Gender (female) | 0.93 ** | 0.88 | 0.97 | 0.93 ** | 0.89 | 0.98 |
| Number of well child visits | 0.98 * | 0.95 | 1.00 | 0.98 * | 0.95 | 1.00 |
| Continuously enrolled | 0.91 ** | 0.86 | 0.96 | 0.90 ** | 0.86 | 0.95 |
| Received treatment before 42 months of age | 1.09 ± | 1.00 | 1.20 | 0.77 ** | 0.73 | 0.82 |
| County level variables | ||||||
| Percent enrolled in Medicaid | 2.10 ** | 1.41 | 3.12 | 1.33 | 0.91 | 1.94 |
| Metropolitan status | ||||||
| Urban (Reference) | ||||||
| Non-metro 1 | 1.04 | 0.97 | 1.11 | 1.00 | 0.93 | 1.07 |
| Non-metro 2 | 0.88 | 0.76 | 1.03 | 0.86 * | 0.76 | 0.97 |
| Number of dentists per capita | 0.97 ** | 0.95 | 0.98 | 0.98 ** | 0.96 | 0.99 |
| Constant | 0.19 ** | 0.15 | 0.23 | 0.26 ** | 0.21 | 0.32 |
Significance level:
p<.10;
p<.05,
p<.01
Expenditures
Children who had a primary or secondary preventive visit by age 18 months were less likely to have treatment expenditures at age 43-72 months than children who had their first visit from 25-42 months, but their exposure time was also less (Table 2). When the spline of the number of months enrolled was included in the logit model predicting any expenditure without adjusting for other covariates, there was no statistically significant difference in the odds of having treatment expenditures among children in the different age categories (results not shown). Among children who had any expenditure, the average treatment expenditures did not differ significantly between children who had a visit by 18 months and those in other age categories on the bivariate level.
After adjusting for child and county characteristics, children who had a visit by age 18 months had no statistically significant difference in the likelihood or amount of treatment related expenditures than children who had a visit at older ages (Table 4). Among children who had any treatment expenditure from age 43-72 months, the predicted expenditure per year for each respective age category was $287±97, $297±99, $323±104, $311±97 and $287±78 (Figure 1).
Table 4.
Likelihood of any dental treatment expenditure odds ratios (OR) and ordinary least square (OLS) regression results for logged dental treatment expenditures at age 43-72 months among children who had any expenditure
| Logit predicting any expenditure for Primary or Secondary Preventive Visit (N=19,888) | OLS results for logged expenditures among children who had any for Primary or Secondary Preventive Visit (N=13,677) | Logit predicting any expenditure for Tertiary Preventive Visit (N=14,389) | OLS results for logged expenditures among children who had any for Tertiary Preventive Visit (N=10,103) | |||||||||
|---|---|---|---|---|---|---|---|---|---|---|---|---|
| OR | 95% CI | B | 95% CI | OR | 95% CI | B | 95% CI | |||||
| Lower | Upper | Lower | Upper | Lower | Upper | Lower | Upper | |||||
| Age of first preventive visit | ||||||||||||
| < 18 months (Reference) | ||||||||||||
| 18-24 months | 0.92 | 0.80 | 1.06 | 0.03 | -0.06 | 0.13 | 1.09 | 0.90 | 1.33 | 0.28 ** | 0.13 | 0.42 |
| 25-30 months | 0.94 | 0.81 | 1.08 | 0.08 | -0.02 | 0.17 | 1.05 | 0.87 | 1.27 | 0.31 ** | 0.17 | 0.46 |
| 31-36 months | 1.01 | 0.88 | 1.16 | 0.06 | -0.03 | 0.15 | 1.11 | 0.92 | 1.33 | 0.18 ** | 0.04 | 0.32 |
| 37-42 months | 1.10 | 0.96 | 1.26 | 0.01 | -0.08 | 0.10 | 1.31 ** | 1.09 | 1.58 | 0.34 ** | 0.20 | 0.47 |
| Individual level variables | ||||||||||||
| Race | ||||||||||||
| White (Reference) | ||||||||||||
| Black | 1.00 | 0.93 | 1.08 | -0.14 ** | -0.19 | -0.09 | 0.98 | 0.90 | 1.07 | -0.23 ** | -0.29 | -0.17 |
| Hispanic | 1.80 ** | 1.61 | 2.01 | 0.25 ** | 0.19 | 0.32 | 1.68 ** | 1.49 | 1.90 | 0.13 ** | 0.05 | 0.20 |
| Other | 1.27 ± | 0.96 | 1.69 | 0.21 * | 0.03 | 0.39 | 1.00 | 0.78 | 1.28 | -0.07 | -0.25 | 0.12 |
| Gender (female) | 1.02 | 0.96 | 1.09 | -0.03 ± | -0.08 | 0.01 | 1.06 | 0.98 | 1.14 | -0.06 * | -0.12 | -0.01 |
| Number of well child visits | 1.04 * | 1.01 | 1.07 | -0.02 * | -0.04 | 0.00 | 1.03 ± | 0.99 | 1.07 | -0.04 ** | -0.06 | -0.01 |
| Continuously enrolled | 1.29 ** | 1.20 | 1.38 | -0.04 ± | -0.09 | 0.00 | 1.15 ** | 1.06 | 1.25 | -0.04 | -0.10 | 0.01 |
| Received treatment before 42 months of age | 1.68 ** | 1.46 | 1.94 | 0.30 ** | 0.22 | 0.37 | 1.19 ** | 1.07 | 1.31 | -0.16 ** | -0.22 | -0.09 |
| County level variables | ||||||||||||
| Percent enrolled in medicaid | 2.92 ** | 1.75 | 4.87 | 0.40 * | 0.07 | 0.73 | 1.82 * | 1.02 | 3.26 | 0.09 | -0.31 | 0.50 |
| Metropolitan status | ||||||||||||
| Urban (Reference) | ||||||||||||
| Non-metro 1 | 0.86 ** | 0.78 | 0.94 | -0.01 | -0.07 | 0.05 | 0.81 ** | 0.73 | 0.90 | -0.03 | -0.11 | 0.04 |
| Non-metro 2 | 0.76 ** | 0.62 | 0.92 | -0.18 * | -0.31 | -0.04 | 0.74 ** | 0.61 | 0.89 | -0.03 | -0.17 | 0.12 |
| Number of dentists per capita | 1.04 ** | 1.02 | 1.06 | -0.02 * | -0.03 | 0.00 | 1.06 ** | 1.03 | 1.08 | -0.01 | -0.02 | 0.01 |
| Months enrolled spline 1 | 1.22 ** | 1.21 | 1.24 | -0.07 ** | -0.08 | -0.05 | 1.19 ** | 1.17 | 1.21 | -0.06 ** | -0.07 | -0.04 |
| Months enrolled spline 2 | 1.04 ** | 1.02 | 1.05 | 0.00 | -0.01 | 0.01 | 1.03 ** | 1.01 | 1.05 | 0.00 | -0.01 | 0.01 |
| Months enrolled spline 3 | 1.06 ** | 1.04 | 1.08 | -0.01 * | -0.03 | 0.00 | 1.10 ** | 1.07 | 1.13 | -0.03 ** | -0.05 | -0.01 |
| Months enrolled spline 4 | 2.93 * | 1.27 | 6.76 | 0.19 | -0.25 | 0.62 | 0.80 | 0.26 | 2.43 | 0.66 * | 0.06 | 1.27 |
| Constant | 0.06 ** | 0.05 | 0.09 | 5.79 ** | 5.57 | 6.01 | 0.08 ** | 0.06 | 0.12 | 6.04 ** | 5.74 | 6.35 |
Significance level:
p<.10;
p<.05,
p<.01
Figure 1. Predicted expenditures per year for dental treatment from 43-72 months of age for children who had any expenditure.
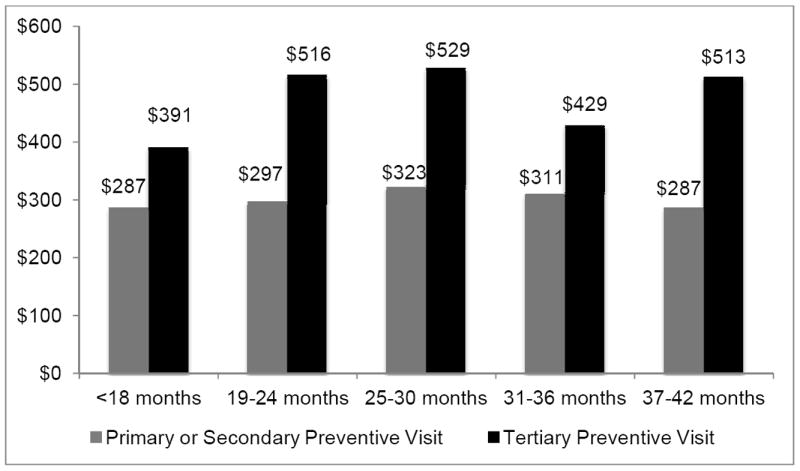
Legend: Expenditures were predicted for children with any expenditures based on ordinary least squares (OLS) regression model using a smearing factor assuming heteroskedastic and normal errors.
Sensitivity analysis
Using the primary prevention definition, we found no statistically significant differences in the rate of treatment, likelihood or amount of expenditures associated with treatment between children who had a visit by age 18 months and children in the other age categories (results not shown).
Using the tertiary preventive definition, children who had their first preventive visit by age 18 months had statistically significant lower rates of treatment than children who had visits at older ages (Table 3). Children who had a visit at age 37-42 months had significantly greater odds to have a treatment expenditure than those who had a visit by age 18 months; children in each of the older age categories also had significantly higher expenditures than children who had a visit by age 18 months (Table 4). The predicted expenditure per year for each respective age category was $391±138, $516±178, $529±178, $429±150 and $513±156 (Figure 1).
Discussion
This study compared dental treatment amounts and expenditures for children enrolled in Medicaid who had preventive visits at varying ages before 3½ years of age to inform policy on whether preventive dental check-ups should be advised for all Medicaid children by age one year. Compared to children who had a visit by age 18 months, children who had a primary or secondary preventive visit at age two or three years had no significant difference in dental outcomes at age 3½ to 6 years.
Children with existing disease who received a tertiary preventive visit by age 18 months had 19% to 39% fewer treatments per time enrolled and were predicted to have $38-$138 fewer treatment related expenditures per year from age 3½ to 6 years than children who had tertiary preventive visits at older ages. Studies have found that the most significant risk factor for future dental disease is past caries experience;22-23 therefore, children with existing disease at young ages are at high risk for needing subsequent treatment. Taken together, these findings support a Medicaid periodicity schedule that recommends a preventive dental visit by one year of age for children with existing dental disease and those at highest risk for disease, and to allow other children to delay a first preventive visit until age 3 years, particularly where dental workforce does not permit every child to have a visit at 1 year of age.
Currently, dentist workforce and other resources may be insufficient for all children to visit the dentist for a preventive check-up by age one year. A simulation study demonstrated that a policy that promotes early preventive dental visits among both privately and publicly insured children could increase the rate of dental disease at the population level by crowding out Medicaid children if the supply of dental visits available to children is limited.24 A national shortage of dentists remains, and the supply of dentists in NC is below the national average.25 Sixty-percent of NC’s counties are designated as Dental Health Professional Shortage Areas for the entire county or for the low-income population in the county.25 Many dentists are not willing to treat young children enrolled in Medicaid because reimbursement fees are set at below market rates and a lack of training in infant and toddler oral health care.26-28 If the supply of dental appointments available to young children in Medicaid remains constrained, our results indicate that policies can prioritize children who are most in need of early dental care.
The lack of dental appointments available to young children highlights the need to identify children at an early age who have existing disease or are at elevated risk for dental disease. Interventions that educate physicians on identifying children at high risk for dental disease and cultivate partnerships between medical and dental providers may facilitate children at high risk being seen by a dentist early.29-30 Risk assessments such as Bright Future’s clinical assessment tool can be used by physicians to determine the child’s risk status.31 Other programs, such as the WIC program and Early Head Start, have also been shown to lead to higher rates of dental use and lower rates of emergency dental use32-33 and thus may be used to identify and refer young children with dental disease.
The only previously published study on the effects of early preventive dental visits found that they resulted in cost savings14, but two other analyses found no relationship between an early visit and dental costs or treatment.15-16 When we use a similar definition that was used in the previous studies in which preventive services alone are used to define the visit, our results are similar to the previously published study from NC.12
The primary limitation of this study is that it is observational and thus could suffer from selection bias from unobserved factors, especially unobserved risk of dental disease. If children at lower or higher risk for disease had early preventive visits, our results would over or under estimate the effect of an early preventive visit, respectively. Our data indicate that both children at high and low risk may be visiting the dentist early. Children with early visits were both more likely to have well child visits, an indicator of low risk, and also have received dental treatment early, an indicator of high risk.
This study also likely suffers from other sources of omitted variable bias. We did not have individual demographic data such as income, parent’s education or oral hygiene behaviors that would influence their oral health and dental utilization. In this sample of young children, the risk of dental disease increases with age, so children who were enrolled longer would have a higher risk of receiving treatment. We controlled for this potential problem by including the number of months enrolled during the outcome period.
Our study also has limited generalizability as it was restricted to NC Medicaid enrollees who used dental care and received preventive services before age 42 months. Descriptive data shown in Table 2 showed that children who had a dental visit without preventive services had more treatments and expenditures, but we cannot determine from this study whether an early preventive visit would have had an effect in this population.
In this sample of preventive dental users in Medicaid, we found that children at highest risk of dental disease benefited from a visit before age 18 months, but most children could delay their first visit until age 3 years without an effect on subsequent dental outcomes. Given the current economic trends, the nation’s healthcare system is likely to continue to face constrained resources in dental care and other areas in coming years. Future research could examine other areas where focusing limited preventive resources on certain populations could improve the population’s health.
Table 1.
Preventive visit definitions comparison chart
| Definition | Targeted aim of visit | Included preventive services | Included CDT codes | Treatment exclusions |
|---|---|---|---|---|
| Main analysis | Primary or secondary prevention | Comprehensive evaluation and fluoride application | D0120, D0150, (comprehensive evaluation or periodic exam) D1201 and D1203 (fluoride, with and without prophylaxis) | No more than two restorative treatment procedures [CDT codes = D2000-D2999 (restorations, crowns, and other restorative services)] on the day of the visit or for any visit for 3 months (92 days) following the initial visit, and no other treatment [CDT codes = D0140 (problem focused evaluation), D0415 - D0460 (tests and laboratory examinations), D0470- D0501 (pathology laboratory)] on the day of the visit or in an office-based visit for 3 months (92 days) following the preventive visit, or in a hospital-based visit for 6 months (182 days) following the preventive visit |
| Sensitivity Analysis #1 | Primary prevention | Comprehensive evaluation and fluoride application | D0120, D0150, D1201 and D1203 | No treatment procedures [CDT codes = D0140, D0415, D0425, D0460, D0470-D0486, D0501, D2000-D9999 (as defined above)] on the day of the visit, or in an office-based visit for 3 months (92 days) following the preventive visit, or in a hospital-based visit for 6 months (182 days) following the preventive visit |
| Sensitivity Analysis #2 | Tertiary Prevention | Any preventive service (comprehensive evaluation, prophylaxis, and/or fluoride application) | D1000-D1999; (prophylaxis, fluoride, other preventive services) D0120 and D0150 | More than two restorative treatment procedures on the day of the visit or within 3 months at an office-based visit or in a hospital based visit within 6 months |
Acknowledgments
Funding for work presented in this paper was provided by Grant No. 1R36HS018076-01 from the Agency for Healthcare Research and Quality (AHRQ). Funding for the acquisition of the data used in this paper was provided by Grant No. R01 DE013949 and Grant No. R03 DE017350, both from the National Institute of Dental and Craniofacial Research. The content is solely the responsibility of the authors and does not necessarily represent the official views of the AHRQ, NIDCR or the National Institutes of Health (NIH).
Abbreviations
- ECC
Early Childhood Caries
- NC
North Carolina
- ZINB
Zero Inflated Negative Binomial
- OLS
Ordinary Least Squares
References
- 1.Dye BA, Tan S, Smith V, et al. Trends in oral health status: United States, 1988–1994 and 1999–2004. National Center for Health Statistics. Vital Health Stat Rep. 2007;11(248) [PubMed] [Google Scholar]
- 2.US Department of Health and Human Services. Oral Health in America: A Report of the Surgeon General. Rockville, MD: US Department of Health and Human Services, National Institute of Dental and Craniofacial Research, National Institute of Health; 2000. [Google Scholar]
- 3.Edelstein B, Douglass C. Dispelling the myth that 50 percent of US schoolchildren have never had a cavity. Public Health Reports. 1995;110:522. [PMC free article] [PubMed] [Google Scholar]
- 4.O’Sullivan D, Tinanoff N. The association of early dental caries patterns with caries incidence in preschool children. J Public Health Dent. 1996;56:81–83. doi: 10.1111/j.1752-7325.1996.tb02401.x. [DOI] [PubMed] [Google Scholar]
- 5.Edelstein BL, Manski RJ, Moeller JE. Child dental expenditures: 1996. Pediatr Dent. 2002;24:11–17. [PubMed] [Google Scholar]
- 6.Kanellis MJ, Damiano PC, Momany ET. Medicaid costs associated with the hospitalization of young children for restorative dental treatment under general anesthesia. J Public Health Dent. 2000;60(1):28–32. [PubMed] [Google Scholar]
- 7.Gift HC, Reisine ST, Larach DC. The social impact of dental problems and visits. Am J Public Health. 1992;82(12):1663–1668. doi: 10.2105/ajph.82.12.1663. [DOI] [PMC free article] [PubMed] [Google Scholar]
- 8.Blumenshine SL, Vann WF, Jr, Gizlice Z, Lee JY. Children’s school performance: impact of general and oral health. J Public Health Dent. 2008;68(2):82–87. doi: 10.1111/j.1752-7325.2007.00062.x. [DOI] [PubMed] [Google Scholar]
- 9.American Dental Association. [September 3, 2009];ADA Statement on Early Childhood Caries. 2008 [ADA website]. Available at: http://www.ada.org/prof/resources/positions/statements/caries.asp.
- 10.American Academy of Pediatric Dentistry. Guideline on Periodicity of Examination, Preventive Dental Services, Anticipatory Guidance/Counseling, and Oral Treatment for Infants, Children, and Adolescents. [October 12, 2011];2009 [AAPD website]; Available at: ttp:// www.aapd.org/media/policies_guidelines/g_periodicity.
- 11.American Academy of Pediatrics. Recommendations for Preventive Pediatric Health Care. [September 17, 2009];2008. [AAP web site] Available at: http://pediatrics.aappublications.org/cgi/data/120/6/1376/DC1/1.
- 12.Center for Medicare and Medicaid Services. Policy Issues in the Delivery of Dental Services to Medicaid Children and Their Families. 2008 [Google Scholar]
- 13.American Dental Association Council on Scientific Affairs. Professionally applied topical fluoride: evidence-based clinical recommendations. J Am Dent Assoc. 2006;137:1151–1159. doi: 10.14219/jada.archive.2006.0356. [DOI] [PubMed] [Google Scholar]
- 14.Savage MF, Lee JY, Kotch JB, et al. Early preventive dental visits: effects on subsequent utilization and costs. Pediatrics. 2004;114(4):e418–423. doi: 10.1542/peds.2003-0469-F. [DOI] [PubMed] [Google Scholar]
- 15.Snyder A. Early Preventive Dental Care: The Wisconsin Experience. Oral presentation presented at the National Oral Health Conference; May, 2007; Denver, Colorado. [Google Scholar]
- 16.Sohn W, Lim S, Ismail AI. Effects of early Preventive Dental Visits among Medicaid enrolled Children. J Dent Res. 2008;87(Special Issue B) Abstract #0103. [Google Scholar]
- 17.North Carolina Health Professionals Data System (NCHPDS) [database online] Cecil G. Sheps Center for Health Services Research; [September 3, 2009]. Available at: http://www.shepscenter.unc.edu/hp/ [Google Scholar]
- 18.Community-Level Information on Kids (CLIKS) [database online] The Annie E. Casey Foundation; [September 3, 2009]. Available at: http://www.kidscount.org/cgi-bin/cliks.cgi 2005. [Google Scholar]
- 19.US Department of Agriculture Economic Research Service. Rural-Urban Continuum Codes. [September 17, 2009]; Available at: http://www.ers.usda.gov/Data/RuralUrbanContinuumCodes/
- 20.Rozier RG, Sutton BK, Bawden JW, et al. Prevention of early childhood caries in North Carolina medical practices: Implications for research and practice. J Dent Educ. 2003;67:876–885. [PubMed] [Google Scholar]
- 21.Brickhouse TH, Rozier RG, Slade GD. The effect of two publicly funded insurance programs on use of dental services for young children. Health Serv Res. 2006;41:2033–2053. doi: 10.1111/j.1475-6773.2006.00586.x. [DOI] [PMC free article] [PubMed] [Google Scholar]
- 22.Litt MD, Reisine S, Tinanoff N. Multidimensional causal model of dental caries development in low-income preschool children. Public Health Reports. 1995;110(5):607. [PMC free article] [PubMed] [Google Scholar]
- 23.Powell L. Caries prediction: a review of the literature. Community Dent Oral Epidemiol. 1998;26(6):361–371. doi: 10.1111/j.1600-0528.1998.tb01974.x. [DOI] [PubMed] [Google Scholar]
- 24.Jones K, Tomar SL. Estimated impact of competing policy recommendations for age of first dental visit. Pediatrics. 2005;115(4):906–914. doi: 10.1542/peds.2004-1687. [DOI] [PubMed] [Google Scholar]
- 25.Fraher E, Gaul K, King J, et al. Trends in the Supply of Dentists in North Carolina, 1996-2005. NC Health Professions Data System, Cecil G. Sheps Center for Health Services Research, University of North Carolina; Chapel Hill: 2007. [Google Scholar]
- 26.Mofidi M, Rozier RG, King RS. Problems with access to dental care for Medicaid-insured children: what caregivers think. Am J Public Health. 2002;92(1):53. doi: 10.2105/ajph.92.1.53. [DOI] [PMC free article] [PubMed] [Google Scholar]
- 27.Decker SL. Medicaid Payment Levels to Dentists and Access to Dental Care Among Children and Adolescents. JAMA. 2011;306(2):187. doi: 10.1001/jama.2011.956. [DOI] [PubMed] [Google Scholar]
- 28.Gehshan S, Snyder A, Paradise J. Filling an Urgent Need: Improving Children’s Access to Dental Care in Medicaid and SCHIP. [January 5, 2012];2008 Available at: www.kff.org/medicaid/upload/7792.pdf.
- 29.Kressin N, Nunn M, Singh H, et al. Pediatric Clinicians Can Help Reduce Rates of Early Childhood Caries: Effects of a Practice Based Intervention. Med Care. 2009;47(11):1121. doi: 10.1097/MLR.0b013e3181b58867. [DOI] [PMC free article] [PubMed] [Google Scholar]
- 30.Sanchez OM, Childers NK. Anticipatory guidance in infant oral health: rationale and recommendations. Am Fam Physician. 2000;61:115–120. 123–124. [PubMed] [Google Scholar]
- 31.Casamassimo P, Holt K, editors. Bright Futures in Practice: Oral Health-Pocket Guide. Washington D.C.: National Maternal and Child Oral Health Resource Center; 2004. [Google Scholar]
- 32.Lee J, Rozier R, Norton E, et al. Effects of WIC participation on children’s use of oral health services. Am J Public Health. 2004;94(5):772. doi: 10.2105/ajph.94.5.772. [DOI] [PMC free article] [PubMed] [Google Scholar]
- 33.Kaneilis M. Caries risk assessment and prevention: strategies for Head Start, Early Head Start, and WIC. J Public Health Dent. 2000;60(3):210–217. doi: 10.1111/j.1752-7325.2000.tb03330.x. [DOI] [PubMed] [Google Scholar]