

Abstract
Although obesity has been linked to structural brain changes, little is known about its associations with the rates of brain atrophy. We examined associations between global (BMI) and central (waist circumference) midlife obesity and subsequent trajectories of regional brain atrophy in 152 individuals [M (age) = 69 ± 7.8] prospectively followed through the Baltimore Longitudinal Study of Aging; 21 individuals became impaired during follow‐up. We report no associations (P > 0.05) between either global or central midlife obesity and subsequent rates of regional brain volume changes against a background of age‐related atrophy in older individuals who remained nondemented. When looking at the entire sample, greater decline was observed in the volume of gray matter, precuneus, cingulate and orbito‐frontal gyri for globally obese (P < 0.03), even though only data up to the point of dementia diagnosis were included in the analyses (i.e., while still considered clinically normal). Moreover, when trajectories of regional volume changes were examined across the range of BMI and waist circumference values instead of employing a cut‐off point to define obesity, a different pattern of results emerged. Overall, our results suggest that midlife obesity may be an important modifier of brain atrophy in individuals who are developing cognitive impairment and dementia, while it has little effect on structural brain integrity in nondemented older adults. Moreover, the discrepancies in findings between studies may be in part due to participant sampling and methodological differences. Hum Brain Mapp 33:2204–2210, 2012. Published 2011 Wiley Periodicals, Inc.
Keywords: BMI, waist circumference, MRI, normal aging, MCI
INTRODUCTION
Obesity prevalence is growing rapidly [Li et al.,2007] and currently exceeds 30% in the United States [Gordon‐Larsen et al.,2003; Wang and Beydoun,2007; Zhang and Wang,2004], with highest prevalence in adults aged 50 and older [Flegal et al.,1998]. In addition to being related to a variety of unfavorable health outcomes, including cardiovascular, pulmonary, and endocrine diseases [Roman, 2003], accumulating evidence suggests that midlife obesity is also a risk for dementia later in life [Gustafson et al., 2008; Kivipelto et al.,2005; Rosengren et al.,2005; Whitmer et al.,2005]. Because obesity is potentially modifiable, it is important to identify affected structures, not only from preventative stand point but also to better understand the affected systems and their involvement in dementia and cognitive impairment.
Both computed tomography [Gustafson et al.,2003,2004] and magnetic resonance imaging (MRI) studies suggest that obesity may be associated with greater brain atrophy [for a review see Jagust,2007]. Existent studies are still limited in number, predominantly cross‐sectional in nature, and vary widely in design and investigated populations. Results of cross‐sectional investigations are questionable because loss of appetite or hyperphagia are common in the predementia stage and require clarification through prospective studies where obesity measures are obtained early on, serial imaging is collected over longer periods, and incipient dementia can be ruled out.
We examined the associations between midlife obesity and subsequent structural brain changes in a community‐dwelling, prospectively‐followed sample of 152 older adults from the Baltimore Longitudinal Study of Aging (BLSA) neuroimaging substudy [Shock et al.,1984]. We predict that the same regions that show early pathological changes in association with Alzheimer's disease (AD) [Braak and Braak,1998; Kantarci and Jack,2004; Scahill et al.,2003] would also be more sensitive to obesity.
METHODS
Participants
This report includes 152 BLSA community‐dwelling, older participants (88 men and 64 women; M (age) = 69 ± 7.8; age range 56‐86; Table I) who, in addition to neuropsychological testing, a neurological exam and interval medical history obtained during visits [Shock et al.,1984; Zonderman et al.,1995], also agreed to annual neuroimaging (NI) assessments (range = 1–10 years; M = 5.92; SD = 2.86; N = 1240 scans) between 1994 and 2003. Based on standardized consensus diagnostic procedures for the BLSA [Driscoll et al.,2006] 131 participants remained nondemented, four were diagnosed with AD and 17 with Mild Cognitive Impairment (MCI) during follow‐up. Studies were approved by the local institutional review boards (IRB). Participants gave written informed consent before each assessment.
Table I.
Sample characteristics at baseline
| NI | BLSA | Sample differences (NI – BLSA) | |
|---|---|---|---|
| Female | 42% | 40% | P = 0.57 |
| Race/ethnicity | |||
| White NH | 90% | 80% | P = 0.002 |
| Black NH | 10% | 16% | |
| Other | 0% | 4% | |
| Education; mean (SD) | 16.7 (2.7) | 16.6 (2.8) | P = 0.52 |
| Smoking status | |||
| Never | 38% | 39% | P = 0.92 |
| Ever | 62% | 61% | |
| BMI (kg/m2) M (SD) | 25.0 (3.2) | 25.8 (3.9) | P = 0.009 |
| % generally obese (BMI ≥ 30) | 6.0% | 11.7% | P = 0.03 |
| WC (cm) M (SD) | 83.1(11.5) | 86.5 (11.5) | P ≤ 0.001 |
BLSA, Baltimore longitudinal study on aging; BMI, body mass index; WC, waist circumference. Central obesity is defined as the upper quintile of WC (cm) for each gender, which yielded a 20% prevalence.
To be included in the BLSA, participants had to be in good general health. Specific exclusionary criteria at enrollment included a history of central nervous system disease (dementia, stroke, Parkinson's disease, epilepsy, and other neurological conditions), severe cardiac disease (including myocardial infarction, coronary bypass surgery, or angioplasty), and metastatic cancer. Diagnoses were made at consensus diagnostic conferences using DSM‐III‐R (American Psychiatric Association,1987) criteria for dementia and the NINCDS‐ADRDA criteria (McKhann et al.,1984) using neuropsychological diagnostic tests and clinical data. Approximately half of the sample was hypertensive, 85% of which had the condition controlled with medication.
Anthropometric Measurements
Height and weight were measured with calibrated scales by trained technicians at each visit. Global obesity is defined by body mass index (BMI; weight in kilograms divided by the square of height in meters) higher than 30 kg/m2. Central obesity is defined as sex‐specific upper quintile, based on waist circumference (WC) distribution (minimal abdominal perimeter located halfway between the rib cage and the pelvic crest).
MRI Image Acquisition and Processing
Scanning was performed on a GE Sigma 1.5 Tesla scanner (Milwaukee, WI) using a high‐resolution volumetric spoiled‐grass (SPGR) axial series (TR = 35 ms, TE = 5 ms, FOV = 24 cm, flip angle = 45°, matrix = 256 × 256, NEX = 1, voxel dimensions 0.94 × 0.94 × 1.5 mm).
Image processing procedures have been previously described in detail and validated [Davatzikos et al.,2001; Driscoll et al.,2009; Goldszal et al.,1998; Resnick et al., 2001, 2003]. Briefly, images are corrected for head tilt and rotation, and reformatted parallel to the anterior–posterior commissure plane. Extracranial tissue is removed using a semiautomated procedure followed by manual editing. Next, images are segmented into white matter (WM), gray matter (GM), and cerebrospinal fluid (CSF). The final step involves stereotaxic normalization and tissue quantitation for specific regions of interest with a template‐based deformation approach. An ICBM standard MRI (Montreal Neurologic Institute) serves as the template and a hierarchical elastic matching algorithm is used for deformation and determination of volumes of interest [Shen and Davatzikos,2002]. All images are normalized individually to the same template. Voxel‐based analysis utilizes the RAVENS approach [Goldszal et al.,1998], whereby local values of tissue density maps (for GM, WM, and CSF) reflect the amount of respective tissue in the vicinity of a voxel. Tissue densities are mathematical quantities measuring local tissue volumes and do not reflect any microstructural physical density of brain tissue.
Volumes of the following regions were examined: whole brain, ventricular cerebrospinal fluid (CSF), total white matter (WM), total gray matter (GM), frontal, temporal, parietal, and occipital WM and GM, orbito‐frontal and cingulate gyri, precuneus, and the hippocampus.
Statistical Analysis
Rates of change in select brain volumes in relation to midlife obesity were estimated using mixed‐effects regression models [Singer and Willet,2003] with age as the measure of time. Analyses were first performed on the nondemented only (N = 131), then repeated for the entire NI sample excluding the data at and after dementia diagnosis for those who became impaired during the course of the study.
BMI and WC for the NI participants who did not have the anthropometric measurements available at age 50 were estimated based on the data for the complete BLSA sample (N = 3,005; 1,806 men, and 1,199 women; Table I) collected between February 1958 and August 2006 and included available measurements at later ages for those with missing data. Method used to estimate BMI and WC at age 50 was previously published and described in detail (Beydoun et al.,2008), though the following were the two main differences in the estimation procedure: (1) only visits before onset of dementia were included in that prediction; (2) a random effect was also added for the age‐squared term.
Several socio‐demographic (sex, education, race/ethnicity) and lifestyle (smoking status as time‐dependent variable) factors were entered as predictors for both the intercept and the rate of change. Age was centered at 50 and a quadratic age term was entered to allow rate of change to vary over time. Age and quadratic age terms were added in both the fixed and random effect estimations. Slopes and intercepts were allowed to vary between individuals. Year of birth was added as a predictor for both the intercept and the slope to control for secular changes in body weight. By fixing age (centered at 50) to zero and adding the estimated random effects for each individual to the fixed effect portion of the model, we computed the Empirical Bayes estimators of the slope and the intercept for each subject and used the intercept as a predictor for BMI or WC at age 50.
Linear mixed models were used to determine the associations between BMI or WC at age 50 and subsequent annual rates of change in regional brain volumes. All covariates (intracranial volume, sex, race/ethnicity, education and smoking status) were entered into the model as predictors for the intercept. The full model was then reduced by backward elimination of nonsignificant terms at α = 0.1. A quadratic age term was added to the reduced model to examine possible nonlinear trajectories and presented using LOWESS smoothed curves [Schimek,2000]. We also investigated whether associations with regional volume changes would be similar across the range of BMI and WC values and performed secondary analyses with BMI and WC as continuous variables.
Covariates
Age at visit, sex, race/ethnicity, education, smoking status (never, former, or current smoker) and year of birth were included as covariates in both predictive models and the main analyses. Sex, race/ethnicity, education and smoking status were used to predict baseline regional brain volumes, while BMI or WC at age 50 were used in prediction of both baseline volumes and annual rates of change, controlling for intracranial volume.
RESULTS
We first present the results of categorical analyses using cut‐off points to define obesity, followed by analyses using BMI and waist circumference as continuous measures. We characterize the trajectories of regional brain volume loss in older adults who remain clinically normal separately to establish a solid foundation. Analyses for the entire sample include data only up to the point of dementia diagnosis for 21 individuals who became impaired during follow up (i.e., while they were still considered clinically normal). Overall, age‐related volume loss was present for all 16 regions investigated (P ≤ 0.01). All regions, except for the precuneus (P = 0.01), survive the Bonferroni correction for multiple comparisons (P ≤ 0.003).
No significant major effects of either global or central obesity (P ≥ 0.05; Table II), nor age by obesity interactions were observed in the nondemented (P > 0.05). When data up to the point of diagnosis for those who became impaired during follow‐up were included, a significant main effect of global obesity was observed for frontal, temporal and parietal GM (P ≤ 0.05); none survived the Bonferroni correction. Steeper rates of age‐related volume decline were observed for total, frontal, and temporal GM, orbito‐frontal and cingulate gyri, and the precuneus (P < 0.05: Table II) in those categorized as globally obese; only frontal GM and cingulate gyrus survive the Bonferroni correction. The estimated slopes for select brain regions among the obese and nonobese are presented in Figure 1.
Table II.
Trajectories of regional brain volume changes in the obese and nonobese (categorical analysis) and across the range of bmi or waist circumference values (continuous analysis)
| Outcomes | Categorical analysis | Continuous analysis | ||||||
|---|---|---|---|---|---|---|---|---|
| Nondemented only | Whole sample | Nondemented only | Whole sample | |||||
| Age X global obesity (SE) | Age X central obesity (SE) | Age X global obesity (SE) | Age X central obesity (SE) | Age X BMI | Age X WC | Age X BMI | Age X WC | |
| General | ||||||||
| Whole brain | 0.48 (0.95) | 0.13 (0.53) | −1.28 (0.92) | −0.67 (0.53) | −0.02 (0.07) | −0.03* (0.02) | −0.11 (0.06) | −0.05* (0.02) |
| vCSF | 0.03 (0.30) | −0.19 (0.18) | 0.18 (0.29) | −0.20 (0.17) | −0.02 (0.02) | −0.00 (0.06) | −0.01 (0.02) | 0.003 (0.01) |
| WM | 0.93 (0.81) | 0.24 (0.44) | 0.20 (0.20) | −0.31 (0.46) | 0.04 (0.06) | −0.02 (0.01) | −0.03 (0.06) | −0.03* (0.01) |
| GM | −0.44 (0.73) | −0.19 (0.41) | −1.65* (0.77) | −0.49 (0.45) | −0.09 (0.05) | −0.02 (0.01) | −0.11 (0.05) | −0.02 (0.02) |
| WM | ||||||||
| Frontal | 0.15 (0.34) | −0.06 (0.19) | −0.09 (0.33) | −0.23 (0.18) | 0.01 (0.02) | −0.01* (0.01) | −0.02 (0.02) | −0.02* (0.01) |
| Temporal | 0.36 (0.27) | −0.07 (0.15) | 0.07 (0.27) | −0.23 (0.15) | −0.01 (0.02) | −0.02*** (0.004) | −0.03 (0.02) | −0.02*** (0.01) |
| Parietal | 0.19 (0.20) | 0.09 (0.11) | 0.28 (0.19) | 0.04 (0.10) | 0.02 (0.01) | 0.004 (0.003) | 0.01 (0.01) | 0.004 (0.003) |
| Occipital | 0.20 (0.18) | 0.04 (0.09) | 0.07 (0.17) | −0.01 (0.09) | 0.01 (0.01) | −0.004 (0.003) | −0.002 (0.01) | −0.01* (0.003) |
| GM | ||||||||
| Frontal | −0.36 (0.29) | −0.11 (0.15) | −0.86* (0.28) | −0.28 (0.16) | −0.03 (0.02) | −0.005 (0.01) | −0.02 (0.02) | −0.01 (0.01) |
| Temporal | −0.28 (0.21) | 0.11 (0.12) | −0.64* (0.23) | −0.05 (0.13) | 0.01 (0.02) | 0.001 (0.004) | −0.02 (0.02) | −0.002 (0.01) |
| Parietal | 0.03 (0.19) | 0.06 (0.10) | −0.32 (0.22) | −0.06 (0.12) | −0.01 (0.01) | −0.003 (0.003) | −0.01 (0.02) | −0.002 (0.004) |
| Occipital | 0.07 (0.15) | −0.02 (0.08) | 0.08 (0.15) | −0.03 (0.08) | −0.01 (0.01) | −0.001 (0.002) | −0.001 (0.01) | 0.003 (0.003) |
| Other | ||||||||
| Orbito‐frontal | 0.04 (0.06) | 0.00 (0.03) | −0.15* (0.07) | −0.04 (0.04) | 0.00 (0.00) | 0.002 (0.001) | −0.001 (0.01) | −0.000 (0.001) |
| Cingulate | −0.03 (0.07) | 0.01 (0.04) | −0.20* (0.07) | −0.05 (0.04) | −0.01 (0.00) | −0.001 (0.001) | −0.01* (0.01) | −0.003* (0.001) |
| Hippocampus | 0.02 (0.01) | 0.00 (0.01) | 0.01 (0.01) | 0.00 (0.01) | 0.01 (0.01) | 0.00 0.00 | 0.001 (0.001) | −0.0002 (0.0003) |
| Precuneus | −0.01 (0.02) | 0.01 (0.01) | −0.11*** (0.03) | −0.02 (0.01) | 0.00, 0.00 | −0.001, 0.003 | −0.003, 0.002 | −0.001, (0.001) |
Abbreviations: WM = white matter; GM = gray matter; vCSF = ventricular cerebro‐spinal fluid; SE = standard error.
***P ≤ 0.003 (Bonferroni adjusted);
P ≤ 0.05.
Figure 1.
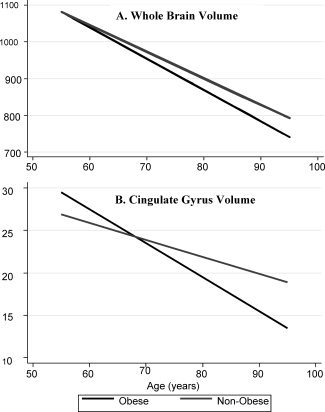
Select trajectories of select brain volume changes (cm3) in relation to global midlife obesity (BMI). Age‐related volume decline in (A) whole brain volume is similar between obese and nonobese, while (B) cingulate gyrus volume declines at a significantly steeper rate in the obese.
Although our primary goal was to examine the relationships between midlife obesity and regional brain volume changes, we also asked whether the relationships hold across the range of BMI and WC values. A different pattern of results from that observed with categorical analysis emerges, especially in relation to central obesity. Briefly, we find no differences in age‐related regional volume decline across the range of BMI values in nondemented older individuals (P > 0.05) and significantly steeper decline in the cingulate gyrus volume (P < 0.01) with increasing BMI when data up to the point of diagnosis are included for those who became impaired. For each unit increase in WC, steeper age‐related volume declines were observed for the whole brain, and frontal and temporal WM (P < 0.05) in the nondemented, although only temporal WM survives the Bonferroni correction. Similarly, whole brain, total, frontal, temporal and occipital WM, and cingulate gyrus volumes experienced steeper declines with increasing WC (P < 0.05) when data up to the point of diagnosis are included for those who became impaired during the course of the study, with only temporal WM surviving the Bonferroni correction.
Significance level with Bonferroni correction for multiple comparisons is set at P ≤ 0.003. We also highlight the results that were significant at the conventional P ≤ 0.05 for the following reasons: (1) to allow a direct comparison to the normative data on brain volume we recently published on the larger BLSA sample (Driscoll et al.,2009) and (2) to help guide future regional brain volume investigations given the general lack of significant findings.
DISCUSSION
We investigated the prospective associations between midlife obesity and subsequent trajectories of brain atrophy in the BLSA. We report no associations between either central or global midlife obesity with subsequent rates of global and regional brain volume changes against the background of generalized age‐related atrophy in nondemented older individuals. Although sparse, relationships between rates of brain atrophy and obesity begin to emerge when data up to the point of dementia diagnosis are included for those individuals who become impaired during the course of the study. The associations seem to be predominantly present in relation to global obesity and largely driven by frontal and temporal GM changes (Table II).
When examining the associations with regional volume changes across the range of BMI and WC values as opposed to employing a cut‐off point to define obesity, a slightly different pattern of results emerges. Higher BMI is associated with steeper decline in cingulate volume. Additional associations emerge in relation to larger WC, namely steeper rates of atrophy in whole brain and WM matter volume, especially once the data up to the point of dementia diagnosis are included for those individuals who become impaired during follow‐up.
The pattern of result obtained across the range of BMI and WC values differed from the categorical analysis employing a cut‐off to define obesity most likely due to greater power afforded by the continuous analysis. Majority of the findings, however, do not survive corrections for multiple comparisons. Overall, our results suggest little in terms of relationships between midlife obesity and rates of brain volume changes in nondemented older adults but that obesity may act as a modifier of regional brain atrophy in those who are succumbing to age‐related impairment. To fully explore this possibility, a larger number of impaired individuals followed over longer intervals will allow for a more direct evaluation of the effect that impending cognitive impairment has on the relationship between brain volumes and obesity, currently not possible in the BLSA which is limited to those who become impaired during the course of the study.
Current literature, albeit still limited and predominantly cross‐sectional in nature, identifies several regions of smaller volumes in association with obesity, namely the whole brain volume [Debette et al.,2010; Enzinger et al.,2005; Raji et al.,2010; Ward et al.,2005], GM [Pannacciulli et al.,2006; Taki et al.,2008], prefrontal regions [Enzinger et al.,2005; Raji et al.,2010; Walther et al.,2010] and the temporal lobe [Jagust,2007; Walther et al.,2010] including the hippocampus [Jagust et al.,2005; Raji et al.,2010], in various age groups of nondemented individuals. Given that we see no relationship between obesity and the rates of regional brain atrophy in the nondemented, both when employing an obesity cut‐off and when looking across the range of values, our findings suggest that the existing cross‐sectional studies may have overestimated the relationships between brain volumes and obesity, given that (1) cross‐sectional studies, especially those focusing on middle‐aged adults or younger, may not be effective at screening out individuals who will eventually become impaired and (2) even the inclusion of data before diagnosis for those who became impaired may change the results substantially.
The study is not without limitations. Our sample is not population‐based; the majority of the sample is highly educated and Caucasian. This, however, should not undermine many unique advantages of the study, such as the large number of follow‐ups, relatively short periods between assessments, state‐of‐the art image processing methods, and the extensive screening and characterization of this cohort. The relative homogeneity of the sample can also be viewed as an advantage given that the majority of our sample has good access to medical care and has remained relatively healthy over the follow‐up interval. Potentially, the biggest limitation is that obesity measurements at age 50 were not available for all NI participants and had to be estimated based on both their available data at later ages and the larger BLSA sample (N = 3005) which was demographically similar to the neuroimaging subsample. Although the number of globally obese individuals in this cohort was low, identical pattern of results was obtained in the nondemented regardless of the type of obesity (global vs. central) or analyses performed (continuous vs. using a cut‐off to define obesity).
To the best of our knowledge, this is the first study exploring the relationship between midlife obesity and subsequent longitudinal brain volume changes in a number of regions of interest which have not been previously investigated in relation to obesity. Our longitudinal design addresses some of the limitations in the existent literature imposed by their cross‐sectional nature or limited follow‐ups. Together, our results suggest that that the relationships between global and central obesity and age‐related brain atrophy may be small to nonexistent in the nondemented older individuals. Furthermore, global and central obesity may have differential contributions to brain volume changes, especially in samples containing individuals who later become cognitively impaired.
More importantly, our finding suggests that the results and hence, the potential discrepancies in findings between different studies may be in part due to the fundamental difference in analyses and participant sampling. The fact that relationships with regional brain volumes seem to emerge when data are included, although only before dementia diagnosis, for those who eventually became impaired, suggest that the relationships between obesity and structural brain integrity should be further investigated separately with respect to normal and pathological aging. Indeed, a study by Ho et al. (2010) suggests higher BMI is associated with lower brain volumes in frontal, temporal, parietal, and occipital lobes in those with AD and Mild Cognitive Impairment. Longitudinal studies will remain critical in determining the clinical relevance of observed brain changes in relation to obesity in both normal aging and cognitive impairment. Further studies are needed to elucidate the mechanisms by which midlife obesity may affect brain atrophy and subsequent risk for dementia. Such studies can better inform the development of animal models and set the stage for more effective population and epidemiological studies. Moreover, molecular mechanisms mediating the relationship between obesity parameters, brain structure, and dementia have yet to be elucidated [see Whitmer,2007 for a review].
This article is a US Government work and is in the public domain in the USA.
Footnotes
This article is a US Government work, and as such, is in the public domain in the United States of America.
REFERENCES
- American Psychiatric Association ( 1987): Diagnostic and Statistical Manual of Mental Disorders, 3rd ed. Washington, DC: APA. [Google Scholar]
- Beydoun MA, Lhotsky A, Wang Y, Dal Forno G, An Y, Metter EJ, Ferrucci L, O'Brien R, Zonderman AB ( 2008): Association of adiposity status and changes in early to mid‐adulthood with incidence of Alzheimer's disease. Am J Epidemiol 168: 1179–1189. [DOI] [PMC free article] [PubMed] [Google Scholar]
- Braak H, Braak E ( 1998): Evolution of neuronal changes in the course of Alzheimer's disease. J Neural Trans Suppl 53: 127–140. [DOI] [PubMed] [Google Scholar]
- Brookmeyer R, Gray S, Kawas C ( 1998): Projections of Alzheimer's disease in the United States and the public health impact of delaying disease onset. Am J Publ Health 88: 1337–1342. [DOI] [PMC free article] [PubMed] [Google Scholar]
- Davatzikos C, Genc A, Xu D, Resnick SM ( 2001): Voxel‐based morphometry using the RAVENS maps: Methods and validation using simulated longitudinal atrophy. Neuroimage 14: 1361–1369. [DOI] [PubMed] [Google Scholar]
- Debette S, Beiser A, Hoffmann U, Decarli C, O'Donnell CJ, Massaro JM, Au R, Himali JJ, Wolf PA, Fox CS, Seshadri S ( 2010). Association of adiposity status and changes in early to mid‐adulthood with incidence of Alzheimer's disease. Ann Neurol 68: 136–144. [DOI] [PMC free article] [PubMed] [Google Scholar]
- Driscoll I, Resnick SM, Troncoso JC, An Y, O'Brien R, Zonderman AB ( 2006): Impact of Alzheimer's pathology on cognitive trajectories in non‐demented elderly. Ann Neurol 60: 688–695. [DOI] [PubMed] [Google Scholar]
- Driscoll I, Davatzikos C, An Y, Wu X, Shen D, Kraut M, Resnick SM ( 2009): Longitudinal pattern of regional brain volume change differentiates normal aging from MCI. Neurology 72: 1906–1913. [DOI] [PMC free article] [PubMed] [Google Scholar]
- Enzinger C, Fazekas F, Matthews PM, Matthews PM, Ropele S, Schmidt H, Smith S, Schmidt R ( 2005): Risk factors for progression of brain atrophy in aging: Six‐year follow‐up of normal subjects. Neurology 64: 1704–1711. [DOI] [PubMed] [Google Scholar]
- Flegal KM, Carroll MD, Kuczmarski RJ, Johnson CL ( 1998): Overweight and obesity in the United States: Prevalence and trends, 1960–1994. Int J Obes Relat Metab Disord 22: 39–47. [DOI] [PubMed] [Google Scholar]
- Goldszal AF, Davatzikos C, Pham DL, Yan MX, Bryan RN, Resnick SM ( 1998): An image‐processing system for qualitative and quantitative volumetric analysis of brain images. J Comput Assist Tomogr 22: 827–837. [DOI] [PubMed] [Google Scholar]
- Gordon‐Larsen P, Adair LS, Popkin BM ( 2003): The relationship of ethnicity, socioeconomic factors, and overweight in US adolescents. Obes Res 11: 121–129. [DOI] [PubMed] [Google Scholar]
- Gustafson D, Rothenberg E, Blennow K, Steen B, Skoog I ( 2003): An 18‐year follow‐up of overweight and risk of Alzheimer disease. Arch Intern Med 163: 1524–1528. [DOI] [PubMed] [Google Scholar]
- Gustafson D, Lissner L, Bengtsson C, Björkelund C, Skoog I ( 2004): A 24‐year follow‐up of body mass index and cerebral atrophy. Neurology 63: 1876–1881. [DOI] [PubMed] [Google Scholar]
- Gustafson D ( 2008): A life course of adiposity and dementia. Eur J Pharmacol 585: 163–175. [DOI] [PubMed] [Google Scholar]
- Hebert LE, Beckett LA, Scherr PA, Evans DA ( 2001): Annual incidence of Alzheimer disease in the United States projected to the years 2000 through 2050. Alzheimer Dis Assoc Disord 15: 169–173. [DOI] [PubMed] [Google Scholar]
- Ho AJ, Raji CA, Becker JT, Lopez OL, Kuller LH, Hua X, Lee S, Hibar D, Dinov ID, Stein JL, Jack CR Jr, Weiner MW, Toga AW, Thompson PM; Cardiovascular Health Study; ADNI ( 2010a): Obesity is linked with lower brain volume in 700 AD and MCI patients. Neurobiol Aging 31: 1326–1339. [DOI] [PMC free article] [PubMed] [Google Scholar]
- Kantarci K, Jack CR ( 2004): Quantitative magnetic resonance techniques as surrogate markers of Alzheimer's disease. NeuroRx 1: 196–205. [DOI] [PMC free article] [PubMed] [Google Scholar]
- Kivipelto M, Ngandu T, Fratiglioni L, Viitanen M, Kåreholt I, Winblad B, Helkala EL, Tuomilehto J, Soininen H, Nissinen A ( 2005): Obesity and vascular risk factors at midlife and the risk for dementia and Alzheimer's disease. Arch Neurol 62: 1556–1560. [DOI] [PubMed] [Google Scholar]
- Li C, Ford ES, McGuire LC, Mokdad AH ( 2007): Increasing trends in waist circumference and abdominal obesity among US adults. Obesity 15: 216–224. [DOI] [PubMed] [Google Scholar]
- Jagust W, Harvey D, Mungas D, Haan M ( 2005): Central obesity and the aging brain. Arch Neurol 62: 1545–1548. [DOI] [PubMed] [Google Scholar]
- Jagust W ( 2007): What can imaging reveal about obesity and the brain? Curr Alzheimer Res 4: 135–139. [DOI] [PubMed] [Google Scholar]
- McKhann G, Drachman D, Folstein M, Katzman R, Price D, Stadlan EM ( 1984): Clinical diagnosis of Alzheimer's disease: Report of the NINCDS–ADRDA Work Group under the auspices of Department of Health and Human Services Task Force on Alzheimer's disease. Neurology 34: 939–944. [DOI] [PubMed] [Google Scholar]
- Okereke O, Hankinson SE, Hu FB, Grodstein F ( 2005): Plasma C peptide level and cognitive function among older women without diabetes mellitus. Arch Intern Med 165: 1651–1656. [DOI] [PubMed] [Google Scholar]
- Pannacciulli N, Del Parigi A, Chen K, Le DS, Reiman EM, Tataranni PA ( 2006): Brain abnormalities in human obesity: A voxel‐based morphometric study. Neuroimage 31: 1419–1425. [DOI] [PubMed] [Google Scholar]
- Raji CA, Ho AJ, Parikshak NN, Becker JT, Lopez OL, Kuller LH, Hua X, Leow AD, Toga AW, Thompson PM ( 2010): Brain structure and obesity. Hum Brain Mapp 31: 353–364. [DOI] [PMC free article] [PubMed] [Google Scholar]
- Resnick SM, Goldszal AF, Davatzikos C, Golski S, Kraut MA, Metter EJ, Bryan RN, Zonderman AB ( 2000): One‐year age changes in MRI brain volumes in older adults. Cereb Cortex 10: 464–472. [DOI] [PubMed] [Google Scholar]
- Resnick SM, Pham DL, Kraut MA, Zonderman AB, Davatzikos C ( 2003): Longitudinal magnetic resonance imaging studies of older adults: A shrinking brain. J Neurosci 23: 3295–3301. [DOI] [PMC free article] [PubMed] [Google Scholar]
- Román GC ( 2003): Vascular dementia: Distinguishing characteristics, treatment, and prevention. J Am Geriatr Soc 51: S296–S304. [DOI] [PubMed] [Google Scholar]
- Rosengren A, Skoog I, Gustafson D, Wilhelmsen L ( 2005): Body mass index, other cardiovascular risk factors, and hospitalization for dementia. Arch Intern Med 165: 321–326. [DOI] [PubMed] [Google Scholar]
- Scahill RI, Frost C, Jenkins R, Whitwell JL, Rossor MN, Fox NC ( 2003): A longitudinal study of brain volume changes in normal aging using serial registered magnetic resonance imaging. Arch Neurol 60: 989–994. [DOI] [PubMed] [Google Scholar]
- Scarmeas N, Stern Y ( 2004): Cognitive reserve: Implications for diagnosis and prevention of Alzheimer's disease. Curr Neurol Neurosci Rep 4: 374–380. [DOI] [PMC free article] [PubMed] [Google Scholar]
- Schimek MG ( 2000): Smoothing and regression: Approaches, computations and application. New York: Wiley. [Google Scholar]
- Shen D, Davatzikos C ( 2002): HAMMER: Hierarchical attribute matching mechanism for elastic registration. IEEE Trans Med Imaging 21: 1421–1439. [DOI] [PubMed] [Google Scholar]
- Shock NW, Greulich RC, Andres R, Arenberg D, Costa PT, Lakatta EG, Tobin JD ( 1984): Normal Human Aging: The Baltimore Longitudinal Study of Aging. Washington, DC: US Government Printing Office. [Google Scholar]
- Singer JD, Willet JB. (2003): Applied Longitudinal Data Analysis: Modeling Change and Event Occurrence. New York: Oxford University Press. [Google Scholar]
- Taki Y, Kinomura S, Sato K, Inoue K, Goto R, Okada K, Uchida S, Kawashima R, Fukuda H ( 2008): Relationship between body mass index and gray matter volume in 1,428 healthy individuals. Obesity 16: 119–124. [DOI] [PubMed] [Google Scholar]
- Wahrenberg H, Hertel K, Leijonhufvud BM, Persson LG, Toft E, Arner P ( 2005): Use of waist circumference to predict insulin resistance: Retrospective study. BMJ 330: 1363–1364. [DOI] [PMC free article] [PubMed] [Google Scholar]
- Walther K, Birdsill AC, Glisky EL, Ryan L ( 2010): Structural brain differences and cognitive functioning related to body mass index in older females. Hum Brain Mapp 31: 1052–1064. [DOI] [PMC free article] [PubMed] [Google Scholar]
- Wang Y, Beydoun MA ( 2007): The obesity epidemic in the United States—Gender, age, socioeconomic, racial/ethnic, and geographic characteristics: A systematic review and meta‐regression analysis. Epidemiol Rev 29: 6–28. [DOI] [PubMed] [Google Scholar]
- Ward MA, Carlsson CM, Trivedi MA, Sager MA, Johnson SC ( 2005): The effect of body mass index on global brain volume in middle‐aged adults: A cross sectional study. BMC Neurol 5: 23. [DOI] [PMC free article] [PubMed] [Google Scholar]
- Whalley LJ, Deary IJ, Appleton CL, Starr JM ( 2004): Cognitive reserve and the neurobiology of cognitive aging. Ageing Res Rev 3: 369–382. [DOI] [PubMed] [Google Scholar]
- Whitmer RA ( 2007): The epidemiology of adiposity and dementia. Curr Alzheimer 4: 117–22. [DOI] [PubMed] [Google Scholar]
- Whitmer RA, Gunderson EP, Barrett‐Connor E, Quesenberry CP Jr, Yaffe K ( 2005): Obesity in middle age and future risk of dementia: A 27 year longitudinal population based study. BMJ 330: 1360–1364. [DOI] [PMC free article] [PubMed] [Google Scholar]
- Zhang Q, Wang Y ( 2004): Trends in the association between obesity and socioeconomic status in U.S. adults: 1971 to 2000. Obes Res 12: 1622–1632. [DOI] [PubMed] [Google Scholar]
- Zonderman AB, Giambra LM, Arenberg D, Resnick SM, Costa PT Jr, Kawas CH ( 1995): Changes in immediate visual memory predict cognitive impairment. Arch Clin Neuropsychol 10: 111–123. [PubMed] [Google Scholar]