Abstract
The most effective way to move from target identification to the clinic is to identify already approved drugs with the potential for activating or inhibiting unintended targets (repurposing or repositioning). This is usually achieved by high throughput chemical screening, transcriptome matching or simple in silico ligand docking. We now describe a novel rapid computational proteo-chemometric method called “Train, Match, Fit, Streamline” (TMFS) to map new drug-target interaction space and predict new uses. The TMFS method combines shape, topology and chemical signatures, including docking score and functional contact points of the ligand, to predict potential drug-target interactions with remarkable accuracy. Using the TMFS method, we performed extensive molecular fit computations on 3,671 FDA approved drugs across 2,335 human protein crystal structures. The TMFS method predicts drug-target associations with 91% accuracy for the majority of drugs. Over 58% of the known best ligands for each target were correctly predicted as top ranked, followed by 66%, 76%, 84% and 91% for agents ranked in the top 10, 20, 30 and 40, respectively, out of all 3,671 drugs. Drugs ranked in the top 1–40, that have not been experimentally validated for a particular target now become candidates for repositioning. Furthermore, we used the TMFS method to discover that mebendazole, an anti-parasitic with recently discovered and unexpected anti-cancer properties, has the structural potential to inhibit VEGFR2. We confirmed experimentally that mebendazole inhibits VEGFR2 kinase activity as well as angiogenesis at doses comparable with its known effects on hookworm. TMFS also predicted, and was confirmed with surface plasmon resonance, that dimethyl celecoxib and the anti-inflammatory agent celecoxib can bind cadherin-11, an adhesion molecule important in rheumatoid arthritis and poor prognosis malignancies for which no targeted therapies exist. We anticipate that expanding our TMFS method to the >27,000 clinically active agents available worldwide across all targets will be most useful in the repositioning of existing drugs for new therapeutic targets.
Introduction
Traditional methods of drug discovery face formidable scientific and regulatory obstacles resulting in the passage of many years and many failures from the discovery of a target to the clinical application of a novel patentable drug designed to inhibit or activate its function. Not surprisingly, there has been a marked decline in the willingness of the pharmaceutical industry to invest in drug discovery programs (1–8). With the emergence of systems biology approaches many more new drug targets have been identified and validated. However, drug development for these new targets is time consuming and prohibitively expensive leading to the concept of drug repositioning in which existing approved compounds are repurposed for another target/disease. There are clear advantages to this approach including a dramatic reduction in time, expense and safety concerns (8).
A number of existing approved drugs can be effective therapy for diseases other than those for which they were approved (8–10). Recently, the National Institutes of Health (NIH) has emphasized the importance of drug repositioning and deposited more than 27,000 active pharmaceutical ingredients in its Chemical Genomics Center (NCGC) database to encourage public screening (3,4). To date, screening is usually achieved by high throughput chemical screening or transcriptome matching. Other methods include phenotypic screening, protein-protein interaction assays, drug annotation technologies, high-throughput screening using cell-based disease models, gene activity mapping, ligand-based cheminformatics approaches, and in vivo animal models of diseases (11,12). However, experimentally testing all approved drugs against all targets is extremely expensive as well as technically unrealizable. An additional challenge of these screening studies is that after one gets a “hit,” the rational mechanism of action must still be deduced and tested. To address this, computational approaches based on drug regulated gene expression, side effect profile, and protein or chemical similarity, have been developed (13–29). Using high performance computing, high-throughput computational drug-target docking and screening are now also feasible, but current methods are only able to predict a rough estimation of the free energy of binding and further suffer from high false positive and low accuracy rates of drug-target association prediction (27–34).
Given the aforementioned challenges, we directed our efforts in this study to better predict “molecule of best fit” and have developed a comprehensive prediction method called “Train-Match-Fit-Streamline” (TMFS) that reduces false positive predictions and enriches for the highest confidence drug-target interactions. Previous studies screened FDA drugs using either chemical similarity or docking with stringent scoring criteria (18,19). In contrast, our TMFS method combines eleven different descriptors, which include shape, and topology signatures, physico-chemical functional descriptors, contact points of the ligand and the target protein, chemical similarity and docking score. In the TMFS method, descriptors are trained with template knowledge, match and fit of the signatures are identified, and the data is streamlined. Using this method, we report in-silico screening of 3,671 FDA approved and investigational drugs across 2,335 protein structures. Our directed efforts led to the identification of known drug-target interactions with remarkable accuracy as well as experimental confirmation of new activities for two well-known drugs.
Materials & Methods
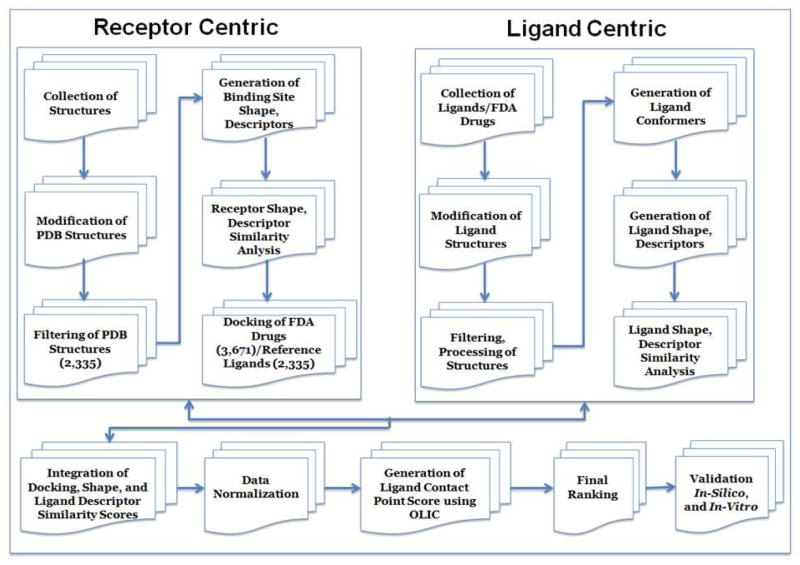
The TMFS method is outlined in Figure 1, and the following sections detail the steps within each module
Figure 1.
Graphical summary of the TMFS method work flow.
Protein Target Collection, Processing and Preparation
Protein collection
We performed an extensive search of the PDB database (www.rcsb.org) with the following parameter filters to obtain Human PDB holo structures: a) source organism: homo sapiens, b) macromolecule type: only contains protein/enzyme, c) has ligands: yes, d) experimental method: X-ray w/experimental data, e) do not include proteins that have sequence similarity >90%. This filtered query resulted in 11,100 structures, which were subsequently downloaded.
Protein processing
The PDB structures were filtered to eliminate structures that contained only metals or other ions noted without ligands. The retained set was further filtered by, removing structures containing “modified residues” as ligands using a PERL script. Using another PERL script, we cleaned the remaining protein PDB files so that they contained only the correct chains- those that are biologically relevant, interact with ligand and contain all necessary cofactors. Next, the script was formatted as a list that contained the RCSB two- and three-letter codes corresponding to the cofactors and metals. These records were then searched against HETATM lines for matches. All matches were retained along with the corresponding CHAIN records, and non-matching HETATM lines were deleted. The resulting modified PDB entries were devoid of all solvent molecules, salts, and non-cofactor ligands. A total of 2,335 modified PDB structures were subjected to virtual protein preparation. Modified PDB structures were converted into the Schrodinger software’s native MAE format for protein preparation. The “protein prep” command line utility was used in a C-shell script to automate the process of adding explicit hydrogen atoms and fixing the correct protonated states and disulfide bonds.
Ligand Collection, Processing and Preparation
Crystal structures of reference ligands and FDA-approved and experimental drug set collection
For the set of protein structures obtained prior to the protein preparation procedure, we gathered their corresponding ligand crystal structures from the PDB database. These ligands served as template coordinates for receptor grid generation, a docking control, as well as references for the ligand-centric rescoring. To achieve this, we used a C-shell script that prepared a list of PDB IDs with their corresponding ligand three-letter codes and substituted the paired strings into a template hyperlink using the cURL command to retrieve the appropriate SDF files. This automation allowed for the retrieval of individual ligands that retained their bioactive conformations and coordinates with respect to each chain of their corresponding proteins. FDA-approved and experimental drug structures were obtained from the Drug Bank (www.drugbank.ca), FDA (www.FDA.gov) and BindingDB (www.bindingdb.org).
Reference ligand processing
The SDF files downloaded from the PDB database contained one or more instances of the ligand depending on whether or not the corresponding proteins were crystallized as multimeric structures. Since the PDB structures were processed such that only the biologically relevant chain is retained, we processed the SDF files so that each one contained only a single instance of the ligand that corresponds to the biologically active PDB chain. Using a PERL script we extracted chain identifiers from the PDB files and used them to match the ligand chain IDs. The resulting SDF files were then subjected to ligand preparation procedures using Schrodinger’s LigPrep application.
Ligand Preparation
Reference ligands
Since the reference ligand crystal structures were downloaded as three-dimensional structures in their bioactive conformations from the PDB database, we used the “applyhtreatment” command via a C-Shell script. This command allowed us to retain these conformations while adding hydrogen atoms and neutralizing the ligands for use in docking control, shape calculations, as well as the generation of ligand-based descriptors using Schrodinger’s QikProp application.
FDA-approved/investigational drugs
We first acquired these molecules in their two-dimensional SDF format. For conversion to three-dimensional energy-minimized structures and neutralization, a “ligprep” command was automated using a C-Shell script. This set of neutralized molecules was also subjected to QikProp descriptor generation. After neutralization, the neutralized structures were ionized at a pH of 7.0 using the “ionizer” utility to generate ionized states that retained the minimized conformations at physiological pH. These ionized structures were later used for shape calculations and docking.
Generation of ligand descriptors
Ligand descriptors for the ligand-centric descriptor similarity approach were calculated using Schrodinger’s QikProp application. The following descriptors were computed for the reference ligands and FDA-approved drugs: (1) number of hydrogen-bond acceptors, (2) dipole moment, (3) number of hydrogen-bond donors, (4) electron affinity, (5) globularity, (6) molecular weight, (7) predicted log of the octanol/water partition coefficient (ClogP), (8) number of rotatable bonds (9) solvent-accessible surface area (SASA), and (10) volume.
Shape Quantification: Ligand, and Protein Binding Pockets
Shape descriptors for the ligand and protein binding pockets were generated using a Java software package provided by the Thornton group (35). The spherical harmonics expansion approach was used to describe the shape of ligands as well as binding sites using protomol information of those sites obtained from the sc-PDB database (36). For PDB files missing in sc-PDB, we computed the protomols using SurFlex Protomol generator within SYBYL X.1 (Tripos International, St. Louis, MO USA). Binding site protomols were stripped of all atoms except hydrogen and carbon so that the final pocket shape is as refined as possible. The methodological application of the expansion with real spherical harmonic functions to approximate the surface function was stimulated by the work by Kharaman et al. (35). Equation 1 shows the function for the spherical harmonics shape calculations.
| (1) |
Grid Generation and Docking
Generation of receptor grids for docking
Grids were generated using Schrodinger’s Glide module. Grid center points were determined from the centroid of each protein’s cognate ligand. To obtain the centroid, we extracted the Cartesian coordinates for each atom in the ligand and took the average for each dimension. To determine the size of the grids, we took a trial-and-error approach to determine the smallest grid size that would allow for the re-docking of all reference ligands. We chose the largest reference ligand as our upper size limit, and found that a grid size of 20Å on each side was the minimum to allow for it to dock. Thus, the grid size for docking simulations was set at 20Å.
Creation of an FDA-approved/investigational drugs data set for docking
Since the FDA drugs prepared using LigPrep were energetically minimized, their final 3D shapes may deviate significantly from those of the reference ligands and their native binding pockets. In order to predict more accurate poses, we sought to create unique conformer sets of FDA drugs with respect to each protein. To do so, we first performed an “exhaustive” conformational search using Schrodinger’s ConfGen module for each drug to obtain a library of more than 100,000 conformers. The shape of each conformer, along with the active conformation of the reference ligands, was then calculated using the spherical harmonics expansion approach (35). Subsequently, shape similarities were quantified using the Euclidean distance metric between each reference ligand and all the drug conformers (equation 2). The drug data set for docking was assembled by choosing the conformer for each drug whose shape had the smallest Euclidean distance to the shape of the reference cognate ligand for a given protein. Thus, each protein had a unique drug data set whose conformers more closely resembled the shape of that protein’s reference ligand.
Positive docking control-choosing a scoring function
Because a large number of protein-ligand complexes needed to be scored and our computational resources being limited, we sought a scoring function in Glide that would give reasonable docking results most efficiently. To determine this, we re-docked all the reference ligands, with their crystal structure conformations conserved, to their native targets to confirm that we were able to reproduce their bioactive conformations. We chose the XP scoring function with a 10-pose post-minimization procedure to determine the final pose.
We determined reproducibility of the bioactive conformations using visual inspection. That is, we superimposed the PDB crystal structure reference containing the crystallized ligand to the docking output conformation. Upon superimposing, we visually inspected the positions of the crystallized ligand compared to the docking output ligand to note any deviations. From thorough inspection of 100 protein-ligand complexes, we found ~70% of them to have reproduced the bioactive conformations. With this outcome, we decided to proceed with the XP scoring function. Each unique FDA drug was docked to its respective protein using the aforementioned parameter options.
Analysis
Shape similarities
To quantify shape similarity, we employed the Euclidean distance metric (35). Euclidean distances allowed for a fine-resolution comparison of ligand and pocket shapes through comparison of their spherical harmonics expansion coefficients, as well as the shape of multiple conformers for a single molecule. Equation 2 depicts the Euclidean distance function.
| (2) |
The smaller the Euclidean distance between two coefficients (vectors a and b having n=(lmax + 1)2), the more similar they are with regards to shape. As a general rule, shapes are identical if the Euclidean distance is less than 3, similar if it is less than 5, and increasingly dissimilar if it is greater than 6 (35). The ligand-to-ligand and ligand-to-pocket (protein binding site) Euclidean distance scores were normalized and implemented into the final ranking equation. Euclidean distances were also calculated for protein pocket-to-pocket shape comparisons, which were used for a binding site similarity analysis outside of the “ligand of good fit” question.
Ligand-based descriptor similarities
Since our approach in determining the “ligand of good fit” depends partially on the co-crystallized ligand, we sought to perform analyses of similarities of the query molecules to the reference ligands using the ligand-based descriptors described earlier. The QikProp module in Schrodinger provides quantification of ligand-based descriptors, such as molecule globularity, which further allows for statistical similarity analysis. To do so, we used the Strike module in Schrodinger to calculate Tanimoto and Manhattan similarity scores for each probe molecule’s descriptor value against all of the reference ligands. A Tanimoto score of 1.0 or a Manhattan score of 0.0 for a particular descriptor signifies that a given probe molecule is practically identical to the reference ligand based on that descriptor property. The discrepancy in the usage of Tanimoto or Manhattan scores is due to whether or not the variable at hand is continuous or discrete, respectively. These similarity scores were later normalized and substituted for the final ranking procedure in equation 8.
Data normalization
Next, we normalized the docking scores, shape similarity, Euclidean distance scores, and ligand-based descriptor similarity scores to create a common scoring scheme whose values ranged from 0 to 1, with 1 being either the most favorable docked conformation or greatest similarity based on the shape and ligand-based descriptors. Equations 3 and 4 depict the schema of normalization.
| (3) |
| (4) |
Equation 3 was used for data whose best score was the maximum score (i.e. Tanimoto scores for ligand-based descriptors) while equation 4 was used for data whose best score was the minimum score (i.e. docking scores where the most negative score is the best). The final normalized scores were substituted in equation 8.
Ligand interaction correction score
To get a better estimate of ligand-protein interactions on the reference binding site, we introduced another correction term called “optimal ligand interaction correction” (OLIC). This correction assumes that ligands will have similar experimental activity if their interaction involves similar binding site residues and makes similar interaction patterns to the reference ligand. The nature of the interactions and their interacting residue motifs are then input to the OLIC algorithm, which calculated a score for each reference and test set ligand contact point using equations 5 & 6. The final contact point score was calculated using equation 7. To be consistent with the other scores calculated above, the corrected score was normalized in the range of 0 to 1 using sequations 3 and 4. If the corrected score is “0”, then the test set ligand has a similar interaction pattern and similar activity, and is therefore considered as the molecule of best fit when compared to the reference ligand. If the corrected score is “1”, then the test set ligand is considered as a non-binder.
| (5) |
| (6) |
| (7) |
With respect to equations 5, 6 and 7, “S (OLIC-R)” represents the score for reference ligand, and “S (OLIC-T)” represents the score for test set ligands; “CS (OLIC)” is the corrected score, where “n” is the total number of contact points has extend from 1 to ∞, “σ” represents contact point, “σij “ is the contact points of ith ligand with jth protein, and “σji” is the contact points of jth protein with ith ligand.
Prediction of molecule of best-fit
Molecules of best fit were calculated by the TMFS method comprehensive score “Z” given by the following equation,
| (8) |
The “Y ” term represents the normalized docking score of a ligand (σl) to a particular protein (σp, along with its designated weight (ωk). The first summation term, where l = 1, represents the combination of normalized Euclidean distance scores for protein pocket-ligand (f (σp, σl))and reference ligand (σc) − ligand (f (σc, σl)) comparisons with designated weights (ωi) and (ωi1), respectively. The second summation term, where j = 8, represents the combination of ligand-based descriptor terms (8 total) and their respective values. Normalized Tanimoto or Manhattan scores for each descriptor are represented by Xn, where the value of n corresponds to a particular descriptor such as solvent-accessible surface area (SASA) or number of rotatable bonds (Rotor). Note that the identities of σp, σc and σl (protein, reference ligand crystal structure for that protein and probe molecule, respectively), are constant across all terms of the equation.
The values for weights ωk, ωi, and ωi1 are 4, 2 and 2, respectively. The final ranking of protein target-ligand complexes is comprised of 11 total descriptors, 8 of which are solely ligand-based. In order to reduce this bias, we provided weights to the protein-oriented descriptors (i.e. docking score and protein shape), as well as to the ligand shape score since we believe that the shape parameters are more accurate approximations of the true protein-ligand interactions. The weights of 4, 2 and 2 for docking, protein shape and ligand shape scores, respectively, provided the final ranking equation with a good balance among the descriptors that led to the accurate predictions noted in Figure 2b.
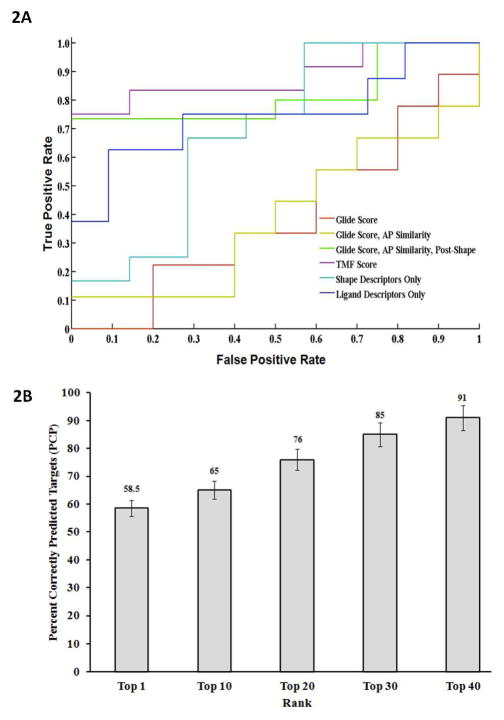
Figure 2. (A). Accuracy of the TMFS method represented by ROC curves.
We examined the TMFS method accuracy against the Glide docking scoring function. Here we report, in increasing order of enrichment of true bioactive compounds, the performance of each scoring method via their respective AUC: Glide score (0.3889; red), Glide score + atom pair (AP) similarity (0.3889; yellow), shape descriptors only (0.6905; teal), ligand-centric descriptors only (0.7500; blue), Glide score + AP similarity + Post-Shape (0.8167; green), and TMFS score (0.8810; purple). (B). Validation of predicted drug-target associations for FDA approved drugs. Predicted drug-target associations for each FDA drug in the Top 1 through Top 40 ranked hits were individually matched against the publically available experimental binding and functional data. Percent Correctly Predicted (PCP) targets were then calculated using equation 9 for each category of the top rank lists (i.e. Top 1 to Top 40). The histogram (filled bars) represents the Percent Correctly Predicted (PCP) targets (y-axis) for each category of top rank lists. Error bars as well as percentages are highlighted on each histogram bar.
The last term represents the “CS (OLIC)” correction term for protein-ligand interaction points calculated using equation 7. The sum of all these terms provides a comprehensive TMFS Z-score for a single ligand with respect to a protein that takes into account receptor-centric features (docking score), ligand-centric nonstructural descriptors (QikProp descriptors from Schrodinger) and shape-based features (protein pocket-ligand and ligand-ligand).
Validation of TMFS method
As will be explained in the Results and Discussion section, a proper validation of the TMFS predictions across our large protein target data set (2,335 targets) using the currently available literature poses many challenges. In order to account for these challenges, we devised the following equation to calculate the percent correctly predicted (PCP) targets:
| (9) |
where “n” represents total number of targets; “A, B, Y, B, X, Y, Z and E” represent targets; “Aji” is the number of predicted targets “j” for drug “i”; “ Bji” is the number of experimentally validated targets “j” for drug “i”; “ Xji” is the number of correctly predicted targets “j” from this experiment results for drug “i”; “ Yji” is the number of targets not validated experimentally within the predicted lists for drug “i”; “ Zji” is the number of experimentally validated targets “j” for drug “i” which are not included in the target data set; and “ Eji” number of experimentally validated targets “j” for drug “i” that were not target hits but are included in the target data set.
Cadherin-11 surface plasmon resonance (SPR) assay
Surface plasmon resonance experiments were carried out with a Biacore T100 equipped with a CM5 sensor chip. Briefly, mouse extracellular domain 1–2 (EC 1–2) C-terminally cysteine-tagged cadherin-11 recombinant protein (36) was immobilized on flow cell (FC) 2 in HEPES Buffered Saline (10 mM Hepes, pH 7.4; and 150 mM NaCl, 3mM CaCl2) using a thiol-coupling kit according to the manufacturer’s protocol, resulting in immobilization levels of 4580 response units (RU). FC1 was only activated and inactivated and used as a reference. Celecoxib and dimethyl celecoxib stock solution was diluted to a final concentration of 200, 100, 50, 25, 12 uM and injected in 10mM Hepes, 150mM NaCl, 3mM CaCl2, 1% DMSO and 0.5% P20. Each injection was repeated three times for 60 seconds. FC1 signals were deducted from FC2 for background noise elimination.
Growth inhibition of MDA-MB-231 invasive breast cancer cell line using MTS assay
MDA-MB-231 cells were seeded at 4000 cells/well in a 96 well plate. Stock of celecoxib and dimethyl celecoxib were diluted in DMEM+10% FBS to make final concentrations used for treatment, and all concentrations were prepared to have the same amount of DMSO. Three wells per concentration were treated 24 h post seeding, and the MTS assay was performed 48 h post treatment. The CellTiter96 Aqueous Non-Radioactive Cell Proliferation Assay kit (Promega) was used according to the manufacturer’s recommendations. The absorbance values were measured at 490 nm and viable cells presented as a percentage of the absorbance of DMSO-only treated cells. IC50 and R2 values were calculated with the Graphpad Prism software.
VEGFR2 kinase assay
The VEGFR2 kinase assay was performed by using the Caliper LabChip 3000 and a 12-sipper LabChip. LabChip assays are separations-based, wherein the product and substrate are electrophoretically separated, thereby minimizing interference and yielding high data quality. Z′ factors for both the EZ Reader and LC3000 enzymatic assays are routinely between 0.8 and 0.9. The off-chip incubation mobility-shift kinase assay uses a microfluidic chip to measure the conversion of a fluorescent peptide substrate to a phosphorylated product. The reaction mixture, from a microtiter well plate, is introduced through a capillary sipper onto the chip, where the nonphosphorylated substrate and phosphorylated product are separated by electrophoresis and detected via laser-induced fluorescence. The signature of the fluorescence signal over time reveals the extent of the reaction. The precision of microfluidics allows for the detection of subtle interactions between drug candidates and therapeutic targets.
The assay reaction is Fluorescein-peptide + ATP → fluorescein-phosphopeptide + ADP, which is measured by charge separation of phosphorylated product and unphosphorylated substrate. The assay incubation is carried out in 100mM HEPES (pH 7.5), 10mM MgCl2, 1mM DTT, 0.05% CHAPSO, 1.5 μM peptide substrate, 450 μM ATP, nine different concentrations of Mebendazole, and Staurosporine used as the positive control. Following addition of ATP, samples were incubated for 60 minutes at room temperature and the reaction was terminated by the addition of stop buffer containing 100mM HEPES (pH 7.5), 7 mM EDTA, 0.015% Brij-35, 4% DMSO. Phosphorylated product and unphosphorylated substrate were separated by charge using electrophoretic mobility shift. The product formed is compared to control wells to determine inhibition or enhancement of enzyme activity.
Angiogenesis assay
Mebendazole was dissolved in 50 μl of DMSO and diluted with endothelial growth medium (EGM) to a final concentration of 1 mM. The highest concentration of DMSO is 0.1%. Human umbilical vein endothelial cells (HUVEC) were purchased from Cambrex Co. (East Rutherford, NJ, USA) and maintained in endothelial growth medium (EGM) supplemented with 2% FBS, 0.1% EGF, 0.1% hydrocortisone, 0.1% GA-1000, and 0.4% BBE. Morphogenesis assay on Matrigel was performed according to the manufacturer’s instructions (Chemicon International). The ECMatrixTM kit consists of laminin, collagen type IV, heparan sulfate, proteoglycans, entactin, and nidogen. It also contains various growth factors (TGF-beta, FGF) and proteolytic enzymes (plasminogen, tPA, and MMPs) that are normally produced in EHS tumors. The incubation condition was optimized for maximal tube-formation as follows: 50 μl of ECMatrixTM was suitably diluted in a 9:1 ratio with 10X diluent buffer and used to coat the 96-well plate. The coated plates were incubated at 37 °C for 1hr to allow the Matrix solution to solidify. HUVECs were cultured for 24 h in EGM with 2% FBS, trypsinized and re-suspended in the growth medium. After 1 h pre-incubation of the plate with Matrix solution, the HUVECs were plated at 5 × 10⁵ cells/well in the absence or in the presence of Mebendazole (1–100 μM). After 24 h of incubation at 37 °C, the three-dimensional organization (cellular network structures) was examined under an inverted photomicroscope. Each treatment was performed in triplicate.
Results & Discussion
We have developed a new proteo-chemometric method called “TMFS” that utilizes a comprehensive receptor- and ligand-centric approach to predict molecules of “good fit”. The detailed scheme is displayed in Figure 1. Briefly, in the receptor centric approach, we collected ~11, 000 x-ray 3D structures (human–liganded proteins) from the PDB database (www.rcsb.org).
After filtering (see methods for details), we included 2,335 unique protein structures for the receptor- and ligand-centric simulations. We docked 3,671 FDA approved and clinical trial drugs as reported in DrugBank, BindingDB, and FDA.org. Given that an important factor in determining a molecule of “good fit” is the similarity of its shape to those of the bioactive conformation of the reference ligand and ligand-binding pocket, we integrated receptor and ligand shape descriptors and similarity quantification into TMFS scoring. To quantify a molecule’s shape similarity, we employed the Euclidean distance metric as described in Kharaman et al. (35). We calculated the binding pocket, ligand and drugs shape using sc-PDB (37) and SurFlexDock Protomol generator within SYBYL X.1 (38). Then we collected and integrated the docking, shape and ligand descriptor similarity score data. Independently, the ligand-protein contact point scores were calculated using our “OLIC” method. Each data set score was normalized between 0 and 1. Then, using equation 8 we computed a final ranking score, the comprehensive TMFS score “Z” that gives molecules of “good fit”.
Analysis of accuracy of the TMFS method using ROC
Next we examined the precision of the TMFS method to ascertain if it substantially enriches the number of active compounds detected at the top of the ranking list. Since our study involved 2,335 unique proteins, and 3,671 drugs, the docked output has ~8.4 million protein-ligand complexes for each docking protocol. We were interested in applying the TMFS method in conjunction with the most efficient docking algorithm to produce reliable results in the quickest time possible. To do this we obtained a database of actives and decoys for estrogen receptor alpha (ERα) from the DUD (http://dud.docking.org/), which contains ~3,000 compounds (39). Then we performed our computational prediction protocol on the crystal structure of the agonist conformation of estrogen receptor (PDB ID: 3ERD) to determine if our TMFS method significantly enriches the number of known active compounds within the top 20 positions compared to the options provided solely in the Schrodinger software.
First, we performed simple docking as our control. The Glide docking score yielded a high false positive rate (Figure 2a). We then repeated the procedure with the “atom-pair similarity” of the probe ligands. This procedure re-ranks docked compounds according to their atom-pair similarity to a template ligand, in this case the co-crystallized ligand in its active conformation. The conformers of the probe molecules in these two steps were simply the minimized structures from the LigPrep application. As shown in Figure 2a, atom-pair similarity re-ranking did not provide significant enrichment over the pure Glide docking score. Next, we wanted to determine if choosing probe molecule conformers whose shapes most closely matched to that of the reference ligand would result in greater enrichment. We prepared an exhaustive conformer library for each drug and chose the conformer whose shape most closely matched that of the active conformation of the crystallized ligand for each protein. With the new, individualized “conformer set” of FDA drugs for ERa, we repeated the Glide docking procedure with atom-pair similarity. This method significantly enriched the number of active compounds in the top 20 positions. Interestingly, when the shape parameters were considered in isolation, the enrichment was also significant. Finally, since these three procedures are receptor-centric, we added the ligand-centric approach to the last procedure to see if our combined receptor-ligand centric method would result in maximal enrichment. That is, we incorporated the ligand-based descriptor similarities to the reference ligand, as well as probe ligand-to-reference ligand and probe ligand-to-ligand pocket shape (protein binding site) similarities, to the docking score of the refined molecule database with atom-pair similarity. We applied computed values of all the receptor- and ligand-centric results unique to the TMFS method to solve the comprehensive ranking score “Z” (equation 8). The resulting top 20 rankings from each of these four procedures were plotted on a receiver operator curve (ROC). From the ROC (Figure 2a), we were able to determine the effect of our prediction method on the enrichment of true-positives over false-positives. In comparison to all the individual descriptor approaches (i.e. ligand-centric or shape descriptors only), this combined approach showed the greatest enrichment of active compounds versus decoys and served to validate our TMFS method.
While we understand that ROC enrichment performance analysis was performed on a single instance of the DUD, the purpose of using this well-established target (ERα) was for a proof-of-concept for our TMFS approach. As will be explained in the subsequent section, the application of TMFS to the 2,335 human protein crystal structures is to validat our method across the largest and most diverse data set we could obtain. In fact, our protein target set included 21 out of the 40 total DUD targets to date with respect to protein nomenclature. Furthermore, as depicted in Supplemental Table 1, our protein target set also includes many different instances of those DUD targets. For example, PPARgamma is represented in our protein target set through five unique PDB crystal structures: 1KNU, 1NYX, 3CS8, 3FUR and 3K8S. Although ROC enrichment performance analyses were not conducted for these other DUD targets, they are included in the large validation, which contributed to the final accuracy score (see next section). We therefore found the incorporation of these DUD targets in this fashion to be of greater value for our validation than a smaller number of individual ROC comparisons.
Validation of the TMFS Method Using Publically Available Literature
To validate predicted drug-target signatures, we used manual, structural and automated text curation to exhaustively search DrugBank, BindingDB, ChemBL, PubChem, PDSP, and other published literature where experimental binding/functional data are available for FDA drugs. Since our drug data sets are associated with the DrugBank ID, we downloaded the most recently updated “drugcard” from DrugBank, which included information for each drug with respect to their targets and PDB IDs if available. This file was parsed into individual “drugcards” that correspond to each individual compound in the database. We subsequently took DrugBank ID/PDB ID combinations for each FDA molecule found in the top 1 through top 40 lists for each target and searched for matches across every individual “drugcard”. We recorded a successful prediction for every match occurrence and annotated the data to the corresponding drug in the top 1, top 10, top 20, top 30 and top 40 ranked lists. Then we used “significance analysis” (equation 9) to obtain the percent correctly predicted (PCP) drug-target signatures. A similar procedure was used to curate and validate other experimental bioassay databases (see following section).
One caveat of our approach is that this validation method only contains a subset of the overall potential successful predictions. This is because; many of the predicted hits have not been tested experimentally; some of the hits listed in the databases are not included in our target datasets, and although a protein target may have many crystal structures deposited in the PDB, experimental data sources report only a single PDB ID for a target associated with a drug. To our knowledge, there is no reconciliatory method in the PDB to match PDB IDs to a single protein name since each PDB file contains a different variation of the target name. In other words, we were unable to aggregate all the PDB IDs for a single protein target. Although it may be possible to perform a “fuzzy” text search, this process would decrease accuracy and is beyond the scope of our work. In addition our FDA-approved drug database is only a subset (54%) of the entire DrugBank database, which results in a skewed representation of this validation process. Similarly, we do not have all of the PDB IDs that are found in the entire DrugBank database. This is because our final protein target database was contingent upon our compiled target data set of 2,335. Furthermore, we have not included universal target binding component proteins such as the multi-drug resistant (MDR) protein cytochrome p450. These caveats pose an interesting challenge in performing an optimal validation check. To address these concerns in the validation, we have developed a statistical procedure specifically for this kind of validation task-equation 9 calculates the percent correctly predicted (PCP) targets.
We repeated the structural and automated text curation to exhaustively search DrugBank, BindingDB, ChemBL, PubChem, PDSP, and other published literatures. Figure 2b depicts the percentage of targets correctly predicted by the TMFS method across all the databases. To obtain this percentage, we counted the number of matched and unmatched pairs, and also determined the excluded/included missing targets in terms of their protein target name, drug name or structure, or PDB code. Then we substituted this number in equation 9. This number was used as the total possible validations for each drug. Upon analysis of the results and validation generated using equation 9, we reliably reproduced many experimentally validated drug-target associations (Figure 2b). We achieved >91% correct predictions for the majority of drugs. A classical example of some of the literature-validated (>95% target hits) include staurosporine, Genistein, Paricalcitol, Ethoxzolamide, Alitretinoin, and Drospirenone. 58.5% of the first ranked drug for each target are correctly predicted followed by 65%, 77%, 85% and 91% for the top 10, 20, 30 and 40, respectively (Figure 2b). Prediction of a first-ranked drug is more sensitive to descriptor prediction value error such that a slight variation in the descriptor error will affect the correct prediction. For reference, we have included the data for all top-ranked staurosporine-protein target interactions in Supplemental Table 2. In contrast, ranking within the top 40 is the least sensitive, and this error is more or less balanced. This is quite remarkable considering the completely in silico nature of the screening and the experimental vagaries for many of the interactions.
Performance of the TMFS method
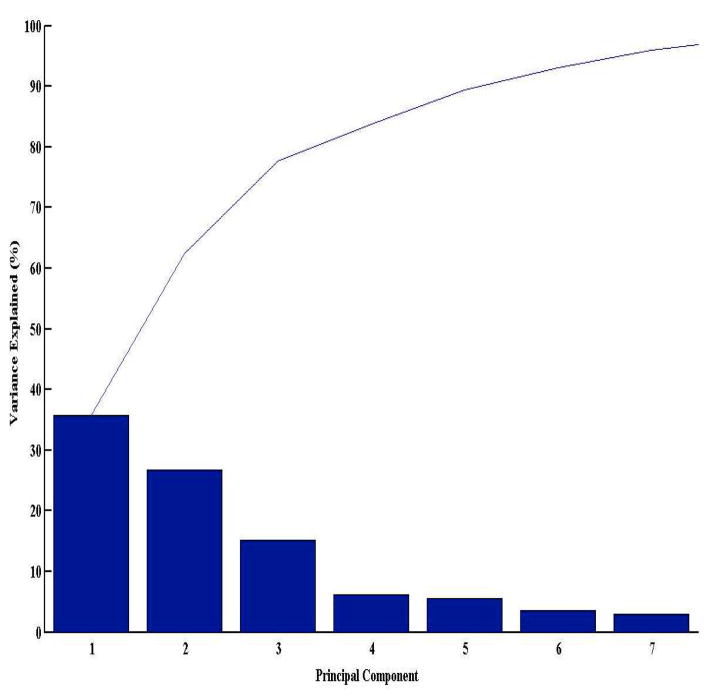
To determine how well the receptor- and ligand-centric component descriptors (11 in total) correlate in obtaining a reliable prediction of hits for a given protein target, we performed a principle component analysis (PCA). The data set for PCA comprised of the normalized descriptor values for the top 40 hits with respect to their predicted targets (n=2,335). To reduce the dimensionality of the data, we first performed a “scree plot” to determine how many principle components explain most of the variance in the data. We found that the first three principle components account for approximately 76% of the data variance (Figure 3). Thus, we plotted the transformed eigenvalue coefficients of the above descriptors against the first three principle components (Supplemental Figure 1). All descriptors, with the exception of docking score and hydrogen bond donor (DonorHB), exhibit a positive correlation across all three components. This implies that most of the ligand-centric descriptors and ligand/protein-centric shape descriptors correlate well with each other in determining a “molecule of good fit” for a given target. Furthermore, the docking score descriptor deviates from the rest of the descriptors. In other words, the protein-ligand complex that has the lowest-energy pose is not necessarily (or even likely to be) the one with the best fit. The docking score is a raw energetic term that takes into account the energetics of interactions between a ligand and protein where important parameters such as solvent, entropy and enthalpy are absent. In contrast, the TMFS method includes protein and ligand topology descriptors in addition to energetic terms. Hence, a reliable prediction algorithm would benefit from a comprehensive approach that takes into account both receptor- and ligand-centric descriptors.
Figure 3. Principle Component Analysis (PCA) of individual protein- and ligand-based descriptor variables for determination of descriptor correlation with obtaining reliable predictions.
Scree plot depicting the first three principal components accounting for the majority of the data variance. The first three principle components account for the majority of the data variance, hence the transformed eigenvalue coefficients of the above descriptor variables were plotted against the first three principle components in Supplemental Figure 1.
Analysis of Drug-Target Associations
Drug frequency propensity
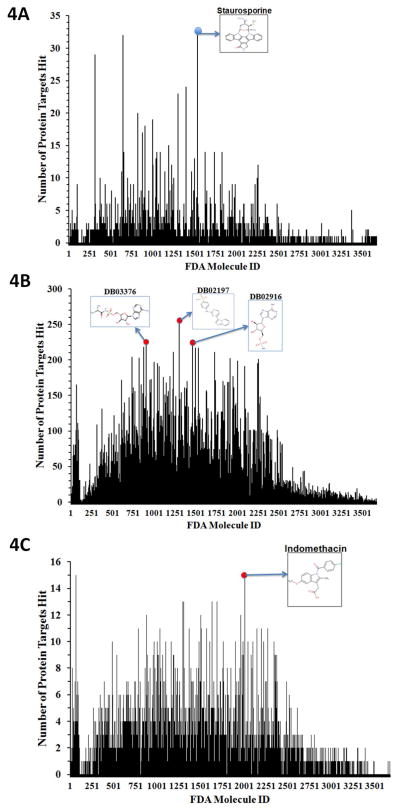
Next we analyzed predicted drug-target associations (Figure 4 and Table 1) in terms of drug frequency propensity for each target (i.e. drugs that interact with multiple targets with potentially good or bad effects). If a side effect is desirable, the drug might be repurposed for an additional indication. Targets are considered as hits if the TMFS rank places it in the top 1 (Figure 4a) to top 40 (Figure 4b). The broad-spectrum kinase inhibitor staurosporine was predicted to hit the most protein targets in the top 1 position. This finding is consistent with previous reports that staurosporine is a prototypical ATP-competitive multi-kinase inhibitor, and 8% of our PDB data set is comprised of kinase-like structures (40). Some clinical drugs with IDs denoted by DrugBank as DB02197, DB02916, and DB03376 are also predicted to hit many targets in the top 40 (Figure 4b). These structures are also ATP-like, which is not surprising as the ATP-/GTP-like small molecules bind naturally to many proteins. In addition, the PDB database is biased toward kinases where many of those kinase structures are co-crystallized with ATP, GTP or closely related analogues. In an effort to further enrich our prediction paradigm, we included an RMSD term for ligand shape, where the RMSD of the docked ligand is compared to the active conformation of the co-crystallized ligand. Since this was a computational-intensive process, we randomly chose 100 protein targets. In this case, indomethacin, a non-steroidal anti-inflammatory drug, was predicted to hit the highest number of protein targets in the top 1 and top 40 rankings (Figure 4c).
Figure 4. Analysis of FDA Drug-Target Association.
Frequency histogram depicting the number of protein target hits (y-axis) for each FDA drug (x-axis). Targets are considered hits for a particular molecule if the final ranking (Z-score) of the molecule places it in the Top 1 position, or somewhere in the Top 40 positions. (A) Frequency histogram depicting the number of protein targets hit y-aixs for each FDA drugs (x-axis) in the Top 1 position. The 2D structure of staurosporine, the drug with the most hits, is also displayed. (B) Frequency histogram depicting the number of protein target hits (y-axis) for each FDA drug (x-axis) in the Top 40 position. The Top 40 provides a more relaxed criterion for protein targets to be considered as hits. As such, for those molecules that survive the final cut-offs and are found in the Top 40 rank list for a particular protein, we predict that they have a good potential to bind to that given target. DB02197, DB03376 and DB02916, drugs with the most predicted hits, are depicted. (C) To further enrich our prediction paradigm, we included one more term corresponding to ligand shape. The value for this term is the RMSD of the docked ligand compared to the active conformation of the co-crystallized ligand for a particular protein crystal structure, which is derived from a set of 100 protein targets. The histogram portrays the frequency of hits of each FDA drug along with the 2D structure of the drug with most target hits (Indomethacin).
Table 1.
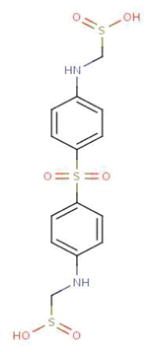
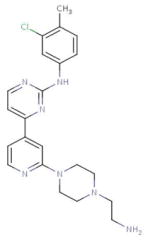
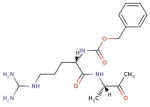
Predicted drug-target associations in terms of drug frequency propensity for each target. The top 10 occurring molecules and the PDB identification codes corresponding to them for the Top 1 cohort.
| Molecule ID | Structure | # of Occurrences | Target PDB ID(s) |
|---|---|---|---|
| DB02010 (Staurosporine) |
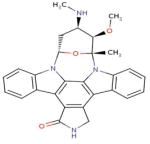
|
32 | 2HY8, 1YVJ, 3FQS, 2VWV, 1R0P, 3EQF, 2VTQ, 2VU3, 2RKU, 1AQ1, 1BYG, 1OKY, 1Q3D, 1QPD, 1SM2, 1U59, 1XBC, 1XJD, 1YHS, 2BUJ, 2DQ7, 2HW7, 2NRY, 2OIC, 2Z7R, 3A4O, 3A60, 3A62, 3BKB, 3FME, 1PKD, 3DTC |
| DB04700 (Glutathione Sulfinate) |
|
32 | 1NUT, 1HUR, 1NUE, 1XTQ, 1Z0F, 1Z6X, 1ZD9, 2AED, 2AL7, 2ERX, 2FOL, 2GF0, 2GF9, 2HT6, 2NGR, 2NZJ, 2O52, 2ODE, 2W2T, 2X2E, 2X2F, 3CH5, 3KUC, 3KUD, 1F5N, 1GUA, 1KMQ, 3GFT, 1C1Y, 1YHN, 2CLS, 1HY3 |
| DB00686 (Pentosan Polysulfate) |
|
29 | 121P, 1JAI, 2QRZ, 2P2L, 3LXX, 1I3L, 2RJ7, 2PEZ, 1R2Q, 2ATX, 2EW1, 2F9M, 2FG5, 2OCB, 2Q3F, 3KKM, 3KKN, 1N6L, 1QRA, 1UPT, 1Z0K, 2A5D, 2GZD, 2H57, 3DOE, 3MJH, 1W4R, 1JV3, 1KWS |
| DB03003 (Glutathione Sulfonic Acid) |
|
24 | 2HEH, 2QSY, 1MC5, 1AN0, 1KAO, 2DPX, 2E9S, 2F7S, 2F9L, 2J1L, 1CTQ, 1YZK, 1YZQ, 1Z08, 2RGB, 3DDC, 3K8Y, 3LBI, 3LBN, 1YZX, 1M7B, 1XTS, 2C5L, 3RAP |
| DB02197 (4-[(4-Imidazo[1,2-a] Pyridin-3-Yl pyrimidin-2-Yl) Amino] Benzenesulfon-amide) |
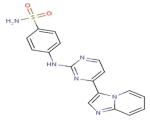
|
22 | 3E7O, 2IW9, 1YKR, 3EMG, 1Y6A, 2J51, 2W4O, 2WU6, 2C6I, 2C6K, 2C6L, 2C6M, 2W05, 2ZAZ, 1OIT, 1OIR, 1URW, 2VV9, 3CGO, 3L8X, 3H3C, 2J9M |
| DB03376 (‘5’-O-(N-(L-Alanyl)-Sulfamoyl) Adenosine) |
|
19 | 1NST, 1ZRH, 1J1C, 2OXC, 2WQE, 3EWS, 1XNJ, 3FZP, 1J1B, 1JNK, 2DWB, 2HW1, 3B7G, 2BIY, 2QK4, 3CYI, 1WMS, 1Z2C, 3B2T |
| DB03869 (5′-O-(N-(L-Seryl)-Sulfamoyl) Adenosine |

|
19 | 1K3A, 2DWP, 2C02, 2OJW, 1JKL, 1MQB, 2GJK, 2ITX, 2PVR, 2B4Y, 3K35, 3KH6, 1H1W, 2CCH, 3A8W, 3H8V, 3I9N, 1ISH, 3DZH |
| DB01145 (Sulfoxone) |
|
18 | 1MQ4, 2W5A, 2WZB, 2WZC, 3A7J, 3JXU, 3LQ3, 1O6L, 1ZXM, 2A2D, 2E8A, 2OU7, 2OZO, 2QOC, 3KEX, 3DAY, 2YXU, 2FFU |
| DB03916 (4-{2-[4-(2-Aminoethyl) Piperazin-1-Yl]Pyridin-4-Yl}-N-(3-Chloro-4-Methylphenyl) Pyrimidin-2-Amine) |
|
16 | 2HK5, 3FZR, 2HXL, 1H1S, 2HOG, 2ITP, 3LCD, 3L58, 3BMY, 2VIW, 2EI7, 3EKN, 3KQ7, 2ZM4, 1YOL, 2VIE |
| DB03536 (Benzoyl-Arginine-Alanine-Methyl Ketone) |
|
14 | 2HHA, 3L5C, 3B7R, 2OPY, 3MO5, 3D0E, 3E88, 1DMT, 3DWB, 1QZY, 3C7I, 2QG4, 2XFJ, 2WF3 |
FDA “blockbuster” drug-target associations
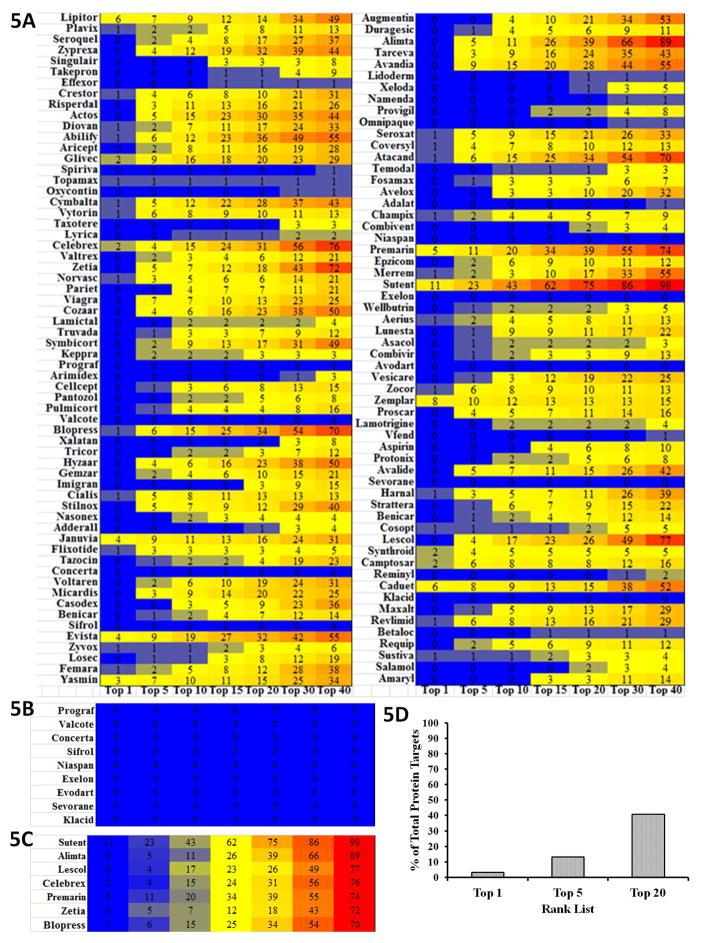
Next we predicted the top 200 “blockbuster” drug-target associations and determined their frequency of occurrence across the 2,335 human protein targets within the top 1 to top 40 hits (Figure 5a). Several “blockbuster” drugs are predicted to target proteins across multiple families. Sutent is predicted to hit the greatest number of protein targets followed by Alimta, Lescol, Celebrex, Premarin, Zetia, and Blopress (Figure 5b). Sutent, the drug predicted to be the most promiscuous, is a multi-kinase inhibitor prescribed to treat various cancers. Remarkably, Prograf, Valcote, Concerta, Sifrol, Niaspan, Exelon, Evodart, Sevorane, and Klacid have no hits in our protein dataset (Figure 5c). Out of 2,335 targets, a blockbuster drug is ranked first for 79 (3.2%), ranked in the top 5 for 243 (10.9%), and ranked in the top 20 for 816 targets (36.5%) (Figure 5d). 96 targets (4.3%) are predicted to bind to three or more “blockbuster drugs”. Taken together, these results may imply either toxicity by cross target effects or potentially beneficial effects that might indicate new uses. In addition to utility in drug repurposing, these data may also provide clues for the synthesis of analogues with higher specificity for particular targets if the repurposed drug shows weak affinity towards a particular target.
Figure 5. Analysis of FDA Blockbuster Drug-Target Association.
(A) Heatmap depicting hit frequencies of the Top 200 “blockbuster” FDA drugs across each top-rank category. Each box shows the number of occurrences while the color scheme illustrates high frequencies as red and low frequencies as blue. (B) Heatmap showing FDA approved drugs predicted to hit the greatest number of protein targets: Sutent, Alimta, Lescol, Celebrex, Premarin, Zetia, and Blopress. (C) Heatmap portraying FDA approved drugs that have no hits in our protein dataset: Prograf, Valcote, Concerta, Sifrol, Niaspan, Exelon, Evodart, Sevorane, and Klacid. (D) Histogram showing the percentage of total protein targets in our data set that have a FDA Blockbuster Drug in their Top 1, 5 and 20 rank lists.
Drug promiscuity and overlap of protein family and fold
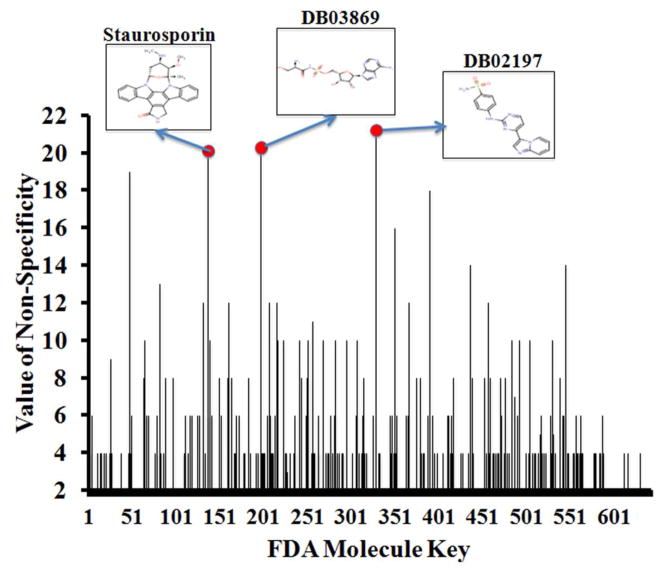
In drug development, it is important that molecules reach and interact with their desired targets while minimizing cross-target interactions. However, many FDA approved drugs have notable side effects that consumers are warned about prior to their administration. Thus, we were interested in investigating whether our method could more formally predict the extent of drug promiscuity/non-specificity. We evaluated the extent of promiscuity in terms of protein family and fold classifications. We used the entire SCOP database and parsed it to create a CSV file that matches PDB IDs with their corresponding fold and family keys (41). For each molecule in the drug data set, we then determined the targets for which they are considered the top 1 hit and used those PDB IDs to determine the folds and families they correspond to. Using this information, we were able to determine the numbers of unique folds and families that the drugs are targeting. To objectively quantify the “promiscuity” of a molecule, we devised a numerical score to create the “value of promiscuity”. This value is the combined sum of the number of unique folds and the number of unique families that a particular molecule is predicted to hit. The greater this value is, the greater the extent of promiscuity. According to Figure 6, the three most promiscuous compounds (DB02197, DB03869 and staurosporine) are kinase inhibitors. As indicated above, staurosporine is a “broad–specificity kinase inhibitor” targeting multiple families especially kinases (40,42). Furthermore, Tables 2 and 3 show that the five most promiscuous drugs are predicted to interact with proteins that have many overlapping folds/families. Intrigued by this result, we further explored whether shape similarities of protein binding pockets may exhibit drug promiscuity.
Figure 6. Analysis of Drug Promiscuity.
The “value of promiscuity (non-specificity) for each drug is represented as a numerical score from the combined sum of the number of unique folds and the number of unique families that a particular molecule is predicted to hit. The drug with the greatest “value of non-specificity” is considered to be the most promiscuous molecule. The histogram depicts the “values of non-specificity” (y-axis) for each drug (x-axis) that had been ranked in the top 1 position, along with the 2D structures of the three most promiscuous compounds.
Table 2.
The specific protein folds of targets that TMFS predicted for the top five most promiscuous drugs.
| Molecule | Folds Targeted |
|---|---|
| DB02197 | Protein kinase-like, ATPase domain of HSP90 chaperone/DNA topoisomerase II, Nudix, Zincin-like, Phosphotyrosine Protein Phosphatases II, P-loop containing nucleoside triphosphate hydrolases, NAD(P)-binding Rossman fold domains, TIM beta/alpha-barrel, Concanavalin A-like lectin/glucanases, Prealbumin-like |
| DB03869 | HD-domain/PDEase-like, Protein kinase-like, ATPase domain of HSP90 chaperone/DNA topoisomerase II, P-loop containing nucleoside triphosphate hydrolases, TIM beta/alpha-barrel, Ferredoxin-like, Anticodon-binding domain-like, Carbonic anhydrase, Trypsin-like serine proteases, Nuclear receptor ligand-binding domain |
| DB02010 | GRIP Domain, P-loop containing nucleoside triphosphate hydrolases, TIM beta/alpha-barrel, Protein kinase-like, Phosphotyrosine protein phosphatases II, Trypsin-like serine proteases, HAD-like, SH2-like, Ribonuclease H-like motif, 8-bladed beta-propeller |
| DB00686 | Protein kinase-like, ATPase domain of HSP90 chaperone/DNA topoisomerase II, Phosphotyrosine protein phosphatases II, P-loop containing nucleoside triphosphate hydrolases, Phosphoglycerate mutase-like, Lipocalins, Cyclin-like, Trypsin-like serine proteases, Nuclear receptor ligand-binding domain |
| DB04700 | Protein kinase-like, ATPase domain of HSP90 chaperone/DNA topoisomerase II, Carbonic anhydrase, Nuclear receptor ligand-binding domain, Phosphorylase/hydrolase-like, Alpha/alpha toroid, Transducin (alpha subunit), GST C-terminal domain-like, DNA/RNA-binding 3- helical bundle |
Table 3.
The specific protein families of targets that TMFS predicted for the top five most promiscuous drugs.
| Molecule | Families Targeted |
|---|---|
| DB02197 | Protein kinases (catalytic subunit), HSP90 (N-terminal domain), MutT- like, Matrix metalloproteinases (catalytic domain), Higher-molecular- weight phosphotyrosine protein phosphatases, Motor proteins, Phosphoribulokinase/pantothenate kinase, Tyrosine-dependent oxidoreductases, Aldo-keto reductases (NADP), Galectin (animal S- lectin), Transthyretin (prealbumin) |
| DB03869 | Protein kinases (catalytic subunit), HSP90 (N-terminal domain), Aldo- keto reductases (NADP), NAD-binding domain of HMG-CoA reductase, ITPase (HAM1), G proteins, Carbonic anhydrase, Eukaryotic proteases, PDEase, Nuclear receptor ligand-binding domain |
| DB02010 | Protein kinases (catalytic subunit), Higher-molecular-weight phosphotyrosine protein phosphatases, G proteins, Aldo-keto reductases (NADP), Eukaryotic proteases, GRIP domain, 5′(3′)- deoxyribonucleotidase (dNT-2), DPP6 N-terminal domain-like, BadF/BadG/BcrA/BcrD-like, SH2-domain |
| DB00686 | Protein kinases (catalytic subunit), HSP90 (N-terminal domain), Higher- molecular-weight phosphotyrosine protein phosphatases, G proteins, Phosphoribulokinase/pantothenate kinase, Eukaryotic proteases, Nuclear receptor ligand-binding domain, Cofactor-dependent phosphoglycerate mutase, Fatty acid binding protein-like, Cyclin |
| DB04700 | Protein kinases (catalytic subunit), HSP90 (N-terminal domain), Carbonic anhydrase, Nuclear receptor ligand-binding domain, Purine and uridine phosphorylases, Terpene synthases, Transducin (alpha subunit), Glutathione S-transferase (C-terminal domain), Methionine aminopeptidase |
Similarly shaped protein pockets bind similarly shaped molecules
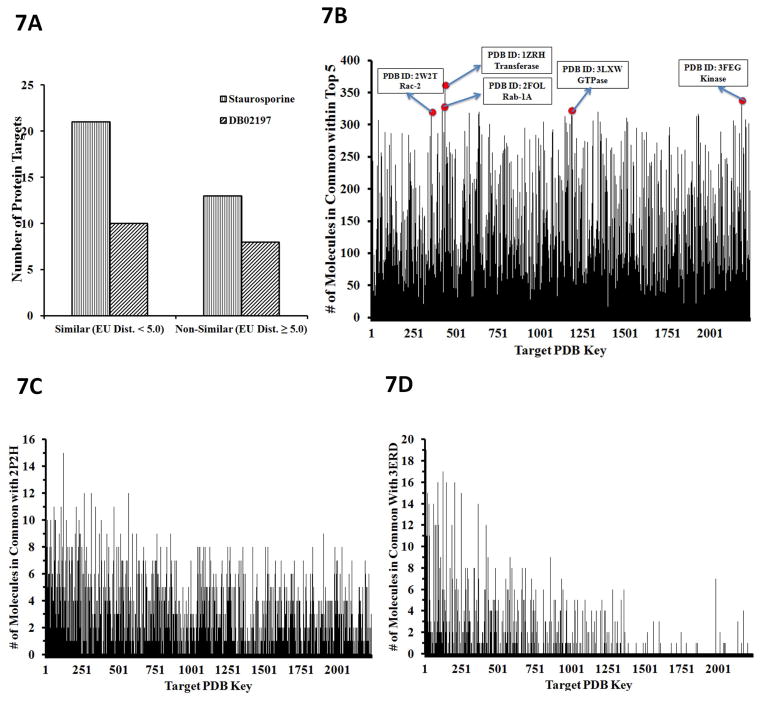
In drug development, it is commonly asked if protein targets with similar binding sites bind similar molecules. Given the central dogma of “form fits function”, it is usually acceptable to assume this. To determine the similarity of binding sites between proteins, we calculated the Euclidean distances between the spherical harmonics (SH) expansion coefficients of the binding pockets at a 6Å radius from neighboring residues. Binding site protomols were utilized from the sc-PDB database (37) and SurFlexDock within SYBYL X.1 (38). These protomols provide a space-filled 3D structure of the binding sites using carbon, hydrogen and oxygen atoms. To get a more refined sense of the pockets, we removed the oxygen atoms because of their large atomic radii and proceeded with the SH calculations on the remaining carbon and hydrogen atoms. With the binding pocket shapes quantified, we then calculated the Euclidean distances between target binding pockets in which we took each target as a template pocket and calculated Euclidean distances against all the other probe target binding pockets. The most similar pockets were those whose Euclidean distances were closest to zero. Then to determine if similarly shaped pockets bind similar molecules, we took three approaches. First, we took drugs DB2010 (staurosporine) and DB02197 (the most frequent hits using the Top 1 and Top 40 rankings, respectively) and determined if the number of proteins with similarly shaped binding sites was greater than that of those with lesser similarity. Figure 7a is a clustered histogram illustrating this relationship, and shows that more similarly shaped pockets exist for both drugs. Next, we analyzed how many targets intersect with the top five reprofiled drugs for each target. We defined this intersection to be the number of times a top five-profiled drug for a reference target also appears in the top five rank lists with respect to the rest of the targets. We found that many targets have drugs that are common across the total protein data set (Figure 7b). Lastly, we analyzed the estrogen receptor alpha protein (PDB ID: 3ERD) and vascular endothelial growth factor receptor (PDB ID: 2P2H) binding pocket commonality with respect to the 2,335 targets (Figure 7c and 7d). We calculated Euclidean distances of the 2,335 target pockets against these two template pocket structures and subsequently counted how many of the top 20 ranked molecules for each protein target were common to each template. We found that those pockets with the greatest shape similarity have the greatest number of drug hits in common with the templates (Figure 7c and 7d). These results suggest that similarly shaped protein pockets bind similar molecules and indicate that a drug can be repurposed to other indications based in part upon similarly shaped targets.
Figure 7. Similarly-shaped protein binding pockets bind similar molecules.
(A) Histogram where the left-most protein target on the X-axis corresponded to the protein target whose pocket was most similar to the template. If these histograms tapered off to the right, this indicates that protein target ligand commonality is highly correlated to the three-dimensional spatial similarity of their binding pockets. (B) Commonality of the top-ranked drugs. The predicted top 5 ranked drugs were counted for each target. Commonality is defined as the number of times a molecule from the top-rank list for a reference protein target also shows up in the corresponding top-rank list for the rest of the targets. The histogram depicts the “commonality score” for molecules within the Top 5 rank list for each protein target data set. The top 5 protein targets, (w.r.t. commonality score), which were co-crystalized with a nucleotide (4 out of 5 are GDP, one is adenosine), are highlighted with their PDB codes and name. (C) Histogram depicting the number of molecules in common for all protein targets ordered from greatest to least with respect to pocket shape similarity to VEGFR2. (D) Histogram depicting the number of molecules in common for all protein targets ordered from greatest to least with respect to pocket shape similarity to ERa.
Experimental Validation
Mebendazole binds to VEGFR-2 and inhibits angiogenesis
The TMFS method predicted that Mebendazole, an anti-parasitic with unexpected anti-cancer properties in animals and humans, had a strong likelihood of binding to and inhibiting the function of VEGFR2 (43,44). According to the final rank list of the 3,671 drugs against VEGFR2, Mebendazole was ranked higher than the related inhibitor, Albendazole. We therefore elected to proceed with this experimental validation based on this particular finding.
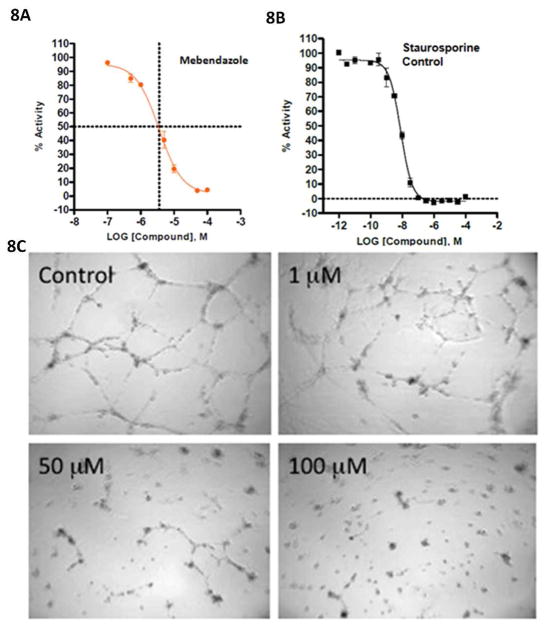
Indeed, our in vitro studies show that Mebendazole binds to VEGFR-2 and inhibits kinase activity at 3.6 \M (Figure 8a) with staurosporine serving as the control (Figure 8b). We also found that Mebendazole blocks angiogenesis in a human umbilical vein endothelial cell (HUVEC) based angiogenesis functional assay. The efficiency of Mebendazole to inhibit the VEGFR2 kinase was measured by monitoring the ability of HUVECs to form networks. In the HUVEC angiogenesis assay, formation of the cellular network progresses in a stepwise manner with an initial migration and alignment of cells, followed by development of capillary tube-like structures, sprouting of new branches, and finally formation of a cellular network (45–46). Cells treated with Mebendazole did not migrate and align, sprout branches or form networks (Figure 8c) with an IC50 of 8.8 μM. Albendazole, a close analog of Mebendazole, was previously demonstrated to inhibit angiogenesis (45–47). In both assays, Mebendazole is active at a concentration similar to that approved for use in preventing hookworm infection.
Figure 8. Mebendazole binds directly to VEGFR2 kinase assay and also inhibits angiogenesis.
(A) Mebendazole binds directly to VEGFR2 and affects VEGFR2 kinase activity with an IC50 value of 3.6 μM. IC50 curves were generated using GraphPad 5 and a standard 4-parameter non-linear regression model (log [inhibitor] vs response – variable slope). Data points correspond to the averages of duplicate wells, and error bars represent the mean ± replicate % activity. The graphical representation shows dashed lines at the IC50 values, where the vertical line is at (log x) = −5.4437. Solving the equation (log x) = −5.4437 results in the IC50 value of 3.6 μM. (B) Control: Staurosporine binds to VEGFR2 and affects kinase activity with a IC50 value of 8 nM. (C). Mebendazole, predicted to act as a VEGFR2 inhibitor by TMFS, inhibits angiogenesis in a HUVEC cell based assay. Mebendazole significantly inhibited network formation with an IC50 value of 8.8 μM, which is implicated by the lack of cellular migration, alignment and branching.
Celecoxib binds to Cadherin-11 (CDH11)
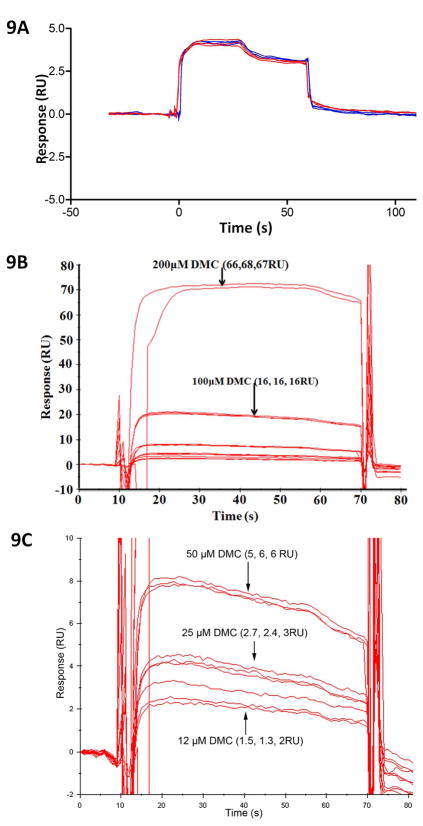
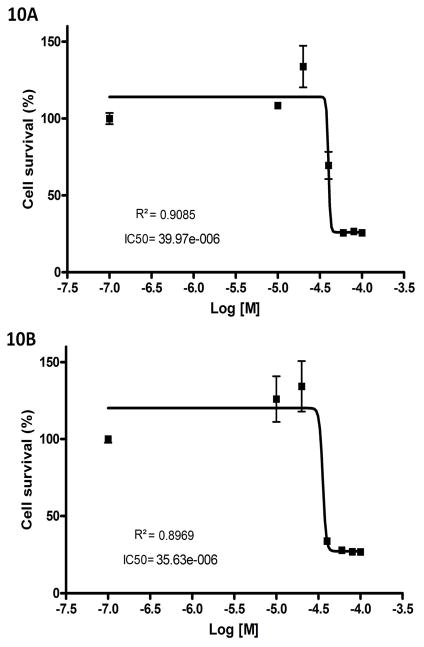
To our complete surprise, an anti-inflammatory cycloxgenase-2 inhibitor, celecoxib and its COX-2 inactive analogue dimethyl celecoxib (DMC) were ranked as top hits for interaction with CDH11, an adhesion molecule important in the inflammatory disease rheumatoid arthritis and in several poor prognosis malignancies. Consistent with its known role as a COX-2 inhibitor, celecoxib was rank-ordered as top 1 for COX-2. Celecoxib is already in use as an anti-inflammatory agent in arthritis where its activity is not solely related to inhibition of COX-2. We assessed the ability of dimethyl celecoxib and celecoxib to bind CDH11 using Surface Plasmon Resonance (Figure 9a–c). Both celecoxib and, importantly, the closely related but inactive (w.r.t. COX-2 inhibition) dimethyl celecoxib interacted with CDH11 as measured by SPR. We further calculated the growth inhibition of the MDA-MB-231 invasive breast cancer cell line by celecoxib and DMC (Figure 10a and 10b). We found that celecoxib and DMC cause inhibition with an IC50 of 40 μM and 36 μM, respectively. These findings correlate well with experimental and clinical studies where dimethyl celecoxib works as well as celecoxib, which points to a COX-2-independent mode of action (48–59). The measured IC50’s of celecoxib and DMC are comparable to known celecoxib plasma concentrations in patients. Circulating levels in rats and in humans are in the 1–10uM range for celecoxib and are not known for dimethyl celecoxib. Importantly, the Kd for the known celecoxib target Cox2 is in the low nanomolar range for in-vitro measurement of enzyme inhibition yet its effects on inflammation and cancer cell growth are in the micromolar range. Taken together with the fact that DMC has no effect on Cox2 yet is equally effective as an anti-cancer agent and in some cases as an anti-inflammatory, these discrepancies strongly point to a Cox2-independent mode of action. Though the affinity of dimethyl celecoxib for CDH11 is weak enough, and this is being a potential starting point for further optimization.
Figure 9. Celecoxib (CCB) and Dimethyl-celecoxib (DMC) bind directly to immobilized cadherin-11 (CDH11) in Surface Plasmon Resonance (SPR) assay.
(A) CCB and DMC bind to recombinant mouse extracellular domain (EC) 1–2 of CDH11 protein immobilized on the surface of the chip via similar patterns, as evident in the sensogram. CCB and DMC were separately injected three times on the CM5 chip at 25 μM. (B & C) CCB and DMC bind in a dose-dependent manner. (B) Lower magnification of the sensogram showing the signals generated from 200 and 100 μM of DMC bound to cadherin-11. (C) Higher magnification of the compacted signals from panel A showing the binding levels of 50, 25 and 12 μM DMC to cadherin-11. Assays were performed in triplicates for each DMC concentration.
Figure 10. Growth inhibition of MDA-MB-231 invasive breast cancer cell line by celecoxib (CCB) and its COX-2 inactive analogue dimethyl –celecoxib (DMC).
MTS assays demonstrating concentration-dependent cell growth inhibition when MDA-MB-231 cells were exposed to increasing doses of CCB or DMC for 48 hrs. Data is presented as the mean ± S.E.M. (A) CCB causes inhibition with an IC50 of 40 μM, and (B) DMC causes inhibition with an IC50 36 μM.
Conclusions
We have developed a new computational method called “TMFS” that includes a docking score, ligand and receptor shape/topology descriptor scores, and ligand-receptor contact point scores to predict “molecules of best fit” and filter out most false positive interactions. Using our TMFS method, we reprofiled 3,671 FDA approved/experimental drugs against 2,335 human protein targets. We predicted several drug-target associations that could potentially be applied to new disease indications. Literature validation using public databases reveals that the TMFS method predicts drug-target associations with greater than 91% accuracy for the majority of drugs. We predicted and experimentally validated that the anti-hookworm medication Mebendazole can inhibit VEGFR2 activity and angiogenesis, and that the anti-inflammatory drug Celcoxib and its analog DMC can bind to CDH11, a biomolecule that is very important in rheumatoid arthritis and poor prognosis malignancies, and for which no targeted therapies currently exist. TMFS-predicted drug-target associations not only reveal potential drug candidates for new indications, but also provide structural insight into their mechanism of action and cross-target effects.
Despite these promising results, it is imperative that we discuss the current limitations of our method. TMFS is reliant on the presence of a crystalized protein-ligand complex, where the bioactive conformations of both the protein pocket and ligand are known. This information is important for obtaining descriptor values, such as shape, that are as close to the natural occurrence as possible. However, we understand that it may be difficult to apply TMFS to emerging targets that do not have an X-ray structure or known low molecular weight compounds that modulate them. In an attempt to address these issues, we are currently working on fine-tuning TMFS so that it may reliably predict ligand-protein interactions for targets crystallized without a known associated ligand. Since the shape of the binding pocket will be known in this scenario, TMFS would be able to rely mostly on shape differences between the binding pocket and query ligands, for, as we have shown in Figure 2a, the shape descriptor alone is able to provide significant enrichment.
Since we started our work, the NIH’s Chemical Genomics Center (NCGC) opened its Pharmaceutical Collection database for public screening of nearly 27,000 active pharmaceutical ingredients, including 2,750 approved small-molecule drugs and all compounds registered for human clinical trials (3). In this study, we screened only 3,671 compounds. We are currently extending our computational screening to include these 27,000 active pharmaceutical ingredients to all human proteins and other species, including infectious diseases. An obvious advantage of drug repositioning is that existing drugs approved for human use have known pharmacokinetics, toxicity, and safety profiles. Hence, any newly identified use can be rapidly evaluated directly in phase II clinical trials, thus reducing time and cost. Although clinical studies will be needed before a drug can be approved for a new indication, this work shows that computational screening of approved drugs can uncover additional uses for other targets/diseases.
Supplementary Material
Acknowledgments
This project has been funded in part with Federal funds from the National Institutes of Health NIH R01-CA129813, NIH R01-DK58196, NIH P01CA130821, NIH Contract No. HHSN261200800001E, NIH 1KL2RR031974, and the Department of Defense grants BC062416-01 and W81XWH-10-1-0437. We acknowledge the Georgetown-Lombardi Cancer Center Grant Support Grant and the Surface Plasmon Resonance Shared Resource and Caliper Life Sciences for the kinase assay. We also thank reviewers for their fruitful comments.
References
- 1.Paul SM, Mytelka DS, Dunwiddie CT, Persinger CC, Munos BH, Lindborg SR, Schacht AL. How to improve R&D productivity: The pharmaceutical industry’s grand challenge. Nat Rev Drug Discovery. 2010;9:203–214. doi: 10.1038/nrd3078. [DOI] [PubMed] [Google Scholar]
- 2.Lawrence S. Drug output slows in 2006. Nat Biotechnol. 2007;25:1073. [Google Scholar]
- 3.Huang R, Southall N, Wang Y, Yasgar A, Shinn P, Jadhav A, Nguyen D, Austin C. The NCGC Pharmaceutical Collection: A Comprehensive Resource of Clinically Approved Drugs Enabling Repurposing and Chemical Genomics. Sci Transl Med. 2011;3(80):80ps16. doi: 10.1126/scitranslmed.3001862. [DOI] [PMC free article] [PubMed] [Google Scholar]
- 4.Collins FS. Mining for therapeutic gold. Nat Rev Drug Discovery. 2011;10(6):395. doi: 10.1038/nrd3461. [DOI] [PMC free article] [PubMed] [Google Scholar]
- 5.DiMasi JA, Hansen RW, Grabowski HG. The price of innovation: new estimates of drug development costs. J Health Econ. 2003;22(2):151–185. doi: 10.1016/S0167-6296(02)00126-1. [DOI] [PubMed] [Google Scholar]
- 6.Buehler LK. Advancing Drug Discovery - Beyond Design. Pharmagenomics. 2004;4:24–26. [Google Scholar]
- 7.Hughes B. 2007 FDA drug approvals: a year of flux. Nat Rev Drug Discovery. 2008;7:107–109. doi: 10.1038/nrd2514. [DOI] [PubMed] [Google Scholar]
- 8.Ashburn TT, Thor KB. Drug repositioning: identifying and developing new uses for existing drugs. Nat Rev Drug Discovery. 2004;3:673–683. doi: 10.1038/nrd1468. [DOI] [PubMed] [Google Scholar]
- 9.Druker B. Imatinib as a paradigm of targeted therapies. Adv Cancer Res. 2004;91:1–30. doi: 10.1016/S0065-230X(04)91001-9. [DOI] [PubMed] [Google Scholar]
- 10.Young D, Bender A, Hoyt J, McWhinnie E, Chirn G, Tao C, Tallarico J, Labow M, Jenkins J, Mitchison T, Feng Y. Integrating high-content screening and ligand-target prediction to identify mechanism of action. Nat Chem Biol. 2008;4:59–68. doi: 10.1038/nchembio.2007.53. [DOI] [PubMed] [Google Scholar]
- 11.Wagner B, Kitami T, Gilbert T, Peck D, Ramanathan A, Schreiber S, Golub T, Mootha V. Large-scale chemical dissection of mitochondrial function. Nat Biotechnol. 2008;26:343–351. doi: 10.1038/nbt1387. [DOI] [PMC free article] [PubMed] [Google Scholar]
- 12.Bajorath J. Computational analysis of ligand relationships within target families. Curr Opin Chem Biol. 2008;12:352–358. doi: 10.1016/j.cbpa.2008.01.044. [DOI] [PubMed] [Google Scholar]
- 13.Oprea T, Tropsha A, Faulon J, Rintoul M. Systems Chemical Biology. Nat Chem Biol. 2007;3:447–450. doi: 10.1038/nchembio0807-447. [DOI] [PMC free article] [PubMed] [Google Scholar]
- 14.Siegel M, Vieth M. Drugs in other drugs: a new look at drugs as fragments. Drug Discover Today. 2007;12:71–79. doi: 10.1016/j.drudis.2006.11.011. [DOI] [PubMed] [Google Scholar]
- 15.Miller J, Dunham S, Mochalkin I, Banotai C, Bowman M, Buist S, Dunkle B, Hanna D, Harwood H, Huband M, Karnovsky A, Kuhn M, Limberakis C, Liu J, Mehrens S, Mueller W, Narasimhan L, Ogden A, Ohren J, Prasad J, Shelly J, Skerlos L, Sulavik M, Thomas V, VanderRoest S, Wang L, Wang Z, Whitton A, Zhu T, Stover C. A class of selective antibacterials derived from a protein kinase inhibitor pharmacophore. Proc Natl Acad Sci US A. 2009;106:1737–1742. doi: 10.1073/pnas.0811275106. [DOI] [PMC free article] [PubMed] [Google Scholar]
- 16.Walsh CT, Fischbach MA. Repurposing libraries of eukaryotic protein kinase inhibitors for antibiotic discovery. Proc Natl Acad Sci US A. 2009;106:1689–1690. doi: 10.1073/pnas.0813405106. [DOI] [PMC free article] [PubMed] [Google Scholar]
- 17.Keiser M, Setola V, Irwin J, Laggner C, Abbas A, Hufeisen S, Jensen N, Kuijer M, Matos R, Tran T, Whaley R, Glennon R, Hert J, Thomas K, Edwards D, Shoichet B, Roth B. Predicting new molecular targets for known drugs. Nature. 2009;462:175–182. doi: 10.1038/nature08506. [DOI] [PMC free article] [PubMed] [Google Scholar]
- 18.Li Y, An J, Jones S. A Computational Approach to Finding Novel Targets for Existing Drugs. PLoS Comput Biol. 2011;7:1–13. doi: 10.1371/journal.pcbi.1002139. [DOI] [PMC free article] [PubMed] [Google Scholar]
- 19.Cho Y, Vermeire J, Merkel J, Leng L, Du X, Bucala R, Cappello M, Lolis E. Drug Repositioning and Pharmacophore Identification in the Discovery of Hookworm MIF Inhibitors. Chem Biol. 2011;18:1089–1101. doi: 10.1016/j.chembiol.2011.07.011. [DOI] [PMC free article] [PubMed] [Google Scholar]
- 20.Li H, Liu A, Zhao Z, Xu Y, Lin J, Jou D, Li C. Fragment-Based Drug Design and Drug Repositioning Using Multiple Ligand Simultaneous Docking (MLSD): Identifying Celecoxib and Template Compounds as Novel Inhibitors of Signal Transducer and Activator of Transcription 3 (STAT3) J Med Chem. 2011;54:5592–5596. doi: 10.1021/jm101330h. [DOI] [PMC free article] [PubMed] [Google Scholar]
- 21.Moriaud F, Richard S, Adcock S, Chanas-Martin L, Surgand J, Jelloul M, Delfaud F. Identify drug repurposing candidates by mining the Protein Data Bank. Briefings Bioinf. 2011;12:336–340. doi: 10.1093/bib/bbr017. [DOI] [PubMed] [Google Scholar]
- 22.Kinnings S, Liu N, Buchmeier N, Tonge P, Xie L, Bourne P. Drug Discovery Using Chemical Systems Biology: Repositioning the Safe Medicine Comtan to Treat Multi-Drug and Extensively Drug Resistant Tuberculosis. PLoS Comput Biol. 2009;5(7):e1000423. doi: 10.1371/journal.pcbi.1000423. [DOI] [PMC free article] [PubMed] [Google Scholar]
- 23.Campillos M, Kuhn M, Gavin A, Jensen L, Bork P. Drug Target Identification Using Side-Effect Similarity. Science. 2008;321:263–266. doi: 10.1126/science.1158140. [DOI] [PubMed] [Google Scholar]
- 24.Dudley J, Sirota M, Shenoy M, Pai R, Roedder S, Chiang A, Morgan A, Sarwal M, Pasricha P, Butte A. Computational Repositioning of the Anticonvulsant Topiramate for Inflammatory Bowel Disease. Sci Transl Med. 2011;3(96):96ra76. doi: 10.1126/scitranslmed.3002648. [DOI] [PMC free article] [PubMed] [Google Scholar]
- 25.Zhao X, Iskar M, Zeller G, Kuhn M, Noort V, Bork P. Prediction of Drug Combinations by Integrating Molecular and Pharmacological Data. PLoS Comput Biol. 2011;7(12):e1002323. doi: 10.1371/journal.pcbi.1002323. [DOI] [PMC free article] [PubMed] [Google Scholar]
- 26.Gottlieb A, Stein G, Ruppin E, Sharan R. PREDICT: a method for inferring novel drug indications with application to personalized medicine. Mol Syst Biol. 2011;7:496. doi: 10.1038/msb.2011.26. [DOI] [PMC free article] [PubMed] [Google Scholar]
- 27.Sirota M, Dudley J, Kim J, Chiang A, Morgan A, Sweet-Cordero A, Sage J, Butte A. Discovery and Preclinical Validation of Drug Indications Using Compendia of Public Gene Expression Data. Sci Transl Med. 2011;3(96):96ra77. doi: 10.1126/scitranslmed.3001318. [DOI] [PMC free article] [PubMed] [Google Scholar]
- 28.Kolb P, Irwin J. Docking screens: right for the right reasons? Curr Top Med Chem. 2009;9:755–770. doi: 10.2174/156802609789207091. [DOI] [PMC free article] [PubMed] [Google Scholar]
- 29.Taylor R, Jewsbury P, Essex J. A review of protein-small molecule docking methods. J Comput Aided Mol Des. 2002;16:151–166. doi: 10.1023/a:1020155510718. [DOI] [PubMed] [Google Scholar]
- 30.Abagyan R, Totrov M. High-throughput docking for lead generation. Curr Opin Chem Biol. 2001;5(4):375–382. doi: 10.1016/s1367-5931(00)00217-9. [DOI] [PubMed] [Google Scholar]
- 31.Warren GL, Andrews CW, Capelli A, Clarke B, LaLonde J, Lambert MH, Lindvall M, Nevins N, Semus SF, Senger S, Tedesco G, Wall ID, Woolven JM, Peishoff CE, Head MS. A critical assessment of docking programs and scoring functions. J Med Chem. 2006;49:5912–5931. doi: 10.1021/jm050362n. [DOI] [PubMed] [Google Scholar]
- 32.Leach AR, Shoichet BK, Peishoff CE. Prediction of protein-ligand interactions. Docking and scoring: successes and gaps. J Med Chem. 2006;49:5851–5855. doi: 10.1021/jm060999m. [DOI] [PubMed] [Google Scholar]
- 33.Coupez B, Lewis RA. Docking and scoring: theoretically easy, practically impossible? Curr Med Chem. 2006;13:2995–3003. doi: 10.2174/092986706778521797. [DOI] [PubMed] [Google Scholar]
- 34.Kroemer RT. Structure-based drug design: docking and scoring. Curr Protein Pept Sci. 2007;8(4):312–328. doi: 10.2174/138920307781369382. [DOI] [PubMed] [Google Scholar]
- 35.Kahraman A, Morris R, Laskowski R, Thornton J. Shape variation in protein binding pockets and their ligands. J Mol Biol. 2007;368:283–301. doi: 10.1016/j.jmb.2007.01.086. [DOI] [PubMed] [Google Scholar]
- 36.Patel SD, Ciatto C, Chen CP, Bahna F, Rajebhosale M, Arkus N, Schieren I, Jessell TM, Honig B, Price SR, Shapiro L. Type II cadherin ectodomain structures: implications for classical cadherin specificity. Cell. 2006;124(6):1255–1268. doi: 10.1016/j.cell.2005.12.046. [DOI] [PubMed] [Google Scholar]
- 37.Sc-PDB Home Page. http://cheminfo.u-strasbg.fr:8080/scPDB/2011/db_search/acceuil.jsp?uid=3807447192798425088.
- 38.SYBYL X. Tripos International; St. Louis, MO USA: [Google Scholar]
- 39.Huang N, Shoichet B, Irwin J. Benchmarking Sets for Molecular Docking. J Med Chem. 2006;49:6789–6801. doi: 10.1021/jm0608356. [DOI] [PMC free article] [PubMed] [Google Scholar]
- 40.Karaman M, Herrgard S, Treiber D, Gallant P, Atteridge C, Campbell B, Chan K, Ciceri P, Davis M, Edeen P, Faraoni R, Floyd M, Hunt J, Lockhart D, Milanov Z, Morrison M, Pallares G, Patel H, Pritchard S, Wodicka L, Zarrinkar P. A quantitative analysis of kinase inhibitor selectivity. Nat Biotechnol. 2008;26(1):127–132. doi: 10.1038/nbt1358. [DOI] [PubMed] [Google Scholar]
- 41.Murzin AG, Brenner SE, Hubbard T, Chothia C. SCOP: a structural classification of proteins database for the investigation of sequences and structures. J Mol Biol. 1995;247:536–540. doi: 10.1006/jmbi.1995.0159. [DOI] [PubMed] [Google Scholar]
- 42.Cho JY, Katz DR, Chain BM. Staurosporine induces rapid homotypic intercellular adhesion of U937 cells via multiple kinase activation. Br J Pharmacol. 2003;140:269–276. doi: 10.1038/sj.bjp.0705436. [DOI] [PMC free article] [PubMed] [Google Scholar]
- 43.Martarelli D, Pompei P, Baldi C, Mazzoni G. Mebendazole inhibits growth of human adrenocortical carcinoma cell lines implanted in nude mice. Cancer Chemother Pharmacol. 2008;61(5):809–817. doi: 10.1007/s00280-007-0538-0. [DOI] [PubMed] [Google Scholar]
- 44.Bai RY, Staedtke V, Aprhys CM, Gallia GL, Riggins GJ. Antiparasitic mebendazole shows survival benefit in 2 preclinical models of glioblastoma multiforme. Neuro Oncol. 2011;13(9):974–982. doi: 10.1093/neuonc/nor077. [DOI] [PMC free article] [PubMed] [Google Scholar]
- 45.Montesano R, Orci L, Vassalli P. In vitro rapid organization of endothelial cells into capillary-like networks is promoted by collagen matrices. J Cell Biol. 1983;97:1648–1652. doi: 10.1083/jcb.97.5.1648. [DOI] [PMC free article] [PubMed] [Google Scholar]
- 46.Vailhe B, Vittet D, Feige J. In Vitro Models of Vasculogenesis and Angiogenesis. Lab Invest. 2001;81:439–452. doi: 10.1038/labinvest.3780252. [DOI] [PubMed] [Google Scholar]
- 47.Pourgholami MH, Khachigian LM, Fahmy RG, Badar S, Wang L, Chu SW, Morris DL. Albendazole inhibits endothelial cell migration, tube formation, vasopermeability, VEGF receptor-2 expression and suppresses retinal neovascularization in ROP model of angiogenesis. Biochem Biophys Res Commun. 2010;397(4):729–734. doi: 10.1016/j.bbrc.2010.06.019. [DOI] [PubMed] [Google Scholar]
- 48.Sade A, Tuncay S, Cimen I, Severcan F, Banerjee S. Celecoxib reduces fluidity and decreases metastatic potential of colon cancer cell lines irrespective of COX-2 expression. Biosci Rep. 2012;32(1):35–44. doi: 10.1042/BSR20100149. [DOI] [PubMed] [Google Scholar]
- 49.Zweers MC, de Boer TN, van Roon J, Bijlsma JW, Lafeber FP, Mastbergen SC. Celecoxib: considerations regarding its potential disease-modifying properties in osteoarthritis. Arthritis Res Ther. 2011;13(5):239. doi: 10.1186/ar3437. [DOI] [PMC free article] [PubMed] [Google Scholar]
- 50.Cervello M, Bachvarov D, Cusimano A, Sardina F, Azzolina A, Lampiasi N, Giannitrapani L, McCubrey J, Montalto G. COX-2-dependent and COX-2-independent mode of action of celecoxib in human liver cancer cells. OMICS. 2011;15(6):383–392. doi: 10.1089/omi.2010.0092. [DOI] [PubMed] [Google Scholar]
- 51.Sareddy GR, Geeviman K, Ramulu C, Babu PP. The nonsteroidal anti-inflammatory drug celecoxib suppresses the growth and induces apoptosis of human glioblastoma cells via the NF-kappaB pathway. J Neurooncol. 2011;106(1):99–109. doi: 10.1007/s11060-011-0662-x. [DOI] [PubMed] [Google Scholar]
- 52.Schonthal AH. Exploiting cyclooxygenase-(in)dependent properties of COX-2 inhibitors for malignant glioma therapy. Anticancer Agents Med Chem. 2010;10(6):450–461. doi: 10.2174/1871520611009060450. [DOI] [PubMed] [Google Scholar]
- 53.Bastos-Pereira AL, Lugarini D, Oliveira-Christoff A, Avila TV, Teixeira S, Pires do AR, Muscará MN, Cadena SM, Donatti L, Cristina da Silva de Assis H, Acco A. Celecoxib prevents tumor growth in an animal model by a COX-2 independent mechanism. Cancer Chemother Pharmacol. 2010;65(2):267–276. doi: 10.1007/s00280-009-1031-8. [DOI] [PubMed] [Google Scholar]
- 54.Tsutsumi R, Ito H, Hiramitsu T, Nishitani K, Akiyoshi M, Kitaori T, Yasuda T, Nakamura T. Celecoxib inhibits production of MMP and NO via down-regulation of NF-kappaB and JNK in a PGE2 independent manner in human articular chondrocytes. Rheumatol Int. 2008;28(8):727–736. doi: 10.1007/s00296-007-0511-6. [DOI] [PubMed] [Google Scholar]
- 55.Miyamoto K, Miyake S, Mizuno M, Oka N, Kusunoki S, Yamamura T. Selective COX-2 inhibitor celecoxib prevents experimental autoimmune encephalomyelitis through COX-2-independent pathway. Brain. 2006;129(Pt 8):1984–1992. doi: 10.1093/brain/awl170. [DOI] [PubMed] [Google Scholar]
- 56.Kusunoki N, Yamazaki R, Kawai S. Induction of apoptosis in rheumatoid synovial fibroblasts by celecoxib, but not by other selective cyclooxygenase 2 inhibitors. Arthritis Rheum. 2002;46(12):3159–3167. doi: 10.1002/art.10692. [DOI] [PubMed] [Google Scholar]
- 57.Tsutsumi R, Ito H, Hiramitsu T, Nishitani K, Akiyoshi M, Kitaori T, Yasuda T, Nakamura T. Celecoxib inhibits production of MMP and NO via down-regulation of NF-kappaB and JNK in a PGE2 independent manner in human articular chondrocytes. Rheumatol Int. 2008;28(8):727–736. doi: 10.1007/s00296-007-0511-6. [DOI] [PubMed] [Google Scholar]
- 58.Miyamoto; K, Miyake S, Mizuno M, Oka N, Kusunoki S, Yamamura T. Selective COX-2 inhibitor celecoxib prevents experimental autoimmune encephalomyelitis through COX-2-independent pathway. Brain. 2006;129(Pt 8):1984–1992. doi: 10.1093/brain/awl170. [DOI] [PubMed] [Google Scholar]
- 59.Kusunoki N, Yamazaki R, Kawai S. Induction of apoptosis in rheumatoid synovial fibroblasts by celecoxib, but not by other selective cyclooxygenase 2 inhibitors. Arthritis Rheum. 2002;46(12):3159–3167. doi: 10.1002/art.10692. [DOI] [PubMed] [Google Scholar]
Associated Data
This section collects any data citations, data availability statements, or supplementary materials included in this article.


