

Abstract
This paper describes an approach called ensemble decision aliquot ranking (eDAR) for isolating rare cells from peripheral blood. eDAR has a recovery of over 93% (n=9) with a zero false positive rate (n=8), and provides direct easy access to individual isolated live cells for downstream single-cell manipulation and analysis. We anticipate eDAR will enable new studies of various types of rare cells that circulate in blood.
Keywords: rare cell capture, circulating tumour cell, single cell analysis, cancer, high-throughput analysis
The challenge of isolating rare cells is often a stumbling block for research in circulating tumor cells (CTCs),[1–2] fetal cells in maternal blood,[3] and cancer stem cells.[4–5] A better understanding of these cells is important for progress in personalized medicine.[6–7] Of particular interest is single-cell analysis of CTCs as a marker of cancer metastasis and disease progression.[6, 8] These rare cells are present at such low levels (average of 1–10 CTC/mL)[9] that traditional methods, such as flow cytometry, are inadequate. To address this challenge, a number of approaches have been explored in recent years, such as immuno-magnetic isolation as exemplified by the commercial CellSearch system,[2, 10] cell-size based filtration method,[11–12] antibody-based surface capture in tailored microfluidic devices,[13–16] wide-field optical imaging with fiber-optic array scanning technology (FAST),[17] passive cell sorting,[18] and negative selection approaches.[19] Although these methods represent important advances in this field, much improvement is still needed to isolate CTCs. For example, conditions for immuno-magnetic isolation can be damaging to cells.[2] In other methods, red blood cells (RBCs) are often lysed prior to screening for CTCs in the remaining white blood cells (WBCs), which can cause cell stress. In many approaches, the recovery of CTCs after imaging can also be challenging.[20] Size-based separation methods have certain advantages, but this technique will miss CTCs that are smaller than others.[11, 13] Antibody-based surface capture methods have excellent detection of CTCs in cancer patients. The captured CTCs, however, can be difficult to remove from the surface without cleaving cell-surface proteins (e.g. with Trypsin) and thus potentially stressing the cells. Subsequent imaging of the captured CTCs can also be time consuming, owing to the large area over which images must be taken. Here, we describe an approach that is different from what has been so far explored in this area of research and which we believe offers significant advantages.
Our method is based on positive selection, where cell-surface markers are labeled with fluorescent antibodies, ranked by aliquots, and sorted. We call this process ensemble-decision aliquot ranking (eDAR), because we perform the ranking by looking at an ensemble of cells within each aliquot. In our method, we break down a blood sample into nanoliter aliquots that get rapidly ranked for the presence or absence of CTCs; the ranking helps us to decide which aliquots of cells are worth closer investigation. Our current microfluidic platform can routinely analyze 1 mL of whole blood in 20 minutes with a recovery efficiency of greater than 93% (n=9) and a false positive rate of zero (n=8). Most importantly, this platform enriches CTCs into a small field-of-view (< 1mm2) for microscopic imaging and allows easy isolation of and access to individual live CTCs for further downstream analysis and culture.
eDAR is operationally similar to flow cytometry but with important differences. The throughput of traditional flow cytometry is limited by the sequential analysis of individual cells in a single-file format; the process may take over 24 hours for 1 mL of blood containing 5 billion blood cells.[21] To greatly increase throughput, eDAR probes for rare cells in nanoliter aliquots of blood that each contain thousands of cells. Once the aliquots containing CTCs have been collected, blood cells, especially RBCs, are removed from the CTCs by an on-chip filtration system. eDAR is extremely efficient at enriching rare cells: If there are 5 CTCs in 1 mL of blood, eDAR will discard 99.999% of the blood volume and present a combined 10 nL of blood within a small accessible area (<1 mm2) of the filter. The isolated CTCs can be imaged on the filter or selectively removed for additional single-cell studies.
The first step in eDAR is to generate or define an aliquot. We initially focused on aliquoting blood into droplets;[22–23] Figure 1b shows a continuous stream of aliquots defined by droplets surrounded by an immiscible phase. We had presumed that encapsulation of the cells in a droplet may protect the cells from flow and associated stresses outside of the droplet. We have since found this assumption may be too simplistic because re-circulation flow present within droplets can generate significant hydrodynamic shear stresses on cells.[24] In addition, we found droplets had other disadvantages. First, because droplets were spaced apart by immiscible oils, the throughput was reduced by at least half at a given flow rate through the interrogation region. Second, the generation and stability of the droplet stream was highly sensitive to flow conditions, an unwanted characteristic that compromised the operational robustness of the system. And finally, droplets were incompatible with the on-line filtration that we used to isolate the targeted CTCs from the other blood cells. Rather than creating physically isolated aliquots with droplets, therefore, we pursued the notion of virtual aliquots. Here, each aliquot was defined by a combination of the laser illumination volume, the bin time of the detection system, and the switching time of the solenoid. We found this approach offered the highest throughput and operational robustness. In our current system, 2-nL aliquots were the optimal compromise between detection sensitivity and throughput at a flow rate of 50 μL/min.
Figure 1.

Schematic and images showing the workings of eDAR. (a) Overview of the microfluidic chip. (b) A high-speed camera image of whole blood aliquoted into a continuous stream of droplets surrounded by silicone oil. (c) Laser-induced fluorescence triggers the sorting of an aliquot containing a rare cell (shown in yellow) to the collection microchannel and cell capture chamber. (d) For sorting, the solenoid piston is released to allow flow through the collection channel; images at bottom show the flow of whole blood when the collection channel is closed (left) and opened (right). (e) The collected aliquots are filtered through a membrane to remove blood cells from the target cells and leave the captured cells isolated and accessible for further study. (f) Photograph of an eDAR chip.
Once we defined an aliquot, we ranked the aliquot based on the presence or absence of rare cells (Fig. 1). To detect rare cells in an aliquot, we labeled the cells with fluorescent antibodies against cell-surface markers characteristic of CTCs (Table S1). For breast cancer cells, for example, characteristic cell-surface markers are EpCAM and Her2 (all patients in this study were Her2 positive). Once labeling was complete, we introduced blood into the microfluidic chip at rates up to 80 μL/min. As an aliquot of blood passed through the detection region in the microfluidic channel, a laser illuminated it and excited any fluorescence labels that were present in the aliquot (Fig. 1c). For each aliquot, the resulting fluorescence could be simultaneously collected at several (typically 3) wavelengths using fiber-coupled avalanche photo diodes (APDs) to determine the contents of the aliquot. If the aliquot contained a target cell, the fluorescence emission triggered the sorting of that aliquot into the collection channel. Our system had two lasers at 488 nm and 633 nm for excitation (Fig. 2), and fluorescence was collected through a rectangular confocal aperture and a series of dichroics and filters to fiber-coupled APDs:[25–26] APD1 detected the yellow fluorescence (560–590 nm) from the monoclonal antibody anti-EpCAM labeled with phycoerythrin (PE); APD2 was used as a negative control for the green wavelength range (500–550 nm) to eliminate false positives from broadly emitting fluorescent contaminants; and APD3 detected anti-Her2 labeled with Alexa-647 in the red wavelength band (640–690 nm). A second excitation region using only the 488-nm laser was located immediately after the sorting junction (Fig. 1c); yellow fluorescence (560–590 nm) was collected in this spatially distinct detection region through a separate confocal aperture by APD4. This separate detection region confirmed, in real time, the accurate sorting of the blood aliquot with the target cell. The CTCs were readily detected in the 2-nL aliquots of blood with an average signal-to-noise (S/N) ratio of 32 for the EpCAM marker and 64 for the Her2 marker (Fig. 2c). The S/N ratio was highly dependent on the flow rate of the cells as they went through the detection region as well as the detection bin time (Fig. 2d). With our current system, the maximum flow rate that still allowed for an average S/N above 20 was 133 μL/min.
Figure 2.
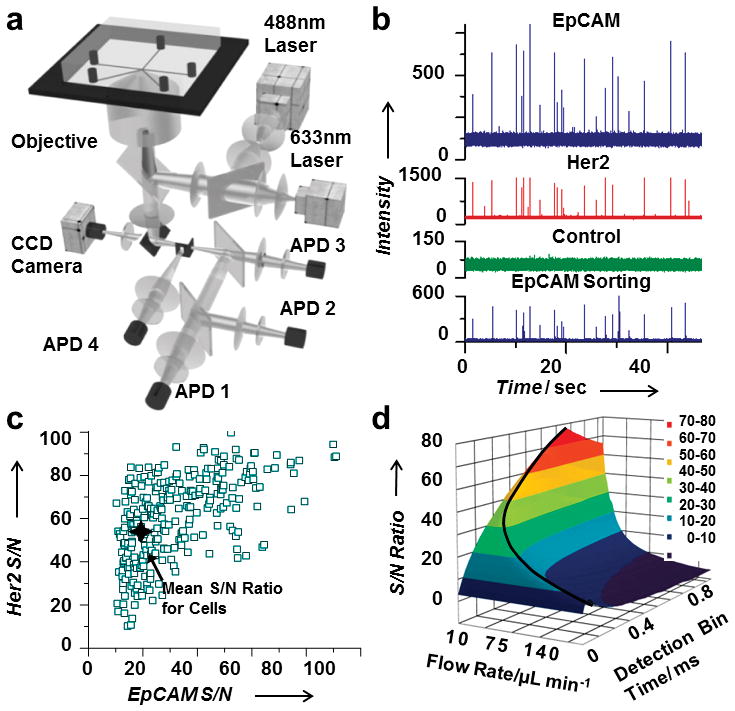
Aliquot detection system. (a) The setup for aliquot detection is comprised of two excitation lasers and four APDs. (b) A segment of the APD trace from clinical sample number 16 showing aliquots positive for the antibody markers EpCAM (top trace) and Her2 (second trace) that were correctly sorted (bottom trace). (c) The S/N ratio for each single cell detected for both antibody labels from clinical sample number 16. (d) S/N ratio for EpCAM-labeled single cells as a function of flow rate and signal bin time. The black curved line shows the optimal parameters with a maximum flow rate of 133 μL/min for a S/N ratio above 20.
For this study, we simply ranked the aliquots as zero (no CTCs) or one (containing CTCs) but we envision more sophisticated rankings will be beneficial in the future, for instance for aliquots with different types of rare cells. In comparison to the antibody-based surface capture of rare cells,[14] aliquot ranking offers more flexible logical operations. For example, we can collect aliquots based on the presence of EpCAM and Her2 and absence of fluorescence in the green channel; in antibody-based surface capture, cells that express either EpCAM or Her2 will be retained. Surface capture can only employ the “OR” logical operation while eDAR can make more complex logic decisions (Fig. S1).
To test sorting efficiency, we spiked cultured breast cancer cells (SKBr-3) into whole blood and labeled them with fluorescent anti-EpCAM antibodies. The blood was introduced into the microfluidic chip with flow rates varying between 10 and 80 μL/min. The sorting efficiency was defined as the number of aliquots triggered to be sorted compared to the number of cells detected as they entered the collection channel (Fig. 3b; Fig. S2 and S3). At slow flow rates (25 μL/min and below), we got 100% sorting efficiency as the entire volume of each aliquot was collected (Fig. 3a). At the fastest flow rate of 80 μL/min, only a portion of each aliquot was captured, resulting in a reduced sorting efficiency of 85%. The loss was caused by the collection channel not being completely open before the aliquot arrived because the solenoids do not have reproducible timing below 2 ms. There are several design improvements that could be made to increase the throughput, including increasing the distance between the detection region and the sorting junction, using a solenoid with sub-millisecond response times, and changing the channel dimensions.
Figure 3.
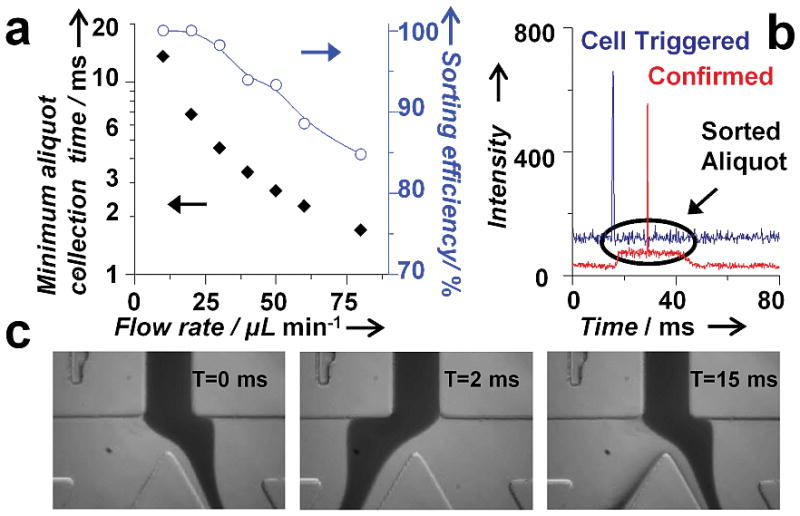
Aliquot sorting efficiency. (a) A plot showing the minimum amount of time required to collect a desired aliquot of blood as a function of flow rate. The collection time was ~ 2.7 ms for 50 μL/min. The plot of sorting efficiency versus flow rate shows highly accurate sorting (up to 100%). (b) Fluorescence trace from a CTC showing the triggering (blue) and successful sorting (red) of an aliquot of blood. (c) High-speed camera images of the sorting junction before and after the release of the solenoid piston that show complete flow switching within 2 ms.
Sorted aliquots flowed to the cell capture chamber where the target cells were retained by a filter. The majority of blood cells, including all RBCs and many small WBCs, passed through the filter (Fig. 1e), which was a track-etched polycarbonate membrane with 5-μm pores that spanned the 1-mm diameter chamber (Fig S4). With such a small volume of blood (e.g. about 10 nL for 5 CTCs) coming into the collection chamber, the capacity of the ~1,000 pores was more than adequate. Captured cells, which clogged the pores once trapped, did not significantly increase the pressure of the system, unlike bulk blood filtration systems where capacity issues are a primary concern.[27] The small size of the filtration chamber allowed for complete full-field imaging. The chamber was open and easily accessible from the top. Additional reagents, such as antibodies against various cellular targets, could be pipetted onto the filter and perfused over the targeted cells. Micropipettes could also be positioned above the filter to remove individual CTCs for analysis or culture.
Our process was optimized to include a minimum of sample preparation steps that didn’t involve lysing of RBCs. The blood processing consisted of labeling with antibodies, dilution with buffer, followed by centrifugation and removal of the supernatant containing the free antibodies (Fig. S5). Recovery experiments were conducted with two breast cancer cell lines, MCF-7 and SKBr-3. For our studies, the number of cells we spiked into blood was counted individually using a capillary cell-spiking method that we previously published.[28] This method allowed us to investigate the recovery rates conveniently for as few as 5 cells rather than the tens to thousands range that is typically reported.
The isolated cells were enumerated in the filtration area using laser excited epi-fluorescence imaging of anti-EpCAM (Fig. 4b) and anti-Her2 (Fig. 4c). From nine separate recovery experiments using a flow rate of 50 μL/min, we determined the average recovery efficiency of the whole system was better than 93% (Fig. 4a). The purity after the sorting step is variable, depending on the amount of WBCs presented in the blood sample, but is in the range of few tens of percent (10–50%). The purity after the entire process of imaging and selection is essentially 100%. This 50 μL/min flow rate was used for the false positive experiments as well as for all the clinical samples.
Figure 4.
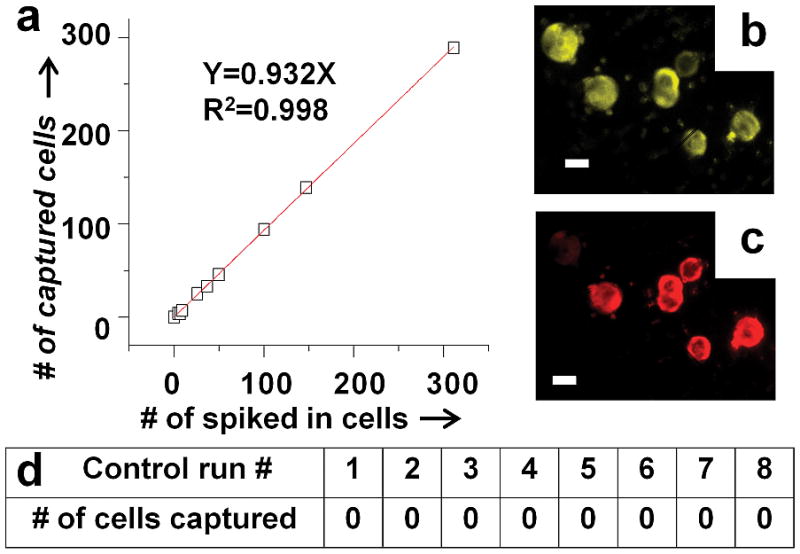
Recovery efficiency for cultured cancer cells spiked into whole blood from healthy donors. (a) The average recovery efficiency for the nine runs is higher than 93%. Fluorescence images of the captured cells on the filtration membrane labelled with (b) anti-EpCAM and (c) anti-Her2. The scale bar is 20 μm. (d) Negative controls showing 8 control runs using healthy donor blood with zero false positives.
Equally important is the potential for false positives. We performed negative control experiments using healthy donor blood. One milliliter of blood was labeled with anti-EpCAM and anti-Her2 antibodies and run through our system using the same protocol as used for the cell-recovery experiments and for processing clinical samples from breast cancer patients. Figure 4d shows the results from eight experiments, all of which found no target cells, yielding a false positive rate of zero.
To better understand the performance of eDAR, we carried out a side-by-side comparison between eDAR and the FDA-approved CellSearch assay using clinical samples. Patients with Stage IV metastatic breast cancer had peripheral blood drawn in an outpatient cancer clinic as a part of their office visit. Multiple tubes of venipunctured blood were collected in each draw. The first tube was not used for cell analysis because of the potential for contamination from epithelial cells during the venipuncture process. Of the remaining tubes, one was drawn into a Veridex CellSave tube for enumeration using the Veridex CellSearch system. A second sample from the same draw was collected in a Vacutainer tube containing K3EDTA and delivered to our laboratory for analysis with eDAR. The samples were run independently: CellSearch was performed by a clinical technologist as part of routine clinical testing, and eDAR was carried out by our lab. The results of the CellSearch analysis were unknown to us until after we had completed the analysis of our samples. This arrangement allowed for a direct head-to-head comparison between the two systems.
For each clinical sample, we processed between 1 and 2 mL of whole blood with a total sample preparation time of 40 minutes (Fig. S5; Table S2). Each sample was run using a new disposable PDMS chip to prevent contamination. Aliquot sorting was triggered by the presence of anti-EpCAM-PE fluorescence. EpCAM was chosen because it is the primary marker used in the CellSearch system. For a 1-mL sample with a flow rate of 50 μL/min, each run took 20 minutes. The captured cells at the end of the run were imaged and analyzed using multi-color epi-fluorescence.
To confirm the presence of anti-EpCAM-PE, images were collected in the yellow wavelength region, 560 to 590 nm, by excitation with a 488-nm laser. To test for anti-Her2-Alexa 647’s presence, images were also collected in the red wavelength region, 650 to 690 nm, using a 633-nm laser. To count the number of CTCs, additional labeling with anti-CD45 and anti-cytokeratin was performed by directly pipetting the reagents onto the cells and washing the cells retained on the filter through the open top of the cell-capture chamber. For this secondary labeling step, the cells were first fixed with paraformaldehyde and permeabilized with a surfactant to allow binding of antibody to cytokeratin. The presence of CTCs was confirmed if they were labeled by anti-EpCAM and anti-cytokeratin but not anti-CD45, which is present on leukocytes. After this secondary labeling, the cells were further labeled with the nuclear stain DRAQ5 to confirm that the cells were intact. Figure 5a shows 3 cells from clinical sample number 16 that were positively labeled with EpCAM, Her2, cytokeratin, and DRAQ5 but were negative with the CD45 antibody.
Figure 5.

Clinical results for CTCs isolated from blood samples drawn from breast cancer patients. (a) Images of three CTCs isolated from clinical sample number 16; scale bar is 20 μm. (b) Images from a CTC labeled with fluorescent antibodies against the breast cancer stem cell marker (CD44+/CD24−). (c) Side-by-side comparison of clinical results from 20 breast cancer patient samples ran with CellSearch and eDAR.
Figure 5c summarizes the results from 20 clinical samples analyzed both by eDAR and CellSearch. The number of CTCs found by eDAR ranged from 11 to 105 for a normalized volume of 7.5 mL, with an average of 45. The CellSearch results from the same patient samples ranged from 0 to 111, with an average of 10. CellSearch found 0 cells in 12 of the patient samples, with only 4 samples containing more than 2 CTCs. eDAR, in comparison, identified CTCs in all samples. The average of 10 CTCs enumerated by CellSearch is skewed by clinical sample 14. If we omit this sample from the analysis, CellSearch detected 0 to 64 CTCs with an average of 5, while eDAR recovered 11 to 105 CTCs with an average of 44 (Table S2). This comparison clearly illustrates the improved sensitivity offered by eDAR.
eDAR affords us the versatility of having the captured cells isolated in a small open area and retained by the filter where multiple analyses can be performed. Captured and labeled CTCs from clinical sample number 23 were first photobleached and then labeled with the stem cell markers anti-CD24-FITC and anti-CD44-Alexa-647 (Fig. 5b). A study has shown that in breast cancer, the cell subpopulation that expresses the cell surface markers CD44+ and CD24−/low exhibits stem-cell characteristics.[5, 29] Using eDAR, we were able to detect the presence of this subset of cells within the isolated CTCs from breast cancer patients.
In conclusion, eDAR represents a different approach than other techniques demonstrated thus far for enumerating rare cells like CTCs. We believe it has the unique capability of recovering individual live CTCs with high efficiency, throughput, and minimal stress; eDAR’s feature of concentrating the isolated rare cells within a small easily assessable area bypasses the long imaging times that plague most other existing techniques and greatly increases its throughput. We believe eDAR will also find use in the isolation of other rare cells besides CTCs.
Supplementary Material
Footnotes
We wish to thank the patients who enabled this research, as well as Roy Olund for constructing the dedicated electronic sorting processor, Gavin Jeffries for help with blood droplet formation, and Gabriele Shuster for arranging patient samples. This work was supported by the Life Sciences Discovery Fund and the National Institutes of Health (R21CA147831).
Supporting information for this article is available on the WWW under http://www.angewandte.org or from the author.
Contributor Information
Perry G. Schiro, Department of Chemistry, University of Washington, Box 351700, Seattle, WA, 98195 (USA), Fax: (+1) 206-685-8665.
Mengxia Zhao, Department of Chemistry, University of Washington, Box 351700, Seattle, WA, 98195 (USA), Fax: (+1) 206-685-8665.
Jason S. Kuo, Department of Chemistry, University of Washington, Box 351700, Seattle, WA, 98195 (USA), Fax: (+1) 206-685-8665
Karen M. Koehler, Department of Laboratory Medicine and Medicine, University of Washington, Seattle, WA, 98195 (USA)
Prof. Daniel E. Sabath, Department of Laboratory Medicine and Medicine, University of Washington, Seattle, WA, 98195 (USA)
Prof. Daniel T. Chiu, Email: chiu@chem.washington.edu, Department of Chemistry, University of Washington, Box 351700, Seattle, WA, 98195 (USA), Fax: (+1) 206-685-8665,
References
- 1.Cristofanilli M, Budd G, Ellis M, Stopeck A, Matera J, Miller M, Reuben J, Doyle G, Allard W, Terstappen L. N Engl J Med. 2004;351:781–791. doi: 10.1056/NEJMoa040766. [DOI] [PubMed] [Google Scholar]
- 2.Allard W, Matera J, Miller M, Repollet M, Connelly M, Rao C, Tibbe A, Uhr J, Terstappen L. Clin Cancer Res. 2004;10:6897–6904. doi: 10.1158/1078-0432.CCR-04-0378. [DOI] [PubMed] [Google Scholar]
- 3.Oudejans CBM, Tjoa ML, Westerman BA, Mulders MAM, Van Wijk IJ, Van Vugt JMG. Prenat Diagn. 2003;23:111–116. doi: 10.1002/pd.539. [DOI] [PubMed] [Google Scholar]
- 4.Al-Hajj M, Wicha MS, Benito-Hernandez A, Morrison SJ, Clarke MF. Proc Natl Acad Sci U S A. 2003;100:3983–3988. doi: 10.1073/pnas.0530291100. [DOI] [PMC free article] [PubMed] [Google Scholar]
- 5.Reya T, Morrison SJ, Clarke MF, Weissman IL. Nature. 2001;414:105–111. doi: 10.1038/35102167. [DOI] [PubMed] [Google Scholar]
- 6.Steeg PS. Nat Med. 2006;12:895–904. doi: 10.1038/nm1469. [DOI] [PubMed] [Google Scholar]
- 7.Bono JSd, Ashworth A. Nature. 2010;467:543–549. doi: 10.1038/nature09339. [DOI] [PubMed] [Google Scholar]
- 8.Alunni-Fabbroni M, Sandri MT. Methods. 2010;50:289–297. doi: 10.1016/j.ymeth.2010.01.027. [DOI] [PubMed] [Google Scholar]
- 9.Zieglschmid V, Hollmann C, Bocher O. Crit Rev Clin Lab Sci. 2005;42:155–196. doi: 10.1080/10408360590913696. [DOI] [PubMed] [Google Scholar]
- 10.Riethdorf S, Mueller V, Zhang L, Rau T, Loibl S, Komor M, Roller M, Huober J, Fehm T, Schrader I, Hilfrich J, Holms F, Tesch H, Eidtmann H, Untch M, von Minckwitz G, Pantel K. Clin Cancer Res. 2010;16:2634–2645. doi: 10.1158/1078-0432.CCR-09-2042. [DOI] [PubMed] [Google Scholar]
- 11.Vona G, Sabile A, Louha M, Sitruk V, Romana S, Schutze K, Capron F, Franco D, Pazzagli M, Vekemans M, Lacour B, Brechot C, Paterlini-Brechot P. Am J Pathol. 2000;156:57–63. doi: 10.1016/S0002-9440(10)64706-2. [DOI] [PMC free article] [PubMed] [Google Scholar]
- 12.Xu T, Lu B, Tai Y, Goldkorn A. Cancer Res. 2010;70:6420–6428. doi: 10.1158/0008-5472.CAN-10-0686. [DOI] [PMC free article] [PubMed] [Google Scholar]
- 13.Kuo JS, Zhao YX, Schiro PG, Ng LY, Lim DSW, Shelby JP, Chiu DT. Lab Chip. 2010;10:837–842. doi: 10.1039/b922301k. [DOI] [PubMed] [Google Scholar]
- 14.Nagrath S, Sequist LV, Maheswaran S, Bell DW, Irimia D, Ulkus L, Smith MR, Kwak EL, Digumarthy S, Muzikansky A, Ryan P, Balis UJ, Tompkins RG, Haber DA, Toner M. Nature. 2007;450:1235–1239. doi: 10.1038/nature06385. [DOI] [PMC free article] [PubMed] [Google Scholar]
- 15.Dharmasiri U, Njoroge SK, Witek MA, Adebiyi MG, Kamande JW, Hupert ML, Barany F, Soper SA. Anal Chem. 2011;83:2301–2309. doi: 10.1021/ac103172y. [DOI] [PMC free article] [PubMed] [Google Scholar]
- 16.Wang ST, Liu K, Liu JA, Yu ZTF, Xu XW, Zhao LB, Lee T, Lee EK, Reiss J, Lee YK, Chung LWK, Huang JT, Rettig M, Seligson D, Duraiswamy KN, Shen CKF, Tseng HR. Angew Chem. 2011;123:3140–3144. [Google Scholar]; Angew Chem Int Ed. 2011;50:3084–3088. doi: 10.1002/anie.201005853. [DOI] [PMC free article] [PubMed] [Google Scholar]
- 17.Krivacic RT, Ladanyi A, Curry DN, Hsieh HB, Kuhn P, Bergsrud DE, Kepros JF, Barbera T, Ho MY, Chen LB, Lerner RA, Bruce RH. Proc Natl Acad Sci U S A. 2004;101:10501–10504. doi: 10.1073/pnas.0404036101. [DOI] [PMC free article] [PubMed] [Google Scholar]
- 18.Adams JD, Thevoz P, Bruus H, Soh HT. Appl Phys Lett. 2009;95 doi: 10.1063/1.3275577. [DOI] [PMC free article] [PubMed] [Google Scholar]
- 19.Balasubramanian P, Yang LY, Lang JC, Jatana KR, Schuller D, Agrawal A, Zborowski M, Chalmers JJ. Mol Pharm. 2009;6:1402–1408. doi: 10.1021/mp9000519. [DOI] [PMC free article] [PubMed] [Google Scholar]
- 20.Hsieh HB, Marrinucci D, Bethel K, Curry DN, Humphrey M, Krivacic RT, Kroener J, Kroener L, Ladanyi A, Lazarus N, Kuhn P, Bruce RH, Nieva J. Biosens Bioelectron. 2006;21:1893–1899. doi: 10.1016/j.bios.2005.12.024. [DOI] [PubMed] [Google Scholar]
- 21.Gross HJ, Verwer B, Houck D, Hoffman RA, Recktenwald D. Proc Natl Acad Sci U S A. 1995;92:537–541. doi: 10.1073/pnas.92.2.537. [DOI] [PMC free article] [PubMed] [Google Scholar]
- 22.He MY, Edgar JS, Jeffries GDM, Lorenz RM, Shelby JP, Chiu DT. Anal Chem. 2005;77:1539–1544. doi: 10.1021/ac0480850. [DOI] [PubMed] [Google Scholar]
- 23.Edgar JS, Milne G, Zhao YQ, Pabbati CP, Lim DSW, Chiu DT. Angew Chem. 2009;121:275–278. [Google Scholar]; Angew Chem Int Ed. 2009;48:2719–2722. [Google Scholar]
- 24.Schneider T, Burnham D, Yen G, Huynh L, Chiu DT. 2011 Submitted. [Google Scholar]
- 25.Schiro PG, Kuyper CL, Chiu DT. Electrophoresis. 2007;28:2430–2438. doi: 10.1002/elps.200600730. [DOI] [PubMed] [Google Scholar]
- 26.Jeffries GDM, Lorenz RM, Chiu DT. Anal Chem. 2010;82:9948–9954. doi: 10.1021/ac102173m. [DOI] [PMC free article] [PubMed] [Google Scholar]
- 27.Zheng S, Lin H, Liu JQ, Balic M, Datar R, Cote RJ, Tai YC. J Chromatogr A. 2007;1162:154–161. doi: 10.1016/j.chroma.2007.05.064. [DOI] [PubMed] [Google Scholar]
- 28.Zhao Y, Schiro PG, Kuo J, Ng L, Chiu DT. Anal Chem. 2008;81:1285–1290. doi: 10.1021/ac802250d. [DOI] [PubMed] [Google Scholar]
- 29.Ponti D, Costa A, Zaffaroni N, Pratesi G, Petrangolini G, Coradini D, Pilotti S, Pierotti MA, Daidone MG. Cancer Res. 2005;65:5506–5511. doi: 10.1158/0008-5472.CAN-05-0626. [DOI] [PubMed] [Google Scholar]
Associated Data
This section collects any data citations, data availability statements, or supplementary materials included in this article.