

Abstract
OBJECTIVES
The purpose of this study was to investigate the effect of vocal fold adduction on voice quality in an ex vivo larynx model.
STUDY DESIGN
Prospective, repeated-measures experiments.
METHODS
Ten excised canine larynges were mounted on an excised larynx phonation system and measurements were recorded for three different vocal fold adduction levels. Acoustic perturbation measurements of jitter, shimmer, and signal-to-noise ratio (SNR) were calculated from recorded radiated sound histories.
RESULTS
Ex vivo experiments indicated that statistically significant increases in the means of jitter (p=0.005), shimmer (p=0.002), and SNR (p=0.011) measures decreased with respect to vocal fold adduction as the independent variable. Theoretical results showed that the DC and AC component of glottal area increased monotonically with prephonatory glottal area.
CONCLUSIONS
Acoustic perturbation increased with the degree of vocal fold abduction. Ex vivo larynx measurements suggested that a hyperadducted state may be acoustically best. This may be explained theoretically by an increase in DC/AC ratio as the prephonatory area is increased.
INTRODUCTION
It has been known that the degree of vocal fold adduction is correlated to the perceptual quality of phonation. The anatomical continuum ranging from vocal fold hyperadduction to vocal fold hypoadduction is well correlated to the perceptual continuum ranging from “pressed” voice to “breathy” voice [1–3]. Between these two extrema, a “normal” perceptual quality corresponds to an anatomical configuration characterized by barely adducted vocal folds. The degree of adduction can be quantified by many measures, including vocal process gap [4], abduction quotient [1], visuo-perceptual rating [5], and electroglottographic closed quotient [5]. For example, Scherer et al. measured the abduction quotient, defined as the ratio of half the distance between the vocal fold processes to the amplitude of vocal fold vibration, in a 36 year old male who phonated with three voice qualities (breathy, normal, and pressed) at three different pitch and loudness levels [1]. Statistically significant differences were observed between the abduction quotient in breathy, normal, and pressed voices.
Pathologies such as adductor spasmodic dysphonia and vocal fold paralysis adversely affect how vocal fold approximation is achieved, and in turn affect the perceptual quality of phonation; in the former, vocal fold hyperadduction produces speech that is strained, harsh, and often unintelligible [6], while in the latter, vocal fold hypoadduction or abduction produces speech that is breathy, weak, and difficult to hear at a distance [7]. Treatments for disorders characterized by aberrant vocal fold adduction frequently use acoustic perturbation measures to evaluate outcome [8]. Many different objective parameters of the acoustic waveform are used to quantify the subjective perception of phonation, such as shimmer, defined as the cycle-to-cycle variability in acoustic amplitude, and jitter, defined as the cycle-to-cycle variability in acoustic frequency. Another indicator of acoustic quality is the signal-to-noise ratio (SNR), which when calculated from a voice signal is a ratio of the root mean square of the periodic components of the radiated sound pressure (i.e., the phonation signal) to the root mean square of the non-periodic components (i.e., phonatory and environmental noise). If the data are collected in a sound-proof environment, then no noise is present in the acoustic signal, and the SNR reflects the power of the periodic to the power of the non-periodic signals in the source.
The causal link between vocal fold adduction and acoustic quality is due in part to the characteristics of the glottal airflow and glottal area waveforms. The voice source causes a time-varying combination of air pressure compressions and rarefactions, driven by the energy of respiratory exhalation causing self-sustained oscillations of the vocal folds. The glottal area waveform can be decomposed into a static or direct current (DC) component and an oscillatory or alternating current (AC) component. The AC component is due to the physical oscillation of the vocal fold tissues, and is the component responsible for producing the pulsatile airflow: voice [9]. The DC component is due to a baseline conductance of airflow through the glottis. The energy expended by the respiratory system through a nonzero DC component of glottal area and thus glottal flow is functionally lost, because this energy is not converted into acoustic energy. Previous theoretical investigations of the energy balance have shown that at a moving point along the glottis, the airflow is separating to become a turbulent jet [10–12]. Aside from the lost energy, excessive DC glottal airflow has been associated with a higher degree of turbulence noise and the perception of a “breathy” voice [9]. Theoretical studies have suggested that at constant subglottal pressure, the turbulence noise generated at the glottis is proportional to the square root of the average glottal area, which is directly proportional to the DC glottal area [13]. Other power laws have been proposed, such as that by Zhang et al. [14] and Zhang and Mongeau [15], who found that the sound power radiated from stationary glottal jets increases proportional to U6A2, where A is the orifice (or in this case glottal) area and U is the jet centerline velocity. The vocal efficiency index proposed by Isshiki [16], calculated as the AC/DC glottal flow ratio, represents one facet of the efficiency of the larynx as an aerodynamic-to-acoustic energy transducer. As less relative energy is lost to the DC component and more relative energy is transferred to the AC component, the AC/DC ratio increases, and the transduction efficiency is greater. Because of its utility in reflecting vocal function, the vocal efficiency index has been used to evaluate clinical outcomes, typically along with a set of other parameters [17].
The present study investigated the role of vocal fold adduction in the acoustic quality of phonation. This phenomenon was investigated in a sample population of ten excised canine larynges. Measures of jitter, shimmer, and SNR were calculated from phonation samples of the sample population under three vocal fold conditions: hyperadduction, normal adduction, and abduction. Theoretical analysis using a modified two-mass model suggested that increased vocal fold abduction yields a higher DC/AC ratio and higher frequency of acoustic perturbations.
THEORETICAL BACKGROUND
Multi-mass models have been used extensively to produce and explore voice production [11, 18–22]. Theoretical predictions from low-order models have been validated against experimental data, demonstrating their relevance [12]. A two-mass model based on the work of Ishizaka and Flanagan [23] was used to investigate the influence of pre-phonatory glottal width. Two dynamic equations were used to model vocal fold oscillation:
| (1) |
| (2) |
where Bi (i={1, 2}) is the damping constant, Ki is the spring constant, Ti is the thickness of mass Mi, L is the vocal fold length, and Kc is the spring constant of the coupling spring. The impact forces resulting from vocal fold collision were modeled by, using
| (3) |
| (4) |
where ai is the glottal area at the inferior (i=1) or superior (i=2) vocal fold margin, and ci = 3ki is the additional spring constant during vocal fold collision. The inferior and superior glottal areas were expressed as a1= a01+ 2x1L and a2= a02+ 2x2L, where a0i is the prephonatory glottal area. The intraglottal pressure, following Bernoulli’s equation, was:
| (4) |
where Ps is the subglottal pressure and aglottal is the minimum glottal area, such that
| (5) |
The function Θ(x) describing the collision force was approximated by:
| (6) |
Note that this two-mass model ignores the influence of flow separation. For a typical vocal fold, the following default parameter values were used: M1 = 0.125, M2 = 0.025, B1 = B2 = 0.02, K1 = 0.08, K2 = 0.008, Kc = 0.025, T1 = 0.25, T2 = 0.05, and L = 1.4. These parameters are within physiologic ranges and have been reported previously [23]. All parameters are given in units of cm, g, ms and their corresponding combinations. The prephonatory glottal width was determined from the vocal fold length and the specified prephonatory glottal area. Six prephonatory glottal areas were used between 0 cm2 and 0.05 cm2, with intervals of 0.01 cm2. The above model was solved numerically using a fourth-order Runge-Kutta method with a time step of 0.01 ms.
Figure 1(a) depicts the DC and AC components of glottal area as a function of the prephonatory glottal area. The DC and AC components of the glottal area increase monotonically with prephonatory glottal area. Because their slopes differ the DC/AC ratio increases monotonically with prephonatory glottal area. As drawn in Figure 1(b), the DC/AC ratio also decreases as the prephonatory glottal area decreases. The AC component is presumably related to regular vocal fold vibration. The DC component is related to inefficient phonation and increased turbulence noise. As the prephonatory glottal area decreases, vibrational abnormalities become less frequent, causing a decrease in acoustic perturbation measures such as jitter and shimmer. As the AC component becomes larger relative to the DC component, it is likely that the power of the acoustic signal of phonation will become larger with respect to the power of the acoustic signal of the background noise. Accordingly, the SNR would increase.
Figure 1.


(a) DC and AC components of glottal area as a function of the prephonatory glottal area. (b) DC/AC glottal area ratio as a function of the prephonatory glottal area.
INVESTIGATION IN EX VIVO CANINE LARYNGES
Methods
Ten excised canine larynges were harvested immediately postmortem and quickly frozen in a 0.9% saline solution. Data on the vocal fold length of the sample population are presented in Table II. Exclusion criteria included any evidence of injury to or abnormality of the vocal fold mucosa or laryngeal framework. Specimens were stored deep frozen until use, upon which time they were slowly thawed in cold water.
Table II.
Vocal fold lengths of the canine larynges in the sample population.
| Larynx | VF Length (mm) |
|---|---|
| 1 | 11.34 |
| 2 | 14.31 |
| 3 | 10.86 |
| 4 | 13.46 |
| 5 | 16.47 |
| 6 | 18.59 |
| 7 | 12.9 |
| 8 | 15.4 |
| 9 | 12.03 |
| 10 | 13.34 |
Immediately before use, the tissues and cartilages superior to the vocal folds and arytenoids were dissected from the specimen. The larynx was mounted on an excised larynx phonation system, as presented by Jiang and Titze [24], using a metal pull clamp. Three-pronged bilateral micromanipulators were inserted into the lateral faces of the arytenoids for precise three-dimensional control of vocal fold configuration. The degree of vocal fold adduction was quantified in the experimental setting using the adduction index, β, defined as
| (8) |
where X0 is the prephonatory posterior glottal width, T0 is the prephonatory inter-vocal fold contact thickness, AIFVC is the prephonatory inter-vocal fold contact area, and L0 is the vocal fold length. This scalar continuum quantifies both hyperadduction in which the inter-vocal fold contact area changes but the vocal process gap is always zero and abduction in which the inter-vocal fold contact area is zero but the vocal process gap changes. Three configurations of vocal fold adduction were applied to all larynges: (1) hyperadduction, in which the vocal folds were tightly approximated and strained (β=1 mm); (2) normal adduction, in which the vocal folds were just barely adducted (β=0 mm); and (3) abduction, in which the vocal folds were abducted using a 1 mm interarytenoid shim (β=−1 mm). The hyperadduction condition was verified by using digital calipers to measure the vocal fold contact length in the superior-inferior axis (T0) in accordance with Eq. 8. The present study followed a repeated-measures study design. This type of experimental design eliminates inter-subject variability, and because data were collected in a controlled setting with only vocal fold adduction changing, the influence of this variable alone was investigated. An anterior micromanipulator was sutured to the laryngeal prominence of the thyroid cartilage for precise control of vocal fold elongation, which was held constant throughout experimentation.
The excised larynx phonation system, depicted in Figure 2, was designed to simulate the respiratory system. Pressurized airflow from an internal building source was passed through two Concha Therm III humidifiers (Fisher & Paykel Healthcare Inc., Laguna Hills, CA) in series to humidify and heat the air. Airflow was measured using an Omega airflow meter (model FMA-1601A; Omega Engineering Inc., Stamford, CT), and was controlled by a manual valve. Pressure was measured directly below the larynx using a Heise digital pressure meter (901 series; Ashcroft Inc., Stratford, CT). Sound pressure was recorded by a Sony microphone (model ECM-88; Sony Electronics Inc., New York, NY). The microphone was positioned at a 45° angle to the plane of the glottis and approximately 10.0 cm from the glottis. The acoustic signal was amplified using a Symetrix pre-amplifier (model 302; Symetrix Inc., Mountlake Terrace, WA). A National Instruments data acquisition board (model AT-MIO-16; National Instruments Corp., Austin, TX) acquired the digital signals and customized LabVIEW 8.2.1 software (National Instruments Corp., Austin, TX) recorded the airflow, pressure, and acoustic data simultaneously on a personal computer at a sampling frequency of 40 kHz. All trials were conducted in a triple-walled, sound-attenuated room to reduce background noise and stabilize humidity levels and temperatures.
Figure 2.

The excised larynx phonation system. Pressurized airflow from a building source (A) was routed through a manometer (B) and two heater-humidifiers in series (C). A pseudolung (D) below the larynx (E, not shown) simulates the volumetric and capacitive characteristics of human lungs. An anterior micromanipulator (F) precisely controlled vocal fold elongation and lateral micromanipulators (G) controlled arytenoid adduction. A microphone (H) and digital pre-amplifier (I) recorded acoustics while a pneumotachometer (J) recorded air pressure. A digital camera (K) was used to document larynx position.
Data were collected from each larynx under three arytenoid configurations (abduction, normal adduction, and hyperadduction) and three subglottal pressure (Ps) (15, 20, and 25 cm H2O). Figure 3 illustrates the vocal folds under these arytenoid conditions. For a given larynx and arytenoid configuration, airflow was increased until the Ps reached the target value. The Ps was held constant for approximately ten seconds to record an adequate amount of data, and then airflow was rapidly decreased to zero. Larynges were allowed to rest for approximately 60 seconds between each trial. During this time, 0.9% saline solution was applied liberally to the vocal folds and laryngeal framework. Data tokens consisted of a one-second acoustic sample of the phonation selected from the recorded data retrospectively. The present experiment had a 32 factorial design, where three ordinal levels exist within two factors which were the independent variables of vocal fold adduction and Ps. Thus, nine unique independent experimental conditions existed for each larynx in the sample population. Four measurements were extracted per token: mean Ps, jitter, shimmer, and SNR. Acoustic perturbation measures were calculated using CSpeech software, version 4.0 (Milenkovic and Read, Madison, WI). Ten replicates were recorded for each larynx and each experimental condition.
Figure 3.
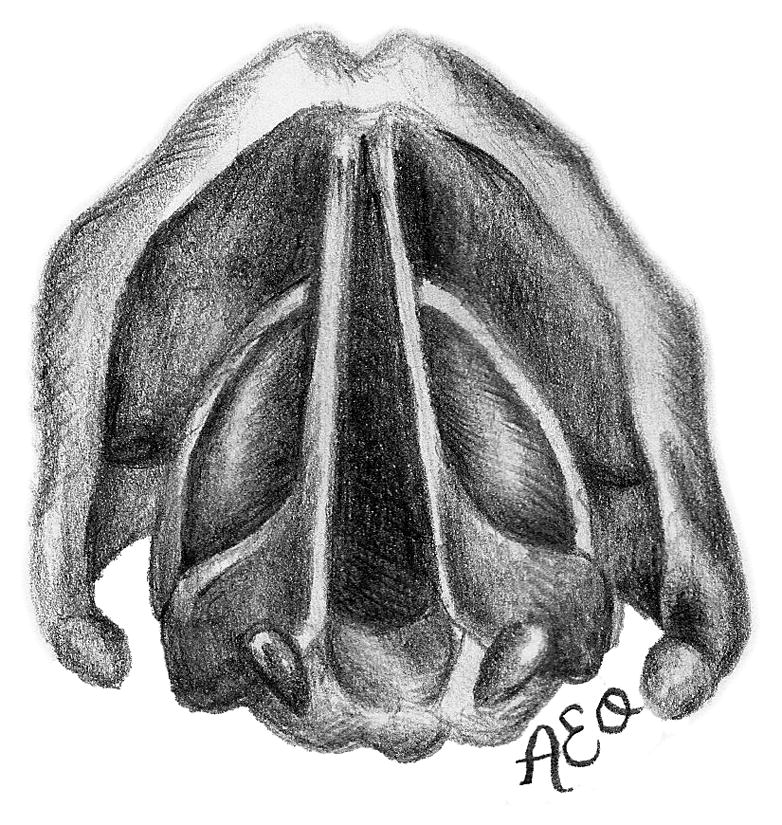
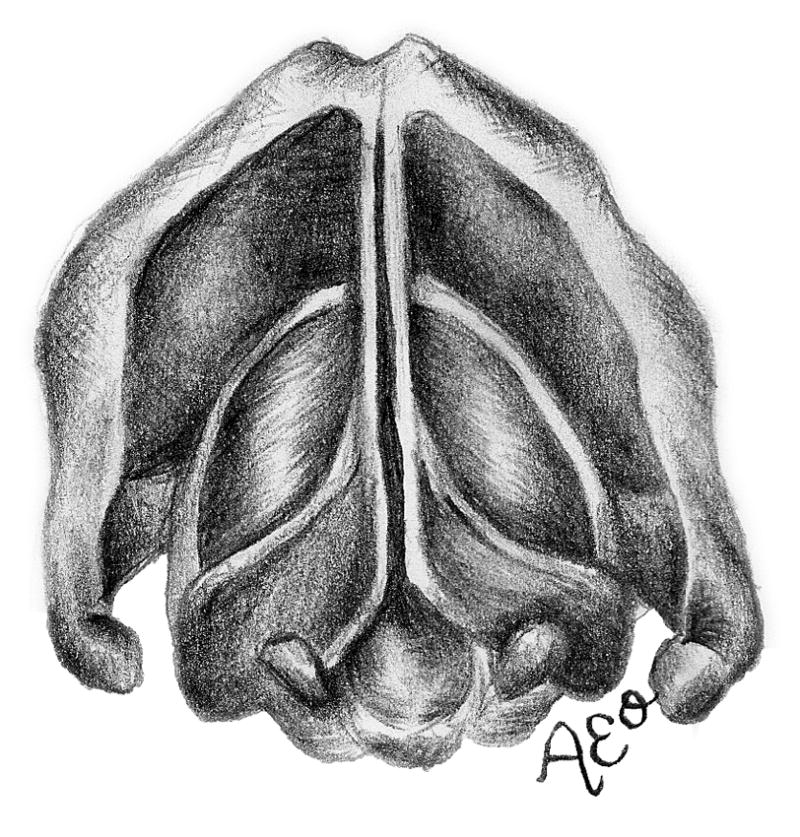
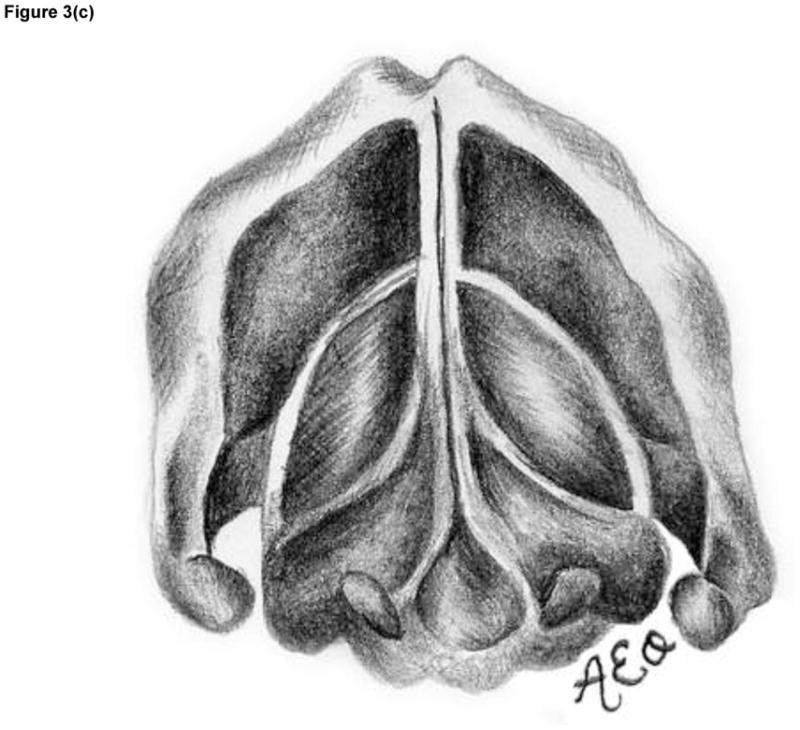

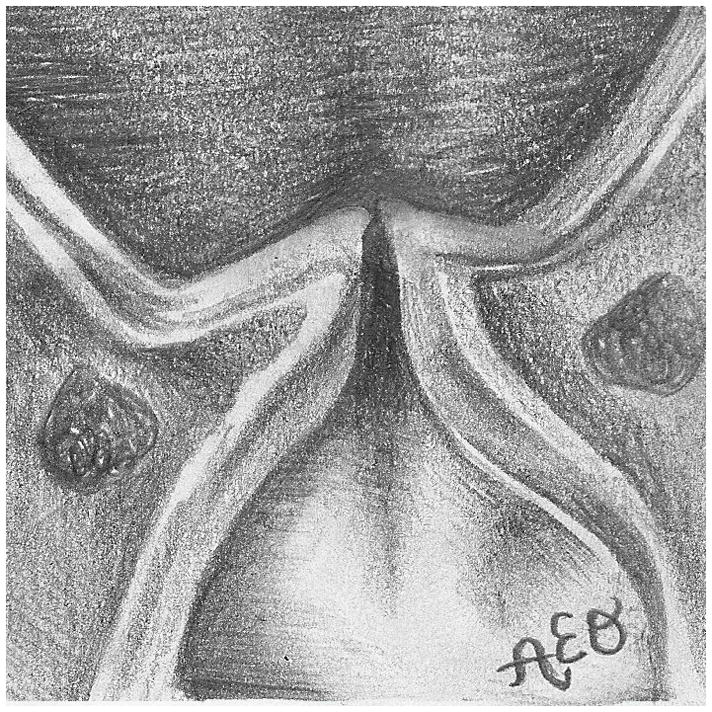
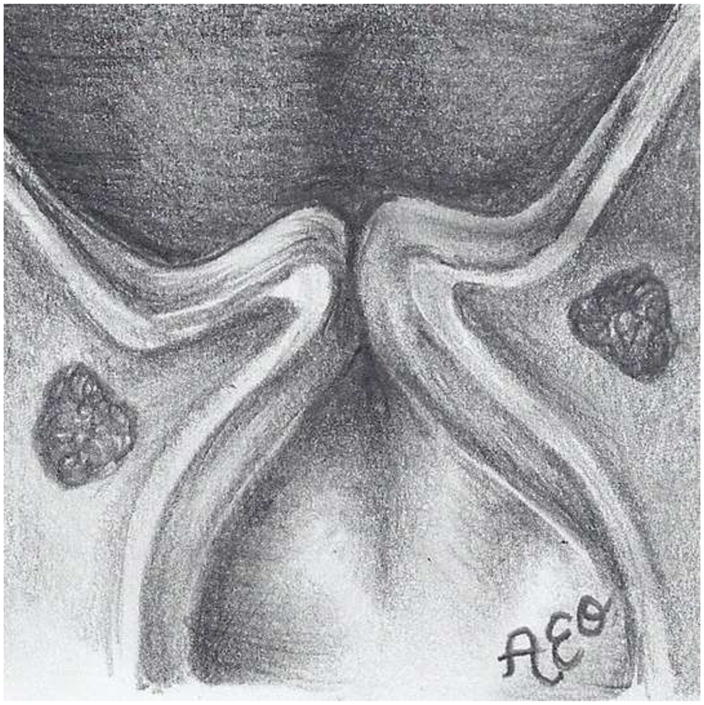
The three prephonatory glottal configurations used in the ex vivo laryngeal experiments. Illustrated (not to scale) are the abducted arytenoids configuration from (a) superior and (d) coronal views, the adducted arytenoids configuration from (b) superior and (e) coronal views, and the hyperadducted arytenoids configuration from (c) superior and (f) coronal views.
The present study followed a prospective, repeated-measures experimental design. This type of experimental design eliminated inter-subject variability because measures were recorded from different treatments in the same specimen. Because data were collected in a controlled setting with only vocal fold adduction changing, the influence of this variable alone was causally investigated.
To determine if the degree of arytenoid adduction affected jitter, shimmer, and SNR, one-way repeated measures ANOVA tests were performed on each variable with respect to adduction and Ps. If any set of data did not satisfy the normality criterion for this test, a one-way repeated measures ANOVA on ranks was used instead on the given set of data. SigmaPlot 11.0 software (Systat Software, Inc., San Jose, CA) was used to statistically analyze the data and produce graphs. To determine if there was a statistically significant difference between the perturbation variables due to an interaction between vocal fold adduction and Ps, two-way repeated measures ANOVA tests of jitter, shimmer, and SNR data were each conducted with respect to arytenoid adduction and Ps. To summarize, for each parameter we performed (1) a one-way ANOVA to investigate the sole effect of vocal fold adduction, (2) a one-way ANOVA to investigate the sole effect of subglottal pressure, and (3) a two-way ANOVA to investigate the effect of the interaction between vocal fold adduction and subglottal pressure. Each of these three tests were performed on the three sets of observed data: shimmer, jitter, and SNR. Thus, nine statistical tests were conducted.
Results
The mean transglottal flows for each subglottal pressure group and within each vocal fold adduction condition are depicted in Figure 4. The true mean subglottal pressures for each group were 14.93±0.15 cm H2O, 20.01±0.24 cm H2O, and 24.94±0.24 cm H2O. The mean laryngeal flow resistances for the abducted, adducted, and hyperadducted states were 0.023±0.0086, 0.030±0.013, and 0.033±0.014 cm H2O•s/mL. The jitter, shimmer, and SNR data from the sample population are presented in Figure 5. No statistically significant differences were found across replicates (p<0.001, one-way repeated measures analysis of variance), indicating that the measurements were reliable. One-way repeated measures ANOVA suggested that statistically significant differences exist between the means of jitter (p=0.005), shimmer (p=0.002), and SNR (p=0.011) measures with respect to vocal fold adduction as the independent variable. Power analyses indicated that the sample sizes were sufficient for all measurements. Pair-wise comparisons were made using the Holm-Sidak method, such that the rejection criterion of the ith hypothesis in a series of n hypotheses ordered from smallest p-value to largest p-value is
Figure 4.


Mean transglottal flows during phonation with differing vocal fold adduction configurations under target subglottal pressures of (a) 15 cm H2O, (b) 20 cm H2O, and (c) 25 cm H2O. The true mean subglottal pressures for each group were 14.93±0.15 cm H2O, 20.01±0.24 cm H2O, and 24.94±0.24 cm H2O. The upper and lower edges of the box represent the 75th and 25th percentile, respectively, and a line within each box marks the median transglottal flow for the given adduction level. Whiskers above and below each box represent the 90th and 10th percentiles, respectively. Statistical outliers are graphed as points.
Figure 5.
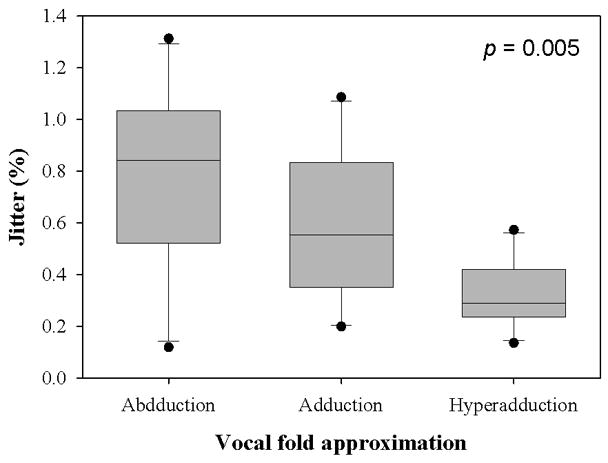
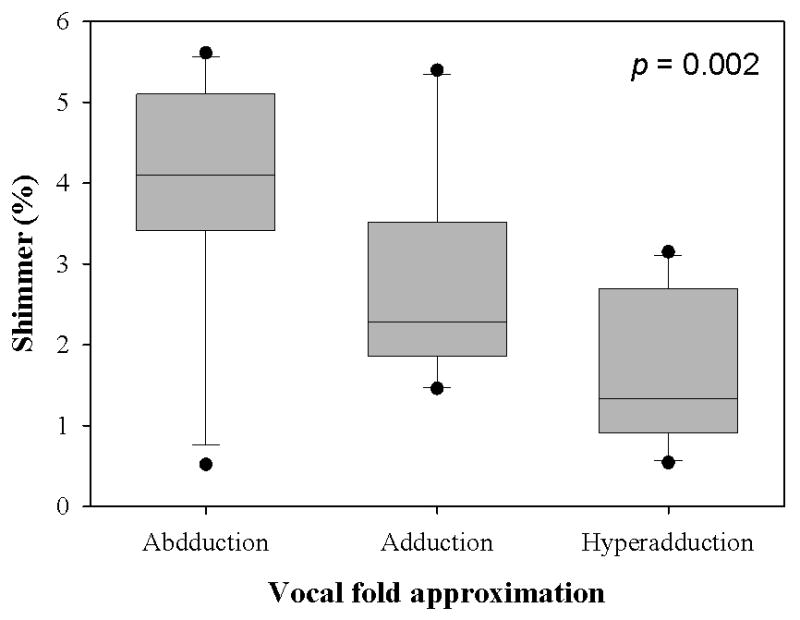
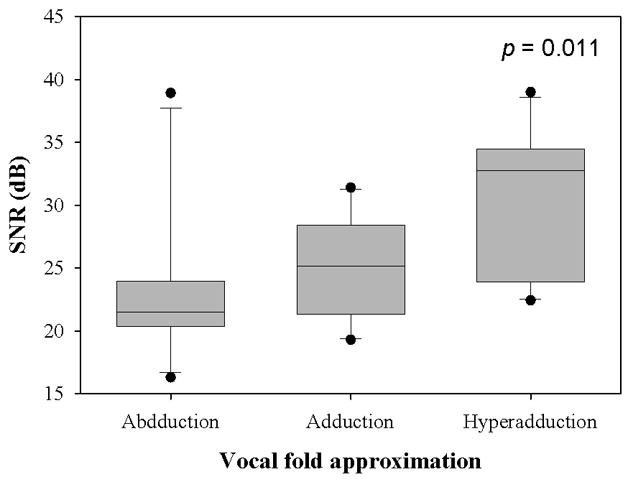
(a) Jitter, (b) Shimmer, and (c) SNR data from the sample population. The upper and lower edges of the box represent the 75th and 25th percentile, respectively, and a line within each box marks the median measurement value for the given vocal fold adduction level. Whiskers above and below each box represent the 90th and 10th percentiles, respectively. Statistical outliers are graphed as points. The results of one-way repeated measures ANOVA are indicated in the upper right corner.
| (9) |
where aT is the overall significance level. Table III presents the pair-wise comparisons for the three perturbation measures.
Table III.
Pair-wise comparisons among perturbation measures using the Sidak-Holm method. Asterisks after the p-value indicate statistical significance.
| Measure | Pairwise comparison | Critical level | p-value |
|---|---|---|---|
| Jitter (%) | Hyperadduction v. abduction | 0.017 | 0.001* |
| Hyperadduction v. normal adduction | 0.025 | 0.042 | |
| Abduction v. normal adduction | 0.050 | 0.132 | |
|
| |||
| Shimmer (%) | Hyperadduction v. abduction | 0.017 | <0.001* |
| Hyperadduction v. normal adduction | 0.025 | 0.051 | |
| Abduction v. normal adduction | 0.050 | 0.051 | |
|
| |||
| SNR (dB) | Hyperadduction v. abduction | 0.017 | 0.004* |
| Hyperadduction v. normal adduction | 0.025 | 0.024* | |
| Abduction v. normal adduction | 0.050 | 0.407 | |
A one-way repeated measures ANOVA on jitter (p=0.532) and SNR (p=0.241) with respect to Ps and a one-way repeated measures ANOVA on ranks on shimmer (p=0.670) data with respect to Ps suggested that Ps did not exert a statistically significant influence on these measures of acoustic perturbation. A one-way repeated measures ANOVA on ranks was performed on the shimmer data due to heteroscedasticity. Two-way repeated measures ANOVAs performed on the jitter, shimmer, and SNR data each as a function of vocal fold adduction and Ps indicated that the interaction between these two independent variables was not statistically significant (p=0.621, p=0.618, and p=0.247, respectively).
These significance tests suggest that statistically significant differences exist between the means of these perturbation variables in each vocal fold adduction group, and that these differences are most likely due to the vocal fold adduction alone.
DISCUSSION
The theoretical model provides one possible scientific explanation for the experimental observations; namely, that as the degree of adduction is increased, the DC/AC ratio decreases and the power of phonation is thus larger compared to the power of the background noise. Simply stated, as adduction is increased, the acoustic signal is clearer and more regular. The present study suggested that hyperadducted vocal folds (β>0), those which have a positive inter-vocal fold contact area, offer the best quality of phonation. A hyperadduction condition of this kind minimizes the acoustic perturbation measures of jitter and shimmer and maximizes SNR. This conclusion agrees well with those of Scherer et al. [1], who measured the abduction quotient in various phonation modes and found that normal phonation was characterized by a negative abduction quotient (−0.20 ± 0.37). Our results expand upon these previous results, indicating that the glottal flow waveform becomes more regular as vocal fold adduction is increased.
Many studies have investigated the relationship between vocal fold adduction and the acoustic quality of the phonation produced under such conditions. Previous research has elucidated the problem from an inductive reasoning standpoint: the independent variable was the speaking mode or quality produced by subjects, and the vocal fold adduction was measured as the dependent variable. Scherer et al. used this approach in measuring the abduction quotient in various voice modes [1], and Verdolini et al. used this approach in measuring the visuo-perceptual ordinal rating of adduction and closed quotient from an electroglottographic signal in various phonation modes [5]. In the present study, the causal relationship was investigated from a deductive approach by controlling vocal fold adduction as the independent variable and parameters quantifying the quality of phonation were dependent variables. While the acoustic measures of jitter, shimmer, and SNR were found to be sensitive to vocal fold adduction, these measurements were not found to be significantly sensitive to Ps.
The implications of the current study are limited to the voice source; that is, these conclusions are applicable to the raw acoustic signal that is produced by vocal fold oscillation. It should be recognized that the supraglottal structures and articulators play an important role in modulating the voice source, and that the acoustic quality is a function of these variables as well. Nevertheless, this research is valuable in exploring the underlying physics of phonation and may be clinically useful. Acoustic measurements are valuable in assessing clinical outcomes; for example, the outcomes of arytenoid adduction and type I thyroplasty procedures have been assessed using acoustic measurements [25, 26]. A robust understanding of the relationship between vocal fold adduction and acoustic quality could aid clinicians in pre-surgically indicating the likely degree of surgical intervention required. Indeed, clinicians use acoustic measurements as a quantitative adjunctive measure to their perceptual assessment of a patient’s voices. The results of this study suggest that vocal fold adduction is acoustically optimal with a positive adduction index.
Adequate vocal fold adduction, essential for proper voicing, may be affected by many laryngeal pathologies. For example, vocal fold adduction in Parkinson’s disease is weak and the vocal folds are weak and bowed due to muscle atrophy [Woodson 2008]. Injection laryngoplasty is one of the recommended treatments, in which collagen, lyophilized dermis, or fat are injected into the vocal fold to supplement vocal fold adduction. Another example of inadequate adduction is unilateral recurrent laryngeal nerve (RLN) paralysis. This nerve is particularly vulnerable to trauma, since it courses inferiorly from the jugular foramen of the cranium and recurs around the aortic arch on the left and the right subclavian on the right before ascending to innervate the larynx. Unilateral RLN paralysis results in an abnormally abducted vocal fold and inadequate glottal closure. The effects of unilateral RLN paralysis on acoustic and perceptual quality of voice are significant. Treatments include injection laryngoplasty, medialization, and arytenoid adduction. Surgeons using treatments to adduct the vocal folds in cases of glottal insufficiency need to consider the degree of adduction necessary to provide sufficient acoustic quality. However, while acoustic quality is valuable, the utility of acoustic quality improvements must be optimized in terms of effort and ease of phonation. Clinicians must precisely balance the benefits of a better acoustic quality with the associated aerodynamic costs.
Future studies should explore the physical dynamics of phonation from the perspective of vocal fold adduction as an independent variable; a rigorous theoretical understanding of the effects of vocal fold adduction on the aerodynamic inputs and acoustic outputs of the vocal system as a whole is needed. The adduction index continuum should be quantified in terms of aerodynamic, acoustic, and mucosal wave properties to further elucidate the physical mechanisms responsible for determining voice source quality.
CONCLUSION
The present study investigated the causal relationship between vocal fold adduction and the acoustic quality of phonation. Statistically significant differences existed between the means of jitter, shimmer, and SNR in excised canine larynges under various adduction conditions. The results indicate that vocal folds with a positive adduction index, or slightly hyperadducted, are best suited for acoustic quality. This observation is consistent with modeling results showing an increase in DC/AC ratio with increased glottal abduction. These results are important in elucidating the role of arytenoid adduction in the production of voice and may be clinically important in finding the acoustically optimal configuration for phonation. More research is needed to investigate the complex interactions between vocal fold adduction and acoustic quality.
Table I.
Values of the parameters used in the two-mass model.
| Parameter | Value |
|---|---|
| M1 | 0.125 |
| M2 | 0.025 |
| B1, B2 | 0.02 |
| K1 | 0.08 |
| K2 | 0.008 |
| Kc | 0.025 |
| T1 | 0.25 |
| T2 | 0.05 |
| L | 1.4 |
Footnotes
Publisher's Disclaimer: This is a PDF file of an unedited manuscript that has been accepted for publication. As a service to our customers we are providing this early version of the manuscript. The manuscript will undergo copyediting, typesetting, and review of the resulting proof before it is published in its final citable form. Please note that during the production process errors may be discovered which could affect the content, and all legal disclaimers that apply to the journal pertain.
References
- 1.Scherer RC, Titze IR. The abduction quotient related to voice quality. Journal of Voice. 1987;1:246–251. [Google Scholar]
- 2.Grillo EU, Verdolini K. Evidence for distinguishing pressed, normal, resonant, and breathy voice qualities by laryngeal resistance and vocal efficiency in vocally trained subjects. J Voice. 2008;22:546–552. doi: 10.1016/j.jvoice.2006.12.008. [DOI] [PubMed] [Google Scholar]
- 3.Berry DA, Verdolini K, Montequin DW, Hess MM, Chan RW, Titze IR. A quantitative output-cost ratio in voice production. J Speech Lang Hear Res. 2001;44:29–37. doi: 10.1044/1092-4388(2001/003). [DOI] [PubMed] [Google Scholar]
- 4.Alipour F, Scherer R, Finnegan E. Pressure-flow relationships during phonation as afunction of adduction. Journal of Voice. 1997;11:187–194. doi: 10.1016/s0892-1997(97)80077-x. [DOI] [PubMed] [Google Scholar]
- 5.Verdolini K, Druker DG, Palmer PM, Samawi H. Laryngeal adduction in resonant voice. J Voice. 1998;12:315–327. doi: 10.1016/s0892-1997(98)80021-0. [DOI] [PubMed] [Google Scholar]
- 6.Aminoff MJ, Dedo HH, Izdebski K. Clinical aspects of spasmodic dysphonia. J Neurol Neurosurg Psychiatry. 1978;41:361–365. doi: 10.1136/jnnp.41.4.361. [DOI] [PMC free article] [PubMed] [Google Scholar]
- 7.Sataloff RT. Professional voice: The science and art of clinical care. 2. San Diego: Singular Pub. Group; 1997. [Google Scholar]
- 8.Sridhara SR, Ashok KG, Raghunathan M, Mann SB. To study voice quality before and after thyroplasty type 1 in patients with symptomatic unilateral vocal cord paralysis. Am J Otolaryngol. 2003;24:361–365. doi: 10.1016/s0196-0709(03)00068-1. [DOI] [PubMed] [Google Scholar]
- 9.Baken RJ, Orlikoff RF. Clinical measurement of speech and voice. San Diego, CA: Singular Publishing Group; 2000. [Google Scholar]
- 10.Pelorson X, Hirschberg A, Van Hassel R, Wijnands A, Auregan Y. Theoretical and experimental study of quasisteady flow separation within the glottis during phonation. Application to a modified two mass model. The Journal of the Acoustical Society of America. 1994;96:3416. [Google Scholar]
- 11.Lous N, Hofmans G, Veldhuis R, Hirschberg A. A symmetrical two-mass vocal-fold model coupled to vocal tract and trachea, with application to prosthesis design. Acustica. 1998;84:1135–1150. [Google Scholar]
- 12.Ruty N, Pelorson X, Van Hirtum A, Lopez-Arteaga I, Hirschberg A. An in vitro setup to test the relevance and the accuracy of low-order vocal folds models. J Acoust Soc Am. 2007;121:479–490. doi: 10.1121/1.2384846. [DOI] [PubMed] [Google Scholar]
- 13.Stevens K. Airflow and turbulence noise for fricative and stop consonants: Static considerations. The Journal of the Acoustical Society of America. 1971;50:1180. [Google Scholar]
- 14.Zhang Z, Mongeau L, Frankel SH. Broadband sound generation by confined turbulent jets. J Acoust Soc Am. 2002;112:677–689. doi: 10.1121/1.1492817. [DOI] [PubMed] [Google Scholar]
- 15.Zhang Z, Mongeau LG. Broadband sound generation by confined pulsating jets in a mechanical model of the human larynx. J Acoust Soc Am. 2006;119:3995–4005. doi: 10.1121/1.2195268. [DOI] [PubMed] [Google Scholar]
- 16.Isshiki N. Vocal efficiency index. Vocal fold physiology. 1981:193–203. [Google Scholar]
- 17.Hanamitsu M, Kataoka H, Takeuchi E, Kitajima K. Comparative study of vocal function after near-total laryngectomy. Laryngoscope. 1999;109:1320–1323. doi: 10.1097/00005537-199908000-00026. [DOI] [PubMed] [Google Scholar]
- 18.Flanagan JL, Ishizaka K, Shipley KL. Synthesis of speech from a dynamic model of vocal cords and vocal-tract. Bell System Technical Journal. 1975;54:485–506. [Google Scholar]
- 19.Story BH, Titze IR. Voice simulation with a body-cover model of the vocal folds. J Acoust Soc Am. 1995;97:1249–1260. doi: 10.1121/1.412234. [DOI] [PubMed] [Google Scholar]
- 20.Kob M. Physical modeling of the singing voice, Bibliothek der RWTH Aachen. 2002 [Google Scholar]
- 21.Wong D, Ito MR, Cox NB, Titze IR. Observation of perturbations in a lumped-element model of the vocal folds with application to some pathological cases. J Acoust Soc Am. 1991;89:383–394. doi: 10.1121/1.400472. [DOI] [PubMed] [Google Scholar]
- 22.Herzel H, Berry D, Titze IR, Saleh M. Analysis of vocal disorders with methods from nonlinear dynamics. J Speech Hear Res. 1994;37:1008–1019. doi: 10.1044/jshr.3705.1008. [DOI] [PubMed] [Google Scholar]
- 23.Ishizaka K, Flanagan J. Synthesis of voiced sounds from a two-mass model of the vocal cords. Speech Synthesis. 1973:148. [Google Scholar]
- 24.Jiang JJ, Titze IR. A methodological study of hemilaryngeal phonation. Laryngoscope. 1993;103:872–882. doi: 10.1288/00005537-199308000-00008. [DOI] [PubMed] [Google Scholar]
- 25.Slavit DH, Maragos NE. Arytenoid adduction and type i thyroplasty in the treatment of aphonia. J Voice. 1994;8:84–91. doi: 10.1016/s0892-1997(05)80324-8. [DOI] [PubMed] [Google Scholar]
- 26.Bielamowicz S, Berke GS, Gerratt BR. A comparison of type i thyroplasty and arytenoid adduction. J Voice. 1995;9:466–472. doi: 10.1016/s0892-1997(05)80212-7. [DOI] [PubMed] [Google Scholar]