

Summary
Objectives
To identify venous thromboembolism (VTE) disease-susceptibility genes.
Patients/Methods
We performed in silico genome wide association (GWAS) analyses using genotype data imputed to ~2.5 million single nucleotide polymorphisms (SNPs) from adults with objectively-diagnosed VTE (n=1503), and controls frequency-matched on age and sex (n=1459; discovery population). SNPs exceeding genome-wide significance were replicated in a separate population (VTE cases, n=1407; controls, n=1418). Genes associated with VTE were resequenced.
Results
Seven SNPs exceeded genome-wide significance (P < 5 × 10⁻⁸); four on chromosome 1q24.2 (F5 rs6025 [Factor V Leiden], BLZF1 rs7538157, NME7 rs16861990 and SLC19A2 rs2038024) and three on chromosome 9q34.2 (ABO rs2519093 [ABO intron 1], rs495828, rs8176719 [ABO blood type O allele]). The replication study confirmed a significant association of F5, NME7, and ABO with VTE. However, F5 was the main signal on 1q24.2 as only ABO SNPs remained significantly associated with VTE after adjusting for F5 rs6025. This 1q24.2 region was shown to be inherited as a haplotype block. ABO resequencing identified 15 novel single nucleotide variations (SNV) in ABO intron 6 and the ABO 3’ UTR that were strongly associated with VTE (P < 10-4) and belonged to three distinct linkage disequilibrium (LD) blocks; none were in LD with ABO rs8176719 or rs2519093. Our sample size provided 80% power to detect odds ratios=2.0 and 1.51 for minor allele frequencies=0.05 and 0.5, respectively (α=1 × 10⁻⁸; 1% VTE prevalence).
Conclusions
Aside from F5 rs6025, ABO rs8176719 and rs2519093, and F2 rs1799963, additional common and high VTE-risk SNPs among whites are unlikely.
Keywords: venous thromboembolism, deep vein thrombosis, pulmonary embolism, genetics, genome-wide scan, epidemiology
Introduction
Venous thromboembolism, consisting of deep vein thrombosis (DVT) and its complication, pulmonary embolism (PE), is a common and potentially fatal disease. The overall annual VTE incidence among USA whites is 108 per 100,000 person-years; incidence rates increase exponentially with age for both men and women, and for both DVT and PE.[1] For almost one-quarter of PE patients, the initial clinical presentation is sudden death.[2] Family and twin studies suggest that VTE is highly heritable (h2=0.62) and likely results from multigenic action as well as environmental exposures.[3-5] Several genetic disorders or mutations that affect the regulation of hemostasis have been associated with VTE in small case-control studies or observed in high VTE-risk pedigrees.[6] These include mutations that impair the anticoagulant pathway, up-regulate (e.g., prothrombin G20210A) or impair downregulation of the procoagulant pathway (e.g., Factor V Leiden), downregulate fibrinolysis, and up-regulate innate immunity. In a SNP-based candidate gene, case-control study, we tested genetic variation within all known important components of the anticoagulant, procoagulant, fibrinolytic and innate immunity pathways for an independent association with VTE and found one or more SNPs within ABO, F2, F5, F11, KLKB1, SELP and SCUBE1 were significantly associated with VTE, including Factor V Leiden (F5 rs6025 T [minor] allele), prothrombin G20210A, ABO non-O blood type (ABO rs8176719, odds ratio [OR]=1.47, P=5.68×10⁻¹²), and a novel association with ABO rs2519093 (OR=1.68, P=8.08×10⁻¹⁶) that was independent of blood type.[7] A GWAS confirmed associations of VTE with Factor V Leiden and with ABO loci (blood groups non-O and A2),[8] and a second GWAS with a larger sample size and more dense genome-wide scan genotype data found associations of VTE with the F11 and FGG loci.[9] We hypothesized that genes within other pathways also are VTE disease-susceptibility genes. To test this hypothesis, we performed a genome-wide association study on the same VTE case-control (discovery) population used for our candidate gene study, and replicated all SNPs exceeding genome-wide significance in a separate VTE case-control (replication) population. Finally, we performed gene resequencing in order to identify potentially “causative” genetic variation in LD with haplotype-tagged SNPs that were associated with VTE.
Materials and Methods
Discovery population
The discovery study population consisted 1503 VTE cases and 1459 controls (Supplementary Table 1) from a candidate gene (CG) study, as previously described.[7] A subset of the CG study, 1270 VTE cases and 1302 controls, who consented to sending their leukocyte genomic DNA outside of the Mayo Clinic, and newly recruited cases and controls, have genome-wide scan (GWS) genotype data. The Mayo Clinic IRB approved the study protocol as well as the data sharing protocol administered through Database for Genotypes and Phenotypes (dbGAP).
Genotyping
Candidate Gene (CG) study
Leukocyte genomic DNA was extracted, quantified and diluted to the appropriate concentration for Illumina Infinium iSelect genotyping within the Genotyping Core Laboratory of the Mayo Clinic Advanced GenomicsTechnology Center, as previously described.[7] Genotyping controls included 2% sample replicates and a CEPH trio for quality control. In addition, case and control DNA sample addresses were randomly assigned across both the 96-well plate as well as the 12-address iSelect BeadChip, ensuring approximately equal numbers of case and control DNA samples by each stratum to avoid potential plate and chip effects, respectively. Genotyping results from high-quality control DNA (SNP call rate ≥95%) were used to generate a cluster algorithm. Of the 14,612 SNPs submitted to Illumina from 764 genes within the anticoagulant, procoagulant, fibrinolytic and innate immunity pathways, 1,585 SNPs (covering 1,100 LD bins) failed manufacture, leaving 13,027 successfully genotyped SNPs. Four additional SNPs were custom genotyped on TaqMan, leaving 13,031 SNPs for analysis.
Genome-wide Scan (GWS) study
The Center for Inherited Disease Research (CIDR), one of two genotyping centers supported by the Gene, Environment Association Studies Consortium (GENEVA) consortium,[10] genotyped DNA samples using the Illumina Human660-Quad v.1_A BeadChip (Illumina) and DNA from a subset of CG cases and controls that consented to sending their DNA outside Mayo. Similar to the CG study, case and control DNA sample addresses were randomly assigned across 96-well plates provided by CIDR while ensuring roughly equal percentages of cases and controls within each plate. Genotype clusters for each SNP were determined using the Illumina BeadStudio Module (version 3.3.7), and combined intensity data from 96.6% of samples were used to define clusters and call genotypes. Overall, 99.9% of samples attempted (2,597 of 2,600 total) passed quality-control standards. Genotypes were not called if the quality score from BeadStudio was <0.15. Both the mean SNP call rates and the mean sample call rates were 99.9%. Genotypes were released for 560,816 SNPs (99.88% of those attempted). Genotypes were not released for autosomal SNPs with call rates <85%, >1 HapMap replicate error, >9% difference in call rate between genders, <0.2 cluster separation or >11% difference in heterozygote frequency. Duplicate samples from both HapMap and the study were included on each plate. Four HapMap trios (parents and child) were included to detect Mendelian inheritance errors (i.e., whether the alleles are incorrectly passed from each parent to the child). Reproducibility rates in the raw data were 99.99% among 32 duplicated study subjects. The genotype concordance in the 134 HapMap control samples was 99.8%.
Quality-control steps
For both CG and GWS studies, four main categories of quality-control flags were set for autosomal SNPs: (i) unacceptably high rates of missing genotype calls (>5%), (ii) low minor allele frequency (MAF) (<0.005), (iii) unacceptably high rates of Mendelian errors (>1) and (iv) deviation from Hardy-Weinberg equilibrium (HWE, P<E-05). For the CG study, of the SNPs perfoming well (12,477/13,031) 181 SNPs were excluded due a MAF<0.005 (n=127) or a call rate <0.95 (n=54), leaving 12,296 SNPs (covering 10,456 bins) for the association analysis. For the GWS study, we flagged 1,965 SNPs with >5% missing genotypes. A total of 1,683 (1,115/1,135) SNPs were flagged overall (cases/controls) for HWE deviation at P<E-05.
Population stratification
To test for “cryptic relatedness” in our population, we conducted a population structure analysis on all participating subjects to document genetic diversity among our population. Using 494 Ancestry Informative Markers (AIMS) available on both our candidate gene and GWA studies,[11] we ran STRUCTURE on 2962 participants.[12] The triangle plot provided a graphical representation of genetic structure of our participants plus 209 unrelated individuals from HapMap phase II populations (Yorubans [YRI]; European-Americans from the CEPH collection [CEU]; Chinese from Beijing [CHB]; and Japanese from Tokyo [JPT]), giving a clear sense of how our participants fall among the HapMap reference populations (Supplementary Figure 1).
Replication population
SNPs exceeding genome-wide significance in the discovery population and not in LD within a gene were genotyped in a separate replication population of 2,825 individuals (VTE cases, n=1407; controls, n=1418; Supplementary Table 3). Replication study leukocyte genomic DNA samples were largely from Olmsted County, MN, USA residents with objectively-diagnosed incident VTE over the 45-year period, 1966-2010, and previously-matched Olmsted County resident controls, as previously described.[13-15] The replication case and control sample size was augmented by leukocyte DNA from non-Olmsted County Mayo Clinic patients identified as described for the CG study population.[7]
DNA resequencing
We selected a subset of the discovery VTE cases and controls for resequencing to take advantage of the joint configuration of two ABO SNPs independently associated with VTE, rs8176719 (ABO exon 6 deletion determining type O blood group) and rs2519093 (ABO intron 1 tag SNP).[7] We randomly sampled 82 cases and 14 controls within 3 of the 9 potential allele frequency cells (Supplementary Figure 8). The rs8176719 alleles are --/-- (deletion is the major allele), --/G, and G/G (G is the minor allele). The rs2519093 alleles are G/G (G is the major allele), A/G, and A/A (A is the minor allele). For each SNP, the genotypes are represented as 0, 1, or 2 copies of the minor allele. We represented the joint allelic configuration of the two SNPs with the number of copies of the rs8176719 minor allele given first as 0/0 (both with 0 copies of the minor allele), 0/1, 0/2 (0 copies of the rs8176719 minor allele), 1/0 (1 copy of the minor rs8176719 allele), 1/1, and 1/2, and 2/0 (2 copies of the rs8176719 SNP minor allele and 0 copies of the rs2519093 minor allele), 2/1, and 2/2. From Supplementary Figure 8, one observes discrepancies between cases and controls at the 0/0, 1/1 and 2/2 combinations. We randomly sampled from these three combinations, taking one third of the case series. For each SNP, we had 28 cases with 0/0 copies of the minor allele, 27 cases with 1/1 copies of the minor allele; and 27 cases with the combination of 2/2 copies of the minor allele. We compared these 82 cases with 14 controls that do not have any of these combinations.
Capture of the target genomic regions was performed using the Agilent custom eArray. The capturing probes (baits) of 120 bases in length were designed based on the paired-end sequencing protocol with a tiling frequency of 3x. The standard repeat masked regions were avoided based on the definition in the UCSC genome database. The repeat regions are mostly in intronic regions of the genes.
Sequencing was performed using Illumina’s HiSeq 2000 sequencer. Twelve samples were multiplexed in each lane of the 8-lane flow cell, and a total of 96 samples (82 VTE cases and 14 controls) were sequenced. The read qualities were examined by FastQC (http://www.bioinformatics.bbsrc.ac.uk/projects/fastqc) which generates QC matrix from the FASTQ files including per-base sequence qualities, per-sequence quality scores, per-base nucleotide content, and sequence duplication levels. The FastQC tool also provides warnings for parameters failing to pass QC thresholds. The paired-end 100-base reads were aligned to human genome build 36 using Burrows Wheeler Aligner (BWA)[16] allowing 4% of editing distance within a seed length of 32. If the sequence duplication levels failed to pass the FastQC threshold, the duplicated reads were removed using the SAMtools’s rmdup method.[17] The BWA alignment was then cleaned up and improved using the Genome Analysis ToolKit (GATK)[18] by recalibration and local re-alignments. SNVs were called using SNVMix[19] with a cut-off probability score of 0.8 based on our preliminary testing using a HapMap CEPH subject sequenced by the 1000 genome project (data not shown), and INDELs were called by GATK with default parameters setting.
The read depths of each of the A, C, G, T bases at each variant position, as well as the average mapping quality score were provided by curating the BAM pile-up files using SAMtools.[17] If an identified SNV was a known variant from dbSNP or 1000 Genomes Project, the allele frequencies of CEU, YRI, and CHB/JPT populations from HapMap and 1000 Genome Project were provided. Both SNVs and INDELs were annotated by batch submission to the SeattleSeq server, and for SNVs additional annotations were acquired using a locally or cloud installed SIFT.[20] The SNVs or INDELs within a user defined distance (default: 5 bases) to exon-intron boundaries were flagged as potential splice variants and the corresponding transcript IDs are provided.
Information was reported on genes hosting SNVs and INDELs, including (i) the KEGG pathway(s) (http://www.genome.jp/kegg) to which the gene belongs; and (ii) tissue expression specificity of the gene.
Statistical methods
GWS (Illumina 660Q; 557,112 SNPs) and CG (n=764 genes relevant to the anticoagulant, procoagulant, fibrinolytic and innate immunity pathways; n=12,551 SNPs) genotypes from the discovery population VTE cases (objectively-diagnosed; no cancer, catheter or antiphospholipid antibodies; n=1503) and controls (frequency-matched on case age, gender, race, MI/stroke status; n= 1459) were merged and imputed to ~2.5 million SNPs (i.e., in silico genotypes) with MACH using HapMap Phase II (60 CEU).[21] All genetic coordinates in tables and figures refer to HapMap release 22 build 36. In regions where no candidate gene genotypes were available, only subjects with GWS data were used for the imputation.
The primary outcome was VTE status, a binary measure. The covariates were age at interview or blood sample collection, sex, stroke/MI status and USA state of residence (Supplementary Table 1). We tested for an association between each SNP and VTE using unconditional logistic regression, adjusting for age, sex, stroke/MI status and USA state of residence using PLINK v 1.07.[22] A similar analysis was performed for the replication study and the covariates were age at interview or blood sample collection, sex and USA state of residence (Supplementary Table 3). Haplotype analyses were performed on the 25 chromosome 1q.24.2 SNPs most significantly associated with VTE, considering 25- and 10-SNP-sliding-windows, as implemented in PLINK v 1.07.[22] Novel ABO SNVs identified by resequencing were tested for an association with VTE using age-, sex-adjusted unconditional logistic regression and Fisher’s Exact Test. Population attributable risk (PAR) was estimated for F5 rs6025 (Factor V Leiden), F2 rs1799963 (prothrombin G20210A) and ABO blood type haplotype, as previously performed.[7]
VTE prevalence was estimated using the resources of the Rochester Epidemiology Project which has mapped Olmsted County, MN, USA residency for over 500,000 people from 1/1/1966 to 12/31/2010. All Olmsted County residents with objectively-diagnosed, incident VTE over the 40-year period, 1966-2005, have been followed forward in time until death or last follow-up. VTE point prevalence was recorded for 1/1/2006 using these data and adjusted to the USA white population data from the 2000 Census.
Results
Discovery in silico GWAS results
Among the 1503 VTE cases and 1459 controls in the discovery population, the age and sex distributions were similar between cases and controls; however we found a significant difference between VTE cases and controls for prior stroke or myocardial infarction (stroke/MI); and USA state of residence (Supplementary Table 1). From the population stratification analysis, 98.64% of samples were classified as European and 1.36% as “other” ancestry (includes individuals of mixed ancestry; Supplementary Figure 1). Since age, sex, prior stroke or myocardial infarction have been shown or suggested to be risk factors for VTE,[1] and due to the significant difference between VTE cases and controls regarding USA state of residence, we adjusted for these four characteristics in the logistic regression analyses.
After adjusting for age, sex, stroke/MI and USA state of residence, 39 SNPs exceeded genome-wide significance (P≤5 × 10⁻⁸; Figure 1A and Supplementary Table 2); F2 rs1799963 (prothrombin G20210A) was borderline significant (OR=2.46, P=1.7 × 10⁻⁶). The quantile-quantile plot of the expected vs. observed genome-wide −log(P-values) (Supplementary Figure 2) shows the impact of chromosome regions 1q24.2 and 9q on VTE risk. Table 1 shows the association results for significant SNPs not in LD within a gene (F5 rs6025, BLZF1 rs7538157, NME7 rs16861990, SLC19A2 rs2038024, and ABO rs2519093, rs8176719 [ABO blood type non-O] and rs495828).
Figure 1.
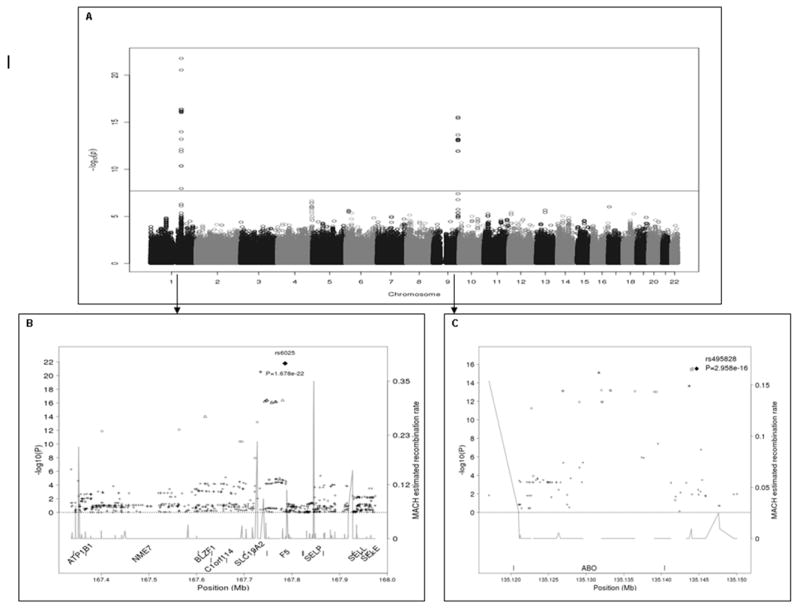
A. Manhattan plot of –log10(P-values) from the case-control association analysis on the merged/imputed VTE data assuming an additive genetic model. The horizontal line at 1.99 × 10-08 represents the Bonferroni correction. Figure 1B. Location and linkage disequilibrium for SNPs on chromosome 1q24.2 surrounding F5. The black diamond corresponds to F5 6025 (Factor V Leiden) the most significant SNP. Figure 1C. Location and linkage disequilibrium for SNPs on chromosome 9q surrounding ABO. The black diamond corresponds to the most significant SNP, rs495828. For Figures 1B and 1C, the linkage disequilibrium measure, r2, between the most significant SNP and any other SNP in the region is symbol coded; the square, star, triangle, circle, and cross symbols correspond to r2 > 0.95, > 0.8 and ≤ 0.95, > 0.5 and ≤ 0.8, > 0.2 and ≤ 0.5, and ≤ 0.2, respectively.
Table 1.
Odds ratio and 95% confidence intervals, minor allele, minor allele frequency (MAF) and imputation quality for single nucleotide polymorphisms (SNPs) showing genome-wide significance, adjusted for age, sex, stroke/myocardial infarction status and USA state of residence
| SNP | Gene | Chromosome | Position† | Minor Allele | MAF | OR (95% CI) | P | Imputed (r2)/Genotyped |
|---|---|---|---|---|---|---|---|---|
| SNPs in genes previously reported | ||||||||
| rs6025 | F5 | 1 | 167785673 | T | 0.063 | 3.57 (2.76, 4.60) | 1.68E-22 | Yes (0.97)/Yes |
| rs8176719 | ABO | 9 | 135122729 | G | 0.419 | 1.47 (1.32, 1.64) | 5.68E-12 | No/Yes‡ |
| rs2519093 | ABO | 9 | 135131691 | A | 0.243 | 1.69 (1.48, 1.91) | 8.08E-16 | No/Yes‡ |
| SNPs in genes not previously reported | ||||||||
| rs7538157 | BLZF1 | 1 | 167618168 | C | 0.062 | 2.69 (2.09, 3.45) | 1.04E-14 | Yes (0.901)/No |
| rs16861990 | NME7 | 1 | 167401751 | C | 0.099 | 2.02 (1.66, 2.45) | 1.69E-12 | Yes (0.932)/Yes§ |
| rs2038024 | SLC19A2 | 1 | 167722606 | C | 0.177 | 1.53 (1.32, 1.78) | 1.12E-08 | Yes (0.893)/Yes§ |
| rs495828 | ABO | 9 | 135144688 | T | 0.272 | 1.65 (1.46, 1.86) | 2.96E-16 | Yes (0.988)/Yes§ |
NCBI build 36 of the human genome
Genotype available in all subjects through the candidate gene data set.
Genotype available in only 2570 subjects (87% of our combined samples) through the GWA data set
Replication and combined results findings
In the separate replication population consisting of 1407 VTE cases and 1418 controls, no significant difference was found between age, sex, and USA state of residence (Supplementary Table 3). Because BLZF1 rs7538157 was in high LD with F5, SLC19A2 and ATP1B1, the BLZF1 SNP (rs7538157) was replaced by ATP1B1 rs12061601 (Figure 1B). After adjusting for age, sex and USA state of residence, F5 rs6025 (P=1.4 × 10⁻¹²), NME7 rs16861990 (P=4.9 × 10⁻⁹), and ABO rs2519093 (P=1.2 × 10⁻¹⁷), rs495828 (P=2.4 × 10⁻¹⁷) and rs8176719 (P=5.7 × 10⁻¹⁶), were significantly associated with VTE, while ATP1B1 rs12061601 (P=0.02), F2 rs1799963 (P=0.03) and SLC19A2 rs2038024 (P=0.09) were marginally associated (Table 2a). All replicated SNP ORs were in the same direction and of similar magnitude as that of the discovery population.
Table 2.
a. Replication odds ratio and 95% confidence intervals, minor allele, minor allele frequency (MAF; overall and by case/control status) using 2,825 subjects (1407 cases and 1418 controls), adjusted for age, sex and USA state of residence
| SNP | Gene | Chromosome | N | MAF | MAF - cases | MAF - controls | OR (95%CI) | P |
|---|---|---|---|---|---|---|---|---|
| rs6025 | F5 | 1 | 2543 | 0.060 | 0.086 | 0.035 | 2.56 (1.97, 3.32) | 1.40E-12 |
| rs12061601 | ATP1B1 | 1 | 2521 | 0.139 | 0.151 | 0.126 | 1.21 (1.03, 1.43) | 0.02 |
| rs16861990 | NME7 | 1 | 2559 | 0.097 | 0.122 | 0.071 | 1.79 (1.47, 2.18) | 4.89E-09 |
| rs2038024 | SLC19A2 | 1 | 2603 | 0.172 | 0.182 | 0.162 | 1.13 (0.98, 1.31) | 0.09 |
| rs2519093 | ABO | 9 | 2599 | 0.235 | 0.289 | 0.182 | 1.80 (1.58, 2.07) | 1.15E-17 |
| rs495828 | ABO | 9 | 2627 | 0.261 | 0.317 | 0.205 | 1.73 (1.52, 1.96) | 2.38E-17 |
| rs8176719 | ABO | 9 | 2532 | 0.416 | 0.476 | 0.357 | 1.63 (1.45, 1.84) | 5.62E-16 |
| rs1799963 | F2 | 11 | 2620 | 0.019 | 0.024 | 0.015 | 1.69 (1.06, 2.41) | 0.03 |
| b. Replication odds ratio and 95% confidence intervals using 2,825 subjects (1407 cases and 1418 controls), adjusted for age, sex, USA state of residence and F5 rs6025 T allele (Factor V Leiden) | |||||||
| SNP | Gene | N | MAF | MAF-Cases | MAF-Controls | OR (95%CI) | P |
| rs12061601 | ATP1B1 | 2477 | 0.137 | 0.150 | 0.125 | 0.92 (0.76, 1.10) | 0.35 |
| rs16861990 | NME7 | 2505 | 0.097 | 0.123 | 0.071 | 1.17 (0.89, 1.54) | 0.25 |
| rs2038024 | SLC19A2 | 2474 | 0.170 | 0.178 | 0.163 | 0.77 (0.65, 0.92) | 0.004 |
| rs2519093 | ABO | 2474 | 0.235 | 0.289 | 0.181 | 1.85 (1.61, 2.13) | 1.37E-17 |
| rs495828 | ABO | 2501 | 0.261 | 0.317 | 0.205 | 1.76 (1.54, 2.01) | 3.60E-17 |
| rs8176719 | ABO | 2477 | 0.416 | 0.474 | 0.359 | 1.58 (1.40, 1.78) | 9.75E-14 |
| rs1799963 | F2 | 2485 | 0.019 | 0.023 | 0.015 | 1.71 (1.12, 2.63) | 0.014 |
These SNPs cluster in two genomic regions located on chromosome 1q24.2 (Figure 1B) and on chromosome 9q (Figure 1C). Chromosome 1q24.2 and 9q LD patterns observed in controls are shown in Supplementary Figures 3 and 4, and the ORs and respective 95% confidence intervals for an association of SNPs in these two genomics regions with VTE are depicted in Supplementary Figures 5 and 6. Since ATP1B1, NME7, BLZF1 and SLC19A2 are in close proximity to F5, we repeated the association analysis including the F5 rs6025 T (minor) allele (Factor V Leiden) as a covariate and found that only the ABO SNPs remained significantly associated with VTE at the genome-wide level. Similarly, in the replication study only the ABO SNPs and SLC19A2 rs2038024 remained significantly associated with VTE after adjusting for F5 rs6025 T. Although SLC19A2 rs2038024 was marginally associated with VTE, the OR was in the opposite direction from that of the discovery population, suggesting a spurious association (Table 2b).
Receiver Operator Characteristic areas under the curve (AUC), calculated individually and jointly using all significant SNPs, were not different for covariates (age, sex, stroke/MI and USA state of residence) plus F5 rs6025 T (AUC=0.653) compared to covariates plus F5 rs6025 T, ATP1B1 rs12061601, NME7 rs16861990 and SLC19A2 rs2038024 (AUC=0.653), while addition of ABO SNPs did increase the AUC (AUC=0.675; Figure 2).
Figure 2.
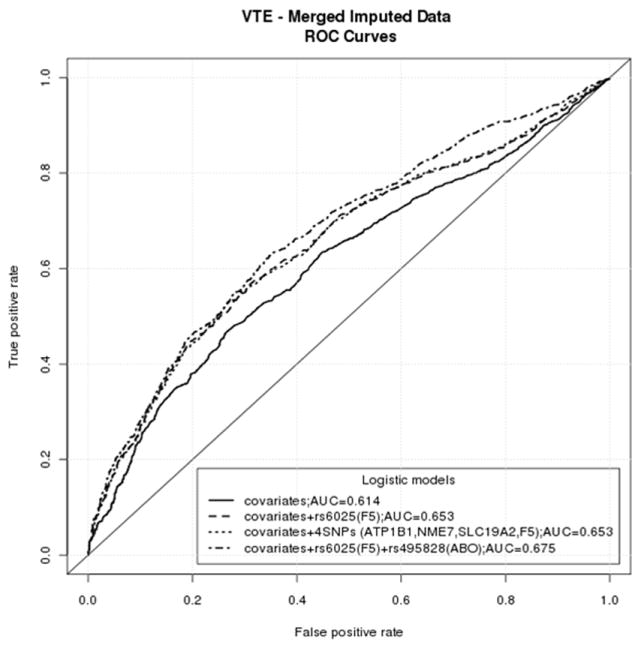
Receiver Operator Characteristic (ROC) Curve Analyses of Chromosome 1q24.2 and ABO SNPs
Haplotype analysis results
Haplotype analysis of the 25 chromosome 1q.24.2 SNPs (including ATP1B1, NME7, BLZF1, C1orf114, SLC19A2, F5 and SELP; Figure 1B and Supplementary Table 4) most significantly associated with VTE showed that only the two haplotypes containing F5 rs6025 T were significantly associated with VTE (Table 3). Together, these data suggest that this chromosome 1q24.2 region is inherited as a haplotype block of ~0.52mb. Among all F5 rs6025 T carriers (N=369; 280 cases and 89 controls; 186 males and 183 females), 235 (63.7%; 177 cases and 58 controls) carriers inherited at least one of these two 1q24.2 haplotypes. The haplotype containing the F5 rs6025 T and the SELP rs3917862 G (minor) alleles slightly increased the association of the haplotype with VTE (OR=3.59) compared to the haplotype containing the F5 rs6025 T and the SELP rs3917862 A alleles (OR=3.16, Table 3). However, a 10-SNP-sliding-window with nine SNPs in F5 (including the F5 rs6025 T allele) and one SNP in SELP (SNP rs3917862 G [minor] allele) considerably increased the association of this haplotype with VTE (OR=4.55, P=2.07 × 10⁻¹³) compared to the association for the haplotype containing the F5 rs6025 T and SELP rs3917862 A alleles (OR=3.09, P=1.83 × 10⁻¹¹; Supplementary Table 5).
Table 3.
Haplotype analysis of the 25 most significant chromosome 1q24.2 SNPs adjusted for age, sex, stroke/myocardial infarction and USA state of residence.
| Haplotype†‡§ | F | OR | STAT | P |
|---|---|---|---|---|
| TATAGGTAGAGCTATGCAGCATGCA | 0.136 | 0.80 | 7.65 | 0.006 |
| TATAGGTAGAGCTATGCAGCAGGCA | 0.447 | 0.92 | 2.02 | 0.16 |
| TATAAGTAGAGCTATGCAGCATGCA | 0.0795 | 0.82 | 3.68 | 0.06 |
| TATAAGTAGAGCTATGCAGCAGGCA | 0.0273 | 0.83 | 1.04 | 0.31 |
| CCCCAACCAGAACTACGGATCGATG | 0.0185 | 3.59 | 28.9 | 7.46E-08 |
| TATAAGTCAAAACTACGGATCGACA | 0.0127 | 1.04 | 0.0313 | 0.86 |
| CCCCAACCAGAACTACGGATCGATA | 0.0227 | 3.16 | 29.2 | 6.55E-08 |
| CATAGGTAGAGCTATGCAGCAGGCA | 0.029 | 0.97 | 0.0266 | 0.87 |
| TATAGGTAGAGCTATGCAGCAGGCG | 0.0211 | 1.07 | 0.109 | 0.74 |
| TATAAGTCAAGCTATGCAGCATGCA | 0.0196 | 0.89 | 0.385 | 0.54 |
| TCCAAACAGAGCTATGCAGCAGGCA | 0.0129 | 0.73 | 1.51 | 0.22 |
| TATAAGTCGAGCTATGCAGCAGGCA | 0.0162 | 1.27 | 1.15 | 0.28 |
The first SNP of the haplotype is ATP1B1 rs12061601, and the last SNP of the haplotype is SELP rs3917862
Allele in bold is F5 rs6025 (T is the minor allele [Factor V Leiden])
Underlined allele is SELP rs3917862 (G is the minor allele)
Resequencing results
To further evaluate ABO sequence variation for an association with VTE, we performed ABO resequencing, including 10 Kb of the flanking regions, using Illumina HiSeq 2000. Excluding the intronic repeat regions, 98% of the targeted area (Supplementary Figure 7) was sequenced with > 20X coverage in 96 samples (82 VTE cases and 14 controls). On average, ~35-40 SNVs and ~5-10 insertion-deletions (INDELs) were detected in each sample. Fifteen novel SNVs in ABO intron 6 and the ABO 3’ UTR were associated with VTE (all P<10-04) and belonged to three distinctive LD blocks; none were in LD with ABO rs8176719 (blood type O allele) or rs2519093 although ABO rs8176746 (blood type A allele) and rs8176747 (blood type B allele) were in moderate LD (r2=0.56-0.65) with novel SNPs in block 3 (Figure 3; Supplementary Table 6). Although ABO rs8176746 and rs8176747 did not reach genome wide significance in the primary analysis, a secondary analysis (adjusted for age, sex, stroke/MI and USA state of residence) of the derivation population that considered ABO blood type (either haplotype/genotype or phenotype; VTE cases, n=1459; controls, n=1422) found strong associations of ABO blood types A (OR=1.64; 95%CI: 1.41, 1.91; P=7.83 × 10⁻¹¹) and O (OR=0.52; 95%CI: 0.44, 0.60; P=2.40 × 10⁻¹⁶) with VTE, but no association with blood types B (OR=1.15; 95%CI: 0.91, 1.44; P=0.25) or AB (OR=1.22; 95%CI: 0.87, 1.70; P=0.25; Supplementary Table 7). Finally, a significant, protective, frame-shifting single base (G) deletion of one of three guanines at ABO chr9:135120878-80 was found within exon 7. This deletion likely corresponds to ABO rs8176750 (ABO blood-type A2).
Figure 3.
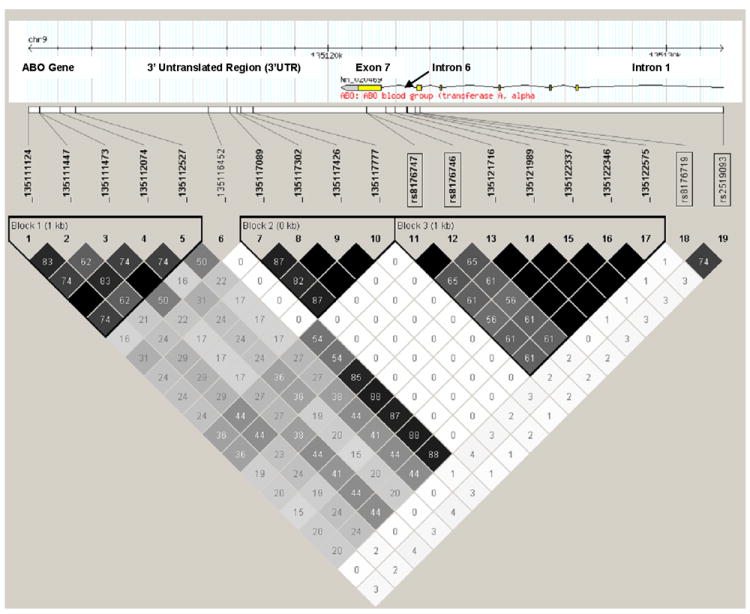
Linkage disequilibrium (LD) between novel ABO SNVs identified by resequencing, and ABO rs8176474 (blood type A allele), rs8176746 (blood type B allele), rs8176719 (blood type O allele) and rs2519093 (ABO intron 1), among 82 VTE cases and 14 controls selected based on ABO rs8176719 and rs2519093 genotype (see Methods). The numbers inside each square and the square shading indicate the degree of LD between SNPs and/or SNVs (i.e., black squares with no number indicate complete LD [r2=1.0]; intensity of the gray shading indicates intermediate values between complete LD [r2=1.0] and no LD [r2=0.0], and white squares with 0 number indicate no LD).
The individual, joint and group population attributable risk (PAR) were calculated for the risk genotypes for Factor V Leiden (F5 rs6025), prothrombin G20210A (F2 rs1799963), and ABO blood type haplotype or genotype (Supplementary Table 8). The highest PAR value was from the ABO blood type non-O, followed by ABO blood type A, Factor V Leiden, and prothrombin G20210A. The PAR values were very similar between the joint and group estimation methods, with highest joint or group PAR (PAR=0.47) for ABO blood type non-O, F5 rs6025 and F2 rs1799963).
Discussion
Our most notable finding was the strong association of VTE with three novel and distinctive ABO LD blocks that were independent of ABO type O blood type. ABO encodes for glycosyltransferases responsible for post translational glycosylation of procoagulant FVIII and von Willebrand Factor (VWF).[23] ABO O blood group phenotype and genotype (i.e., ABO rs8176719) is associated with a decreased risk for VTE,[7, 8, 24] presumably due to decreased plasma levels of FVIII and VWF.[25, 26] ABO-mediated glycosylation protects VWF from proteolysis by ADAMTS13[27] such that individuals with type O blood group (homozygous exon 6 ABO rs8176719 deletion) and hypoglycosylated VWF have ~25% lower plasma FVIII and VWF levels.[24, 28]
We previously identified an independent association of an ABO intron 1 SNP (rs2519093) with VTE (OR=1.68, P=8.08×10⁻¹⁶).[7] This intronic region does not affect RNA splicing or harbor any suppressor RNA elements, nor is it close to any other ABO variants with known function, including variants in ABO exons 6 and 7 that have been variably associated with VTE risk.[29-33] Of the 15 novel ABO SNVs found on resequencing, none were in LD with this ABO intron 1 SNP (Figure 3; Supplementary Table 6). Consequently, the findings of this study expand on our previous observation and suggest that this ABO intron 1 region along with an LD block in ABO intron 6 and two LD blocks in the ABO 3’ UTR play important roles in ABO expression and associated VTE risk.
In a secondary analysis, the ABO blood type A haplotype was strongly associated with VTE (Supplementary Table 7) as previously described.[31-34] In the limited and select sample (n=96) of our discovery population who underwent ABO resequencing, the ABO A allele was in moderate LD (r2=0.56-0.65) with SNVs in ABO LD block 3 (Figure 3) which potentially could account for the association of these novel block 3 SNVs with VTE. The association of VTE with novel SNVs in ABO LD block 2 was independent of blood type A (rs8176747) and O (rs8176719) alleles, and ABO rs2519093 (Figure 3). ABO LD block 2 may be important for gene regulation due to a potential open chromatin region as reflected by enrichment for multiple epi-genetic markers in the region,(ENCODE: http://www.genome.gov/10005107) a transcription factor binding site (ChIP-seq, ENCODE: http://www.genome.gov/10005107), and evolutionary conservation (UCSC phatCons[35] and phylo[36] algorithms; Figure 4). In addition, strong evidence from dbEST supports the middle LD block as also lying within a novel transcript, probably an extension of the 3’ of ABO (dbEST: http://www.ncbi.nlm.nih.gov/dbEST/; Figure 4). ABO SNV_135116452 was not part of any ABO LD block but it was in high LD with SNVs from LD block 3, and in moderate (r2=0.54) LD with the ABO blood type A allele (rs8176747; Figure 3). Thus, the association of SNV_135116452 with VTE may also be due to blood type A. Lastly, the SNVs in ABO LD block 1 are in low LD with all the other SNVs and SNPs (Figure 3). The associations of SNVs in LD block 1 with VTE are independent of blood type A (r2~0.27-0.44) and O (r2~0-0.02) alleles, and ABO rs2519093 (r2~0-0.04; Figure 3).
Figure 4.
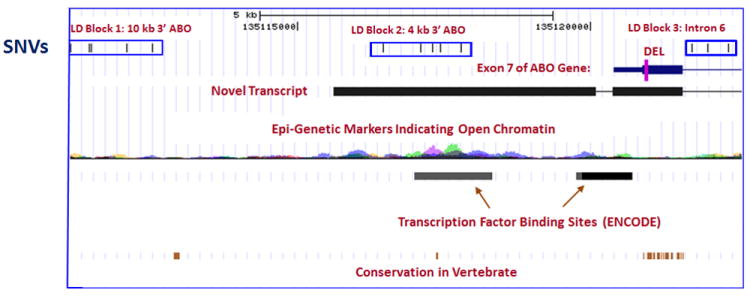
Potential functional roles of ABO SNVs identified on resequencing, by LD block or deletion.
Our ABO resequencing data also support the previously reported association of VTE with ABO blood type A2 (ABO rs8176750).[8, 31] Although we did not directly genotype ABO rs8176750 in either our CG or GWAS studies, one directly-genotyped ABO SNP (rs8176704) in strong LD with rs8176750 (r2≥0.8) was associated with a significantly reduced risk of VTE (OR=0.78; 95%CI: 0.63, 0.97, P=0.02) that was of similar magnitude to that reported for ABO blood type A2.[8, 31] The ABO rs8176750 deletion results in a frame-shift that abrogates the wild-type stop codon within exon 7 and likely leads to an elongated transcript (Figure 4) and an absent or dysfunctional protein similar to blood type O.
Our second notable finding was the discovery that Factor V Leiden is inherited as a haplotype block that spans seven genes on chromosome 1q24.2, including ATP1B1, NME7, BLZF1, C1orf114, SLC19A2, F5 and SELP. F5 encodes for plasma procoagulant Factor(F) V; FV accelerates activation of prothrombin to thrombin by catalyzing assembly of the prothrombinase complex. FV inactivation is key for down-regulating procoagulant activity. Activated Protein C (APC), a serine protease, inactivates FV via cleavage at arginine[R]306, R506 and R679; initial APC cleavage at R506 is required for rapid FV inactivation by APC cleavage at R306 and R679.[37] F5 rs6025 encodes for substitution of glutamine for R506.[38, 39] Factor V Leiden carriers have normal FV procoagulant activity but impaired FV down-regulation due to “resistance” to cleavage/inactivation by APC.[40, 41] Factor V Leiden is a founder mutation occurring about 30,000 years ago,[42] and is associated with ~3.5-fold increased risk for VTE (lifetime VTE penetrance ~5%).[7, 38, 43]
Our third finding was that the tag SNP SELP rs3917862 compounds the risk of VTE among Factor V Leiden carriers. SELP encodes for P-Selectin, a membrane glycoprotein with pro-inflammatory activity that mediates the interaction between activated platelets, leukocytes, immune cells and endothelial cells.[44, 45] Cell-surface P-selectin expression and soluble P-selectin concentration are partly controlled by SELP genetic variation.[46, 47] Increased soluble P-selectin plasma levels are associated with incident and recurrent VTE.[48, 49] We previously showed that SELP rs3917862 was associated with a 1.6-fold increased risk of VTE at a false discovery rate q = 0.006.[7] SELP is located immediately upstream from F5 (Figure 1B), and associations between SELP haplotypes and VTE have been attributed to high LD with F5 rs6025 T.[50] In our previous report, while SELP rs3917862 was not in high LD with F5 rs6025 T (r2=0.12, D’=0.37), the association of rs3917862 with VTE was no longer significant (P=0.3) after controlling for F5 rs6025 T.[7] Our new analyses indicate that the haplotype containing the F5 rs6025 T and the SELP rs3917862 G (minor) alleles increases the association of the haplotype with VTE (OR=3.59) compared to the haplotype containing the F5 rs6025 T and the SELP rs3917862 A alleles (OR=3.16, Table 3). Furthermore, the association of the haplotype with VTE increases when considering different numbers of SNPs in the sliding window approach (OR=4.55 for 10-SNP-sliding-window with nine SNPs in F5 and one in SELP; Supplementary Table 5). Based on these statistical analyses, we conclude that the SELP rs3917862 T allele compounds the risk of VTE associated with F5 rs6025 T.
Although we found associations of VTE with ATP1B1, NME7, BLZF1, and SLC19A2, these associations disappeared in both the discovery and replication populations after controlling for F5 rs6025 T (Factor V Leiden). ATP1B1 encodes for a Na+/K+ ATPase important in endothelial cell and platelet function, NME7 encodes for a nucleoside-diphosphate kinase important in erythropoiesis and CD4 T-cell activation, BLZF1 (JEM-1) encodes for basic leucine zipper nuclear factor 1 which is important for the response of acute promyelocytic leukemia to retinoic acid, and SLC19A2 encodes for a thiamine transporter protein (THTR-1) implicated in thiamine-responsive megaloblastic anemia. While the products of these genes are potentially biologically plausible in the causal pathway to VTE, none have been previously associated with VTE. Moreover, ROC curve analyses showed that SNPs within these four genes added no additional information over that provided by patient characteristics and F5 rs6025 T alone. Thus, we believe it is unlikely that these genes are VTE disease-susceptibility genes.
Our sample size provided 80% power to detect odds ratios of 2.0 and 1.51 for minor allele frequencies (MAF)=0.05 and 0.5, respectively (α=5 × 10⁻⁸) based on a 1% prevalence of VTE among USA whites for the year 2000.[51] While single studies or individual-level data meta-analyses with a larger sample size and/or more dense genome-wide scan genotype data may identify additional SNPs that associate with VTE, we believe that aside from F5 rs6025, ABO rs8176719 and rs2519093, and F2 rs1799963, additional common (i.e., MAF>0.05) and high VTE-risk (i.e., OR>2.0) SNPs among persons of non-Hispanic European ancestry are unlikely.
Supplementary Material
Acknowledgments
We thank C.E. Regnier, J.L. Alkhamis, L.M. Heimer, R.M. Weatherly, R.A. Mueller, D. Tines, A, Xue, R.A. Miller, J.J. Larson, E.N. Jeavons and A.F. Beauseigneur for their excellent technical assistance. All were compensated as part of their regular duties.
We sincerely thank all participants in this study. This project was part of the Gene, Environment Association Studies Consortium (GENEVA) funded by the USA National Human Genome Research Institute (NHGRI) to enhance communication and collaboration among investigators conducting genome-wide studies for a variety of complex diseases. Our group benefited greatly from the work and efforts of the entire consortium, especially the work by the Coordinating Center (directed by B. Weir and C. Laurie of the University of Washington) in data cleaning (D.R. Crosslin) and preparation of these cases and controls for submission to the Database for Genotypes and Phenotypes (dbGAP; S. Bennett). We also acknowledge the leadership of T. Manolio of NHGRI. Genotyping services were provided by the Center for Inherited Disease Research (CIDR), funded through a federal contract from the USA National Institutes of Health (NIH) to Johns Hopkins University.
Funding
This work was supported by the National Institutes of Health, National Heart, Lung and Blood Institute [grant numbers HL66216, HL83141], National Human Genome Research Institute [grant number HG04735], and National Cancer Institute [grant number CA92153], U.S. Public Health Service; the Centers for Disease Control and Prevention [grant number DD000235]; the Mayo Clinic Center for Individualized Medicine; and by Mayo Foundation.
Footnotes
Conflict of Interest Statement
The authors have no conflict of interest to declare.
References
- 1.Heit JA. The epidemiology of venous thromboembolism in the community. Arterioscler Thromb Vasc Biol. 2008;28:370–2. doi: 10.1161/ATVBAHA.108.162545. [DOI] [PMC free article] [PubMed] [Google Scholar]
- 2.Heit JA, Silverstein MD, Mohr DN, Petterson TM, O’Fallon WM, Melton LJI. Predictors of survival after deep vein thrombosis and pulmonary embolism: a population-based, cohort study. Arch Intern Med. 1999;159:445–53. doi: 10.1001/archinte.159.5.445. [DOI] [PubMed] [Google Scholar]
- 3.Souto JC, Almasy L, Borrell M, Blanco-Vaca F, Mateo J, Soria JM, Coll I, Felices R, Stone W, Fontcuberta J, Blangero J. Genetic susceptibility to thrombosis and its relationship to physiological risk factors: the GAIT study. Genetic Analysis of Idiopathic Thrombophilia. Am J Hum Genet. 2000;67:1452–9. doi: 10.1086/316903. [DOI] [PMC free article] [PubMed] [Google Scholar]
- 4.Heit JA, Phelps MA, Ward SA, Slusser JP, Petterson TM, De Andrade M. Familial segregation of venous thromboembolism. J Thromb Haemost. 2004;2:731–6. doi: 10.1111/j.1538-7933.2004.00660.x. [DOI] [PubMed] [Google Scholar]
- 5.Larsen TB, Sorensen HT, Skytthe A, Johnsen SP, Vaupel JW, Christensen K. Major genetic susceptibility for venous thromboembolism in men: a study of Danish twins. Epidemiology. 2003;14:328–32. [PubMed] [Google Scholar]
- 6.Heit JA. Thrombophilia: Clinical and laboratory assessment and managment. In: Kitchens C, Alving B, Kessler C, editors. Consultative Hemostasis and Thrombosis. W. B. Saunders; 2007. pp. 213–44. [Google Scholar]
- 7.Heit JA, Cunningham JM, Petterson TM, Armasu SM, Rider DN, DE Andrade M. Genetic variation within the anticoagulant, procoagulant, fibrinolytic and innate immunity pathways as risk factors for venous thromboembolism. Journal of Thrombosis and Haemostasis. 2011;9:1133–42. doi: 10.1111/j.1538-7836.2011.04272.x. [DOI] [PMC free article] [PubMed] [Google Scholar]
- 8.Tregouet DA, Heath S, Saut N, Biron-Andreani C, Schved JF, Pernod G, Galan P, Drouet L, Zelenika D, Juhan-Vague I, Alessi MC, Tiret L, Lathrop M, Emmerich J, Morange PE. Common susceptibility alleles are unlikely to contribute as strongly as the FV and ABO loci to VTE risk: results from a GWAS approach. Blood. 2009;113:5298–303. doi: 10.1182/blood-2008-11-190389. [DOI] [PubMed] [Google Scholar]
- 9.Germain M, Saut N, Greliche N, Dina C, Lambert JC, Perret C, Cohen W, Oudot-Mellakh T, Antoni G, Alessi MC, Zelenika D, Cambien F, Tiret L, Bertrand M, Dupuy AM, Letenneur L, Lathrop M, Emmerich J, Amouyel P, Tregouet DA, Morange PE. Genetics of venous thrombosis: insights from a new genome wide association study. Plos ONE. 2011;6:e25581. doi: 10.1371/journal.pone.0025581.PONE-D-11-09932 [DOI] [PMC free article] [PubMed] [Google Scholar]
- 10.Cornelis MC, Agrawal A, Cole JW, Hansel NN, Barnes KC, Beaty TH, Bennett SN, Bierut LJ, Boerwinkle E, Doheny KF, Feenstra B, Feingold E, Fornage M, Haiman CA, Harris EL, Hayes MG, Heit JA, Hu FB, Kang JH, Laurie CC, Ling H, Manolio TA, Marazita ML, Mathias RA, Mirel DB, Paschall J, Pasquale LR, Pugh EW, Rice JP, Udren J, van Dam RM, Wang X, Wiggs JL, Williams K, Yu K. The Gene, Environment Association Studies consortium (GENEVA): maximizing the knowledge obtained from GWAS by collaboration across studies of multiple conditions. Genetic Epidemiology. 2010;34:364–72. doi: 10.1002/gepi.20492. [DOI] [PMC free article] [PubMed] [Google Scholar]
- 11.Seldin MF, Shigeta R, Villoslada P, Selmi C, Tuomilehto J, Silva G, Belmont JW, Klareskog L, Gregersen PK. European population substructure: clustering of northern and southern populations. PLoS Genet. 2006;2:e143. doi: 10.1371/journal.pgen.0020143. [DOI] [PMC free article] [PubMed] [Google Scholar]
- 12.Pritchard JK, Stephens M, Donnelly P. Inference of population structure using multilocus genotype data. Genetics. 2000;155:945–59. doi: 10.1093/genetics/155.2.945. [DOI] [PMC free article] [PubMed] [Google Scholar]
- 13.Heit JA, Silverstein MD, Mohr DN, Petterson TM, O’Fallon WM, Melton LJI. Risk factors for deep vein thrombosis and pulmonary embolism: a population-based case-control study. Arch Intern Med. 2000;160:809–15. doi: 10.1001/archinte.160.6.809. [DOI] [PubMed] [Google Scholar]
- 14.Heit JA, Petterson TM, Owen WG, Burke JP, DE Andrade M, Melton LI. Thrombomodulin gene polymorphisms or haplotypes as potential risk factors for venous thromboembolism: a population-based case-control study. J Thromb Haemost. 2005;3:710–7. doi: 10.1111/j.1538-7836.2005.01187.x. [DOI] [PubMed] [Google Scholar]
- 15.Heit JA, Leibson CL, Ashrani AA, Petterson TM, Bailey KR, Melton LJ., III Is diabetes mellitus an independent risk factor for venous thromboembolism?: a population-based case-control study. Arterioscler Thromb Vasc Biol. 2009;29:1399–405. doi: 10.1161/ATVBAHA.109.189290. [DOI] [PMC free article] [PubMed] [Google Scholar]
- 16.Li H, Durbin R. Fast and accurate short read alignment with Burrows-Wheeler transform. Bioinformatics. 2009;25:1754–60. doi: 10.1093/bioinformatics/btp324. [DOI] [PMC free article] [PubMed] [Google Scholar]
- 17.Li H, Handsaker B, Wysoker A, Fennell T, Ruan J, Homer N, Marth G, Abecasis G, Durbin R. The Sequence Alignment/Map format and SAMtools. Bioinformatics. 2009;25:2078–9. doi: 10.1093/bioinformatics/btp352. [DOI] [PMC free article] [PubMed] [Google Scholar]
- 18.McKenna A, Hanna M, Banks E, Sivachenko A, Cibulskis K, Kernytsky A, Garimella K, Altshuler D, Gabriel S, Daly M, DePristo MA. The Genome Analysis Toolkit: a MapReduce framework for analyzing next-generation DNA sequencing data. Genome Res. 2010;20:1297–303. doi: 10.1101/gr.107524.110. [DOI] [PMC free article] [PubMed] [Google Scholar]
- 19.Goya R, Sun MG, Morin RD, Leung G, Ha G, Wiegand KC, Senz J, Crisan A, Marra MA, Hirst M, Huntsman D, Murphy KP, Aparicio S, Shah SP. SNVMix: predicting single nucleotide variants from next-generation sequencing of tumors. Bioinformatics. 2010;26:730–6. doi: 10.1093/bioinformatics/btq040. [DOI] [PMC free article] [PubMed] [Google Scholar]
- 20.Kumar P, Henikoff S, Ng PC. Predicting the effects of coding non-synonymous variants on protein function using the SIFT algorithm. Nat Protoc. 2009;4:1073–81. doi: 10.1038/nprot.2009.86. [DOI] [PubMed] [Google Scholar]
- 21.Li Y, Willer C, Sanna S, Abecasis G. Genotype imputation. Annual Review of Genomics & Human Genetics. 2009;10:387–406. doi: 10.1146/annurev.genom.9.081307.164242. [DOI] [PMC free article] [PubMed] [Google Scholar]
- 22.Purcell S, Neale B, Todd-Brown K, Thomas L, Ferreira MA, Bender D, Maller J, Sklar P, de Bakker PI, Daly MJ, Sham PC. PLINK: a tool set for whole-genome association and population-based linkage analyses. Am J Hum Genet. 2007;81:559–75. doi: 10.1086/519795. [DOI] [PMC free article] [PubMed] [Google Scholar]
- 23.Matsui T, Titani K, Mizuochi T. Structures of the asparagine-linked oligosaccharide chains of human von Willebrand factor. Occurrence of blood group A, B, and H(O) structures. J Biol Chem. 1992;267:8723–31. [PubMed] [Google Scholar]
- 24.Ohira T, Cushman M, Tsai MY, Zhang Y, Heckbert SR, Zakai NA, Rosamond WD, Folsom AR. ABO blood group, other risk factors and incidence of venous thromboembolism: the Longitudinal Investigation of Thromboembolism Etiology (LITE) J Thromb Haemost. 2007;5:1455–61. doi: 10.1111/j.1538-7836.2007.02579.x. [DOI] [PubMed] [Google Scholar]
- 25.Kamphuisen PW, Eikenboom JC, Rosendaal FR, Koster T, Blann AD, Vos HL, Bertina RM. High factor VIII antigen levels increase the risk of venous thrombosis but are not associated with polymorphisms in the von Willebrand factor and factor VIII gene. Br J Haematol. 2001;115:156–8. doi: 10.1046/j.1365-2141.2001.03089.x. [DOI] [PubMed] [Google Scholar]
- 26.Tsai AW, Cushman M, Rosamond WD, Heckbert SR, Tracy RP, Aleksic N, Folsom AR. Coagulation factors, inflammation markers, and venous thromboembolism: the longitudinal investigation of thromboembolism etiology (LITE) Am J Med. 2002;113:636–42. doi: 10.1016/s0002-9343(02)01345-1. [DOI] [PubMed] [Google Scholar]
- 27.McGrath RT, McKinnon TA, Byrne B, O’Kennedy R, Terraube V, McRae E, Preston RJ, Laffan MA, O’Donnell JS. Expression of terminal alpha2-6-linked sialic acid on von Willebrand factor specifically enhances proteolysis by ADAMTS13. Blood. 2010;115:2666–73. doi: 10.1182/blood-2009-09-241547. [DOI] [PubMed] [Google Scholar]
- 28.Smith NL, Chen MH, Dehghan A, Strachan DP, Basu S, Soranzo N, Hayward C, Rudan I, Sabater-Lleal M, Bis JC, de Maat MP, Rumley A, Kong X, Yang Q, Williams FM, Vitart V, Campbell H, Malarstig A, Wiggins KL, Van Duijn CM, McArdle WL, Pankow JS, Johnson AD, Silveira A, McKnight B, Uitterlinden AG, Aleksic N, Meigs JB, Peters A, Koenig W, Cushman M, Kathiresan S, Rotter JI, Bovill EG, Hofman A, Boerwinkle E, Tofler GH, Peden JF, Psaty BM, Leebeek F, Folsom AR, Larson MG, Spector TD, Wright AF, Wilson JF, Hamsten A, Lumley T, Witteman JC, Tang W, O’Donnell CJ. Novel associations of multiple genetic loci with plasma levels of factor VII, factor VIII, and von Willebrand factor: The CHARGE (Cohorts for Heart and Aging Research in Genome Epidemiology) Consortium. Circulation. 2010;121:1382–92. doi: 10.1161/CIRCULATIONAHA.109.869156. [DOI] [PMC free article] [PubMed] [Google Scholar]
- 29.Wu O, Bayoumi N, Vickers MA, Clark P. ABO(H) blood groups and vascular disease: a systematic review and meta-analysis. J Thromb Haemost. 2008;6:62–9. doi: 10.1111/j.1538-7836.2007.02818.x. [DOI] [PubMed] [Google Scholar]
- 30.Mercier B, Oger E, Le Gal G, Mottier D, Ferec C. Phenotypic but not allelic ABO blood group association with risk of venous thrombosis. Thromb Haemost. 2005;93:388–9. [PubMed] [Google Scholar]
- 31.Morelli VM, De Visser MC, Vos HL, Bertina RM, Rosendaal FR. ABO blood group genotypes and the risk of venous thrombosis: effect of factor V Leiden. J Thromb Haemost. 2005;3:183–5. doi: 10.1111/j.1538-7836.2004.01071.x. [DOI] [PubMed] [Google Scholar]
- 32.Tirado I, Mateo J, Soria JM, Oliver A, Martinez-Sanchez E, Vallve C, Borrell M, Urrutia T, Fontcuberta J. The ABO blood group genotype and factor VIII levels as independent risk factors for venous thromboembolism. Thromb Haemost. 2005;93:468–74. doi: 10.1160/TH04-04-0251. [DOI] [PubMed] [Google Scholar]
- 33.Paiva SG, Sabino AP, Carvalho MG, Ribeiro DD, Gomes KB, Santos MS, Oliveira MS, Lages GG, Dusse LM, Fernandes AP. Polymorphisms in exons 6 and 7 of the ABO locus and their association with venous thrombosis in young Brazilian patients. Blood Coagul Fibrinolysis. 2009;20:122–8. doi: 10.1097/MBC.0b013e328323da99. [DOI] [PubMed] [Google Scholar]
- 34.Wiggins KL, Smith NL, Glazer NL, Rosendaal FR, Heckbert SR, Psaty BM, Rice KM, Lumley T. ABO genotype and risk of thrombotic events and hemorrhagic stroke. J Thromb Haemost. 2009;7:263–9. doi: 10.1111/j.1538-7836.2008.03243.x. [DOI] [PMC free article] [PubMed] [Google Scholar]
- 35.Felsenstein J, Churchill GA. A Hidden Markov Model approach to variation among sites in rate of evolution. Mol Biol Evol. 1996;13:93–104. doi: 10.1093/oxfordjournals.molbev.a025575. [DOI] [PubMed] [Google Scholar]
- 36.Cooper GM, Stone EA, Asimenos G, Green ED, Batzoglou S, Sidow A. Distribution and intensity of constraint in mammalian genomic sequence. Genome Res. 2005;15:901–13. doi: 10.1101/gr.3577405. [DOI] [PMC free article] [PubMed] [Google Scholar]
- 37.Kalafatis M, Bertina RM, Rand MD, Mann KG. Characterization of the molecular defect in factor VR506Q. J Biol Chem. 1995;270:4053–7. doi: 10.1074/jbc.270.8.4053. [DOI] [PubMed] [Google Scholar]
- 38.Juul K, Tybjaerg-Hansen A, Schnohr P, Nordestgaard BG. Factor V Leiden and the risk for venous thromboembolism in the adult Danish population. Ann Intern Med. 2004;140:330–7. doi: 10.7326/0003-4819-140-5-200403020-00008. [DOI] [PubMed] [Google Scholar]
- 39.Bertina RM, Koeleman BP, Koster T, Rosendaal FR, Dirven RJ, de Ronde H, van der Velden PA, Reitsma PH. Mutation in blood coagulation factor V associated with resistance to activated protein C. Nature. 1994;369:64–7. doi: 10.1038/369064a0. [DOI] [PubMed] [Google Scholar]
- 40.Dahlback B, Carlsson M, Svensson PJ. Familial thrombophilia due to a previously unrecognized mechanism characterized by poor anticoagulant response to activated protein C: prediction of a cofactor to activated protein C. Proc Natl Acad Sci U S A. 1993;90:1004–8. doi: 10.1073/pnas.90.3.1004. [DOI] [PMC free article] [PubMed] [Google Scholar]
- 41.Martinelli I, Bottasso B, Duca F, Faioni E, Mannucci PM. Heightened thrombin generation in individuals with resistance to activated protein C. Thromb Haemost. 1996;75:703–5. [PubMed] [Google Scholar]
- 42.Zivelin A, Griffin JH, Xu X, Pabinger I, Samama M, Conard J, Brenner B, Eldor A, Seligsohn U. A single genetic origin for a common Caucasian risk factor for venous thrombosis. Blood. 1997;89:397–402. [PubMed] [Google Scholar]
- 43.Heit JA, Sobell JL, Li H, Sommer SS. The incidence of venous thromboembolism among Factor V Leiden carriers: a community-based cohort study. Journal of Thrombosis and Haemostasis. 2005;3:305–11. doi: 10.1111/j.1538-7836.2004.01117.x. [DOI] [PubMed] [Google Scholar]
- 44.Andre P. P-selectin in haemostasis. British Journal of Haematology. 2004;126:298–306. doi: 10.1111/j.1365-2141.2004.05032.x. [DOI] [PubMed] [Google Scholar]
- 45.Nurden AT. Platelets, inflammation and tissue regeneration. Thrombosis & Haemostasis. 2011;105(Suppl 1):S13–33. doi: 10.1160/THS10-11-0720. [DOI] [PubMed] [Google Scholar]
- 46.Volcik KA, Catellier D, Folsom AR, Matijevic N, Wasserman B, Boerwinkle E. SELP and SELPLG genetic variation is associated with cell surface measures of SELP and SELPLG: the Atherosclerosis Risk in Communities Carotid MRI Study. Clinical Chemistry. 2009;55:1076–82. doi: 10.1373/clinchem.2008.119487. [DOI] [PMC free article] [PubMed] [Google Scholar]
- 47.Marteau JB, Lambert D, Herbeth B, Marie B, Droesch S, Tregouet DA, Visvikis-Siest S. P-selectin polymorphisms’ influences on P-selectin serum concentrations and on their familial correlation: the STANISLAS family study. Journal of Thrombosis and Haemostasis. 2008;6:920–7. doi: 10.1111/j.1538-7836.2008.02952.x. [DOI] [PubMed] [Google Scholar]
- 48.Blann AD, Noteboom WM, Rosendaal FR. Increased soluble P-selectin levels following deep venous thrombosis: cause or effect? British Journal of Haematology. 2000;108:191–3. doi: 10.1046/j.1365-2141.2000.01813.x. [DOI] [PubMed] [Google Scholar]
- 49.Kyrle PA, Hron G, Eichinger S, Wagner O. Circulating P-selectin and the risk of recurrent venous thromboembolism. Thrombosis & Haemostasis. 2007;97:880–3. [PubMed] [Google Scholar]
- 50.Uitte de Willige S, De Visser MC, Vos HL, Houwing-Duistermaat JJ, Rosendaal FR, Bertina RM. Selectin haplotypes and the risk of venous thrombosis: influence of linkage disequilibrium with the factor V Leiden mutation. Journal of Thrombosis and Haemostasis. 2008;6:478–85. doi: 10.1111/j.1538-7836.2007.02879.x. [DOI] [PubMed] [Google Scholar]
- 51.Skol A, Scott LJ, Abecasis G, Boehnke M. Joint analysis is more efficient than replication-based analysis for two-stage genome-wide association studies. Nature Genetics. 2006;38:209–13. doi: 10.1038/ng1706. [DOI] [PubMed] [Google Scholar]
Associated Data
This section collects any data citations, data availability statements, or supplementary materials included in this article.