

Abstract
Objective
We investigate health expenditure disparities between Latinos and non-Latino whites by years of United States residence and citizenship/nativity status.
Data Sources
We link the Medical Expenditure Panel Survey and the National Health Interview Survey from 2000 to 2007. The sample consists of 31,514 Latinos and 76,021 white adults (18–64 years).
Study Design
The likelihood of any health spending, total health expenditure, and the out-of-pocket (OOP) share of health expenditure are our main dependent variables. We use two-part multivariate models to adjust for confounding factors. A stratified analysis by insurance status checks for the results' robustness. The decomposition technique is implemented to estimate the share of disparities that can be explained by observed and unobserved variables.
Principal Findings
Latinos are much less likely to have any health spending (68 percent), total health expenditure (57 percent), and more likely to pay OOP (6 percent) compared with the white population. Overall, disparities narrow or disappear for naturalized Latinos the longer they stay in the country. Among noncitizen Latinos, disparities remain constant or decline slightly, but they remain large over time.
Conclusions
Low-health spending by foreign-born Latinos contributes to health expenditure disparities between Latinos and whites. Our findings provide preliminary evidence on health-spending convergence over time between foreign-born Latinos and that of whites.
Keywords: Health expenditures, health care disparities, access to health care, Hispanic Americans, Latinos, decomposition
According to the Centers for Medicare and Medicaid Services the United States spent U.S.$2.5 trillion on health care in 2009, or approximately U.S.$8,086 per resident (Center for Medicare and Medicaid Services 2010). The previous literature on health-spending disparities demonstrates a clear gap among non-Latino whites (whites, subsequently), African American, and Latinos (Escarce and Kapur 2003; McGuire et al. 2006; Stanton 2006; Cook, McGuire, and Miranda 2007; DiMassa and Escarce 2007). The magnitude of disparities varies across age, health status, and income cohorts (Le Cook, McGuire, and Zuvekas 2009). Differences in health expenditures diminish in the upper levels of the health expenditure distribution; however, health spending for African Americans and Latinos remains significantly low compared with whites (Cook and Manning 2009). A recent multiyear study that analyzes trends on health expenditure disparities between African Americans and Latinos finds that while African American—white disparities have remained constant, Latino–white disparities have widened between 1996–1997 and 2004–2005 (Le Cook, McGuire, and Zuvekas 2009).
One possible explanation of these diverging trends on health expenditure could be the disproportionate share of foreign-born residents and immigrants across ethnic/racial groups. In the United States, certain ethnic/racial groups have a higher share of foreign-born individuals. For example, Latinos (38.1 percent) are more likely to be foreign-born compared with African Americans (7.7 percent) and whites (3.9 percent) (PEW Hispanic Center 2009; U.S. Census 2009). The uneven share of foreign-born individuals complicates comparisons across ethnic/racial groups due to immigrant self-selection. Immigrants can be either positively or negatively self-selected, depending on their socioeconomic and demographic characteristics (Borjas 2003; Chiswick, Lee, and Miller 2005). Controlling for citizenship/nativity status is not enough, because the previous literature shows how unobserved characteristics are correlated with foreign-born status (Card 2001). Research on health care and expenditure disparities should address immigrant self-selection by estimating the share of disparities that is due to observed and unobserved characteristics.
The outcomes of this analysis are increasingly relevant as Latinos currently represent 15.5 percent of U.S. residents, constituting the largest ethnic minority group in the country (PEW Hispanic Center 2008). According to recent Census estimates, Latinos are likely to represent a quarter of the U.S. population by 2050 (Passel and Cohn 2008). If present trends continue, increasing Latino–white disparities could contribute to raising health-spending inequality. Foreign-born individuals are less likely to spend on health care according to the recent literature (Mohanty et al. 2005; Ku 2009a, b). We thus investigate the dynamics of health expenditure disparities between Latinos and whites analyzing spending by time of U.S. residence and citizenship/nativity status. We later assess whether outcome differences are due to observed or unobserved characteristics.
Our first research hypothesis is that increasing Latino–white disparities are partly due to lower spending among foreign-born Latinos who are less likely to spend on health care compared with whites. Our second research hypothesis is that health-spending disparities are likely to decrease the longer Latino residents and immigrants live in the country. Our third hypothesis is that lower spending among foreign-born Latinos could be mostly explained by immigrant self-selection, pictured on different sociodemographic characteristics.
To test these hypotheses, we use two-part models to first estimate the probability of reporting any health expenditures and any out-of-pocket (OOP) health spending between Latinos and whites, distinguishing among Latinos by time of U.S. residence and citizenship/nativity status. A subsequent multivariate analysis compares disparities by the amount of total health spending and by the OOP share of health expenditure among individuals who report any spending. A stratified analysis by insurance status is implemented to check for the results' robustness. A second stage of the analyses uses Blinder–Oaxaca decomposition methods to test the proposed hypotheses and to identify specific factors explaining different health expenditure rates.
METHODS
Data
We use two nationally representative datasets, the Medical Expenditure Panel Survey (MEPS) and the National Health Interview Survey (NHIS) (AHRQ 2008; United States National Center for Health Statistics 2008). The MEPS Consolidated File is a person-year level database, which provides detailed consumer information on health expenditures, socioeconomic characteristics, health, and health insurance status. We link MEPS to the NHIS from 2000 to 2007 for each survey year to obtain information on time of U.S. residence and individual citizenship and immigration status. We use cross-section data for the 8-year period to enlarge the sample size and improve the predictive power of the main explanatory variables. We further construct five mutually exclusive dichotomous measures of citizenship and immigration: U.S.-born citizen, naturalized U.S. citizen (≤10 years or >10 years in the country), and non-U.S. citizen (≤10 years or >10 years of United States in the country). Our merged dataset has 76,021 non-Latino whites and 31,514 Latino adults.
Health Expenditure Variables
Our dataset includes information about total health expenditure and OOP spending. We construct four measures following the previous literature (Mohanty et al. 2005; Cook, McGuire, and Miranda 2007; Cook and Manning 2009; Ku 2009a, b). The first two measures are dichotomous terms indicating the probability of reporting any health expenditure or any OOP spending between whites and Latinos. The third and fourth measures are used to analyze the amount and type of health expenditure (Manning et al. 1985; Manning and Mullahy 2001). We estimate the natural logarithm of total health expenditures to address the skewness in the distribution of this variable (Vargas Bustamante 2010;Wooldridge 2002). The fourth measure is the OOP share of total health expenditure. This variable is used to compare the relative importance of OOP from overall health spending. All expenditures are adjusted to constant 2008 dollars using the Medical Care Component of the Consumer Price Index.
Explanatory Variables
Our main comparison categories are between Latinos by years of U.S. residence (≤10 years or >10 years) and citizenship/nativity status and white adults (18–64 years). The analyses comprise a number of explanatory variables that previous studies have identified as health expenditure covariates (Mohanty et al. 2005; Cook, McGuire, and Miranda 2007; Ku 2009a). These include socioeconomic and demographic characteristics, self-reported health status, chronic disease condition, language of interview to proxy for native language, health insurance coverage, and having a usual source of care. We also include fixed effects for survey years to adjust for any possible annual events that could have an effect on the dependent variable, with 2000 as the reference year.
Statistical Analyses
An initial analysis describes the socioeconomic, health, and demographic characteristics of the sampled population. We later estimate a two-part model (Goldberger 1964; Cragg 1971). The first part of this model represents the multivariate logistic regression between whites (the reference group) and Latinos to estimate the likelihood of any health expenditure and the probability of reporting any OOP. The second part of the model runs a regression conditional on any health spending. We estimate the log-linear disparity between Latinos and whites on total health expenditures and the OOP share of health expenditure. The multivariate analyses control for the confounding variables. All regressions are adjusted for sampling weights provided in MEPS to ensure that our results are nationally representative of the noninstitutionalized civilian U.S. population.
We implement the Blinder–Oaxaca decomposition technique to parse out observed and unobserved differences in health spending between whites and Latinos (Jann 2008). The Blinder–Oaxaca decomposition method has been used to assess mean outcome differences in the discrimination and labor economics literature (Blinder 1973; Oaxaca and Ransom 1994). In health services research, this method has been used to study racial/ethnic disparities in different measures of health care access and utilization and health insurance coverage (Freiman and Cunningham 1997; Monheit and Vistnes 2000; Waidmann and Rajan 2000; Weinick, Zuvekas, and Cohen 2000; Zuvekas and Taliaferro 2003; Hargraves and Hadley 2003; Bustamante et al. 2009; Vargas Bustamante et al. 2009, 2010; Chen et al. 2010).
To decompose total health-spending disparities between Latinos and whites, we estimate multivariate regressions for two groups separately. Hence, our decomposition compares Latinos (M ) and whites (N ). Our main outcome variables (Y) are the measures of health spending described above. Likewise, a series of explanatory variables (X ) are included in the model using whites as the reference group. In a regression framework with coefficients (βl,l∈(M, N )) and error terms (ɛl,l∈(M, N )), we estimate
| (2a) |
The main empirical question is how much of the mean outcome difference is accounted for by the observed (K ) and unobserved ( J ) parts of the decomposition model with a form D=K+J, where
| (2b) |
| (2c) |
The first part (K ) of the outcome differential is explained by group differences in levels of the explanatory variables across the two cohorts. The second part ( J ) is the disparity that we interpret as reflecting unobserved heterogeneity between Latinos and whites. We use Stata 10.0 for our statistical analyses.
RESULTS
Figure 1 pictures the mean total health spending and the OOP share of health expenditure among U.S.-born, naturalized, and noncitizen Latinos and whites. In all years from 2000 to 2007, health expenditure by whites is consistently higher compared with the three Latino categories. Total spending by naturalized Latinos is above that of U.S.-born and non-citizen Latinos for all years. The distribution of U.S.-born Latinos and whites, however, is more stable compared with that of naturalized and noncitizen immigrants, which experience sudden spikes in 2001–2002 and 2004–2005. According to Figure 1, disparities between Latinos and whites have increased more rapidly since 2002. Disparities on the OOP share of health spending remain relatively constant and vary homogeneously between Latinos and whites.
1.
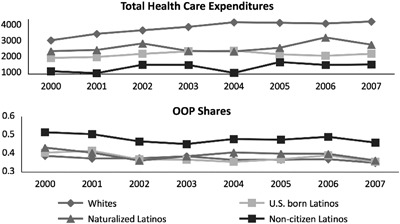
Total Health Expenditures and Out-Of-Pocket (OOP) Shares of Total Spending (2001–2007)
Table 1 details the distribution of individual characteristics and health expenditure for whites and Latinos by time of U.S. residence (≤10 years or >10 years) and citizenship/nativity status. Overall, Latinos are more likely to be single, young, poor, to have fewer years of schooling, and to answer the survey in Spanish compared with whites. Likewise, Latinos are 27 and 23 percent less likely to have health insurance and a usual source of care, respectively. Among those with health insurance, Latinos are more likely to be insured by Medicaid. U.S.-born Latinos are younger, have more years of schooling, a higher income, a better health status, more access to health insurance, and to a usual source of care compared with foreign-born Latinos. Similarly, they are more likely to be single, unemployed, and to respond the survey in English.
Table 1.
Summary Statistics by Latino Citizenship/Nativity Category (2000–2007)
| All Latinos | U.S.-Born Latinos | U.S. Naturalized Latinos ≤10 Years | U.S. Naturalized Latinos >10 Years | Noncitizen Latinos ≤10 Years | Noncitizen Latinos >10 Years | ||||||||
|---|---|---|---|---|---|---|---|---|---|---|---|---|---|
| N= | Whites U.S.-Born 76,021 | 31,514 | p-Value | 12,173 | p-Value | 529 | p-Value | 5,272 | p-Value | 5,966 | p-Value | 7,574 | p-Value |
| Outcome variables | |||||||||||||
| Any health expenditures | 0.88 | 0.66 | <.001 | 0.71 | <.001 | 0.67 | <.001 | 0.76 | <.001 | 0.53 | <.001 | 0.60 | <.001 |
| Any OOP health spending | 0.84 | 0.60 | <.001 | 0.64 | <.001 | 0.60 | <.001 | 0.72 | <.001 | 0.47 | <.001 | 0.55 | <.001 |
| Average health expenditures if any (U.S.$) | 4,475.91 | 3,046.67 | <.001 | 3,195.24 | <.001 | 2,797.07 | .007 | 3,703.47 | <.001 | 2,219.01 | <.001 | 2,785.46 | <.001 |
| OOP share of spending if any | 0.39 | 0.46 | <.001 | 0.42 | <.001 | 0.44 | <.001 | 0.41 | <.001 | 0.56 | <.001 | 0.51 | <.001 |
| Sample characteristics | |||||||||||||
| Age | <.001 | <.001 | <.001 | <.001 | <.001 | <.001 | |||||||
| Average age (year) | 41.79 | 36.71 | 33.73 | 34.68 | 44.53 | 32.11 | 39.81 | ||||||
| 18–24 | 0.12 | 0.19 | 0.31 | 0.23 | 0.05 | 0.21 | 0.09 | ||||||
| 25–34 | 0.19 | 0.28 | 0.27 | 0.35 | 0.14 | 0.47 | 0.24 | ||||||
| 35–44 | 0.24 | 0.25 | 0.20 | 0.21 | 0.30 | 0.21 | 0.35 | ||||||
| 45–54 | 0.26 | 0.17 | 0.15 | 0.13 | 0.30 | 0.07 | 0.22 | ||||||
| 55–64 | 0.19 | 0.10 | 0.08 | 0.09 | 0.22 | 0.03 | 0.11 | ||||||
| Sex | <.001 | <.001 | .497 | .038 | <.001 | <.001 | |||||||
| Female | 0.52 | 0.54 | 0.55 | 0.54 | 0.54 | 0.55 | 0.50 | ||||||
| Marital status | <.001 | <.001 | .967 | <.001 | .095 | <.001 | |||||||
| Married | 0.57 | 0.53 | 0.39 | 0.57 | 0.62 | 0.58 | 0.63 | ||||||
| Education attainment | <.001 | <.001 | <.001 | <.001 | <.001 | <.001 | |||||||
| No high school degree | 0.17 | 0.54 | 0.40 | 0.48 | 0.47 | 0.67 | 0.72 | ||||||
| High school degree | 0.48 | 0.34 | 0.45 | 0.40 | 0.36 | 0.23 | 0.23 | ||||||
| College degree | 0.18 | 0.06 | 0.07 | 0.07 | 0.08 | 0.05 | 0.02 | ||||||
| Advanced degree | 0.18 | 0.06 | 0.07 | 0.05 | 0.09 | 0.05 | 0.03 | ||||||
| Household income | <.001 | <.001 | <.001 | <.001 | <.001 | <.001 | |||||||
| <100% federal poverty line (FPL) | 0.09 | 0.23 | 0.21 | 0.26 | 0.17 | 0.30 | 0.26 | ||||||
| 100–200% FPL | 0.14 | 0.33 | 0.26 | 0.29 | 0.29 | 0.41 | 0.41 | ||||||
| >200% FPL | 0.77 | 0.44 | 0.53 | 0.46 | 0.55 | 0.29 | 0.33 | ||||||
| Employment status | <.001 | <.001 | <.001 | <.001 | <.001 | <.001 | |||||||
| Unemployed | 0.17 | 0.25 | 0.23 | 0.29 | 0.24 | 0.28 | 0.25 | ||||||
| Health status | <.001 | <.001 | <.001 | <.001 | <.001 | <.001 | |||||||
| Poor | 0.04 | 0.03 | 0.04 | 0.03 | 0.05 | 0.01 | 0.03 | ||||||
| Fair | 0.09 | 0.13 | 0.11 | 0.12 | 0.16 | 0.11 | 0.15 | ||||||
| Good | 0.25 | 0.33 | 0.30 | 0.30 | 0.32 | 0.35 | 0.36 | ||||||
| Very good | 0.34 | 0.28 | 0.30 | 0.26 | 0.27 | 0.29 | 0.26 | ||||||
| Excellent | 0.29 | 0.23 | 0.26 | 0.29 | 0.21 | 0.23 | 0.19 | ||||||
| Health insurance | <.001 | <.001 | <.001 | <.001 | <.001 | <.001 | |||||||
| Uninsured | 0.12 | 0.39 | 0.27 | 0.39 | 0.28 | 0.62 | 0.49 | ||||||
| Private non-HMO | 0.49 | 0.21 | 0.27 | 0.21 | 0.25 | 0.12 | 0.16 | ||||||
| Private HMO | 0.30 | 0.23 | 0.27 | 0.20 | 0.31 | 0.11 | 0.19 | ||||||
| Medicaid | 0.07 | 0.16 | 0.17 | 0.19 | 0.15 | 0.15 | 0.16 | ||||||
| Medicare | 0.02 | 0.02 | 0.02 | 0.02 | 0.03 | 0.00 | 0.01 | ||||||
| Other public insurance | 0.00 | 0.01 | 0.01 | 0.01 | 0.01 | 0.01 | 0.00 | ||||||
| Usual source of care | 0.80 | 0.57 | <.001 | 0.64 | <.001 | 0.57 | <.001 | 0.69 | <.001 | 0.41 | <.001 | 0.52 | <.001 |
| Interview language | <.001 | <.001 | <.001 | <.001 | <.001 | <.001 | |||||||
| English | 1.00 | 0.54 | 0.85 | 0.47 | 0.57 | 0.19 | 0.30 | ||||||
| Location | <.001 | <.001 | <.001 | <.001 | <.001 | <.001 | |||||||
| Urban | 0.75 | 0.89 | 0.87 | 0.93 | 0.92 | 0.91 | 0.90 | ||||||
| Census region | <.001 | <.001 | <.001 | <.001 | <.001 | <.001 | |||||||
| Northeast | 0.17 | 0.11 | 0.09 | 0.30 | 0.20 | 0.08 | 0.07 | ||||||
| Midwest | 0.28 | 0.06 | 0.06 | 0.12 | 0.07 | 0.06 | 0.05 | ||||||
| South | 0.35 | 0.37 | 0.40 | 0.43 | 0.33 | 0.41 | 0.29 | ||||||
| West | 0.19 | 0.47 | 0.44 | 0.16 | 0.40 | 0.45 | 0.58 | ||||||
| Survey year | <.001 | .075 | <.001 | <.001 | <.001 | <.001 | |||||||
| 2000 | 0.10 | 0.08 | 0.09 | 0.07 | 0.09 | 0.07 | 0.08 | ||||||
| 2001 | 0.14 | 0.11 | 0.12 | 0.11 | 0.13 | 0.10 | 0.10 | ||||||
| 2002 | 0.15 | 0.14 | 0.14 | 0.17 | 0.14 | 0.14 | 0.12 | ||||||
| 2003 | 0.13 | 0.13 | 0.13 | 0.14 | 0.12 | 0.15 | 0.13 | ||||||
| 2004 | 0.13 | 0.14 | 0.13 | 0.13 | 0.13 | 0.14 | 0.15 | ||||||
| 2005 | 0.12 | 0.14 | 0.13 | 0.13 | 0.14 | 0.14 | 0.15 | ||||||
| 2006 | 0.12 | 0.14 | 0.13 | 0.14 | 0.14 | 0.14 | 0.14 | ||||||
| 2007 | 0.11 | 0.12 | 0.12 | 0.12 | 0.12 | 0.12 | 0.12 | ||||||
Notes. Data sources: Medical Expenditure Panel Survey and National Health Interview Survey (2000–2007).
OOP, out-of-pocket expenditures.
The characteristics of foreign-born Latinos change with time of U.S. residence and as they transit from noncitizen to naturalized status. Naturalized citizens and noncitizen Latinos ≤10 years are younger, have a lower income, a better health status, less access to health insurance and to a usual source of health care; and are more likely to be single, unemployed, and to respond the survey in Spanish compared with naturalized citizens and noncitizen Latinos >10 years, respectively. The progression trends related to time in the country only differ for years of schooling. The share of individuals with high school, college, and advanced degrees increases among naturalized Latinos >10 years compared with naturalized Latinos ≤10 years, while the opposite occurs to noncitizens.
Naturalized Latinos (76 percent for >10 years and 67 percent for ≤10 years) are more likely than U.S.-born Latinos (71 percent) and noncitizen Latinos (60 percent for >10 years and 53 percent for ≤10 years) to experience any health expenditures. Similarly, naturalized Latinos (72 percent for >10 years and 60 percent for ≤10 years) have a higher probability than U.S.-born Latinos (64 percent) and noncitizen Latinos (55 percent for >10 years and 47 percent for ≤10 years) to report any OOP. Among individuals with any health spending, the average amount of health expenditure is lower for naturalized (U.S.$3,703 for >10 years and U.S.$2,797 for ≤10 years), U.S.-born (U.S.$3,195), and noncitizen Latinos (U.S.$2,785 for >10 years and U.S.$2219 for ≤10 years) compared with whites (U.S.$4,476). Likewise, the OOP share of total health expenditure is higher for naturalized (41 percent for >10 years and 54 percent for ≤10 years), U.S.-born (42 percent), and noncitizen Latinos than for whites (51 percent for >10 years and 56 percent for ≤10 years).
Table 2 presents our two-part multivariate analysis. The first two columns include the first part of the model with regressions that estimate the probability of experiencing any health expenditure and of reporting any OOP spending, respectively. The last two columns in Table 2 show regressions that estimate disparities on total health expenditure among those individuals who report any spending and the OOP share of health expenditure. All regression models control for explanatory factors.
Table 2.
Two-Part Model for Health Spending and OOP
| 1 Any Health Expenditures | 2 Any OOP | 3 Total Expenditure if Any | 4 OOP Share if Any | |||||
|---|---|---|---|---|---|---|---|---|
| Odds Ratios | p-Value | Odds Ratios | p-Value | Coefficient | p-Value | Coefficient | p-Value | |
| Race/ethnicity | ||||||||
| Whites | Reference | Reference | Reference | Reference | ||||
| Latinos | 0.60 | .00 | 0.62 | .00 | −0.25 | .00 | 0.00 | .38 |
| Citizenship/years in the United States | ||||||||
| U.S.-born | Reference | Reference | Reference | Reference | ||||
| Naturalized citizens | ||||||||
| ≤10 years | 0.77 | .08 | 0.76 | .06 | −0.09 | .00 | 0.01 | .04 |
| >10 years | 1.02 | .80 | 1.01 | .86 | 0.00 | .99 | 0.02 | .38 |
| Noncitizen | ||||||||
| ≤10 years | 0.85 | .01 | 0.81 | .00 | −0.16 | .00 | 0.02 | .00 |
| >10 years | 0.85 | .01 | 0.87 | .02 | −0.09 | .04 | 0.02 | .03 |
| Age | ||||||||
| 18–24 | Reference | Reference | Reference | Reference | ||||
| 25–34 | 0.96 | .31 | 1.00 | .97 | 0.14 | .00 | −0.01 | .03 |
| 35–44 | 0.98 | .63 | 1.01 | .72 | 0.19 | .00 | −0.01 | .33 |
| 45–54 | 1.31 | .00 | 1.44 | .00 | 0.50 | .00 | 0.00 | .61 |
| 55–64 | 1.83 | .00 | 2.13 | .00 | 0.85 | .00 | 0.00 | .94 |
| Sex | ||||||||
| Female | 2.70 | .00 | 2.63 | .00 | 0.41 | .00 | −0.01 | .02 |
| Marital status | ||||||||
| Married | 1.04 | .17 | 1.01 | .64 | 0.02 | .19 | −0.04 | .00 |
| Education attainment | ||||||||
| No high school degree | Reference | Reference | Reference | Reference | ||||
| High school degree | 1.22 | .00 | 1.20 | .00 | 0.11 | .00 | 0.01 | .08 |
| College degree | 2.39 | .00 | 2.20 | .00 | 0.25 | .00 | 0.02 | .00 |
| Advanced degree | 2.18 | .00 | 1.97 | .00 | 0.28 | .00 | 0.01 | .09 |
| Household income | ||||||||
| <100% federal poverty line (FPL) | Reference | Reference | Reference | Reference | ||||
| 100–200% FPL | 1.04 | .36 | 1.02 | .63 | −0.01 | .62 | 0.01 | .01 |
| >200% FPL | 1.27 | .00 | 1.28 | .00 | 0.08 | .00 | 0.00 | .71 |
| Employment status | ||||||||
| Unemployed | 1.04 | .33 | 1.04 | .29 | 0.27 | .00 | −0.01 | .00 |
| Health status | ||||||||
| Poor | Reference | Reference | Reference | Reference | ||||
| Fair | 0.44 | .00 | 0.43 | .00 | −0.58 | .00 | 0.03 | .00 |
| Good | 0.25 | .00 | 0.26 | .00 | −1.09 | .00 | 0.07 | .00 |
| Very good | 0.21 | .00 | 0.21 | .00 | −1.39 | .00 | 0.09 | .00 |
| Excellent | 0.15 | .00 | 0.15 | .00 | −1.63 | .00 | 0.11 | .00 |
| Health insurance | ||||||||
| Uninsured | Reference | Reference | Reference | Reference | ||||
| Private non-HMO | 0.37 | .00 | 0.43 | .00 | −0.60 | .00 | 0.42 | .00 |
| Private HMO | 1.04 | .28 | 1.03 | .26 | 0.09 | .00 | 0.03 | .00 |
| Medicaid | 1.21 | .00 | 0.49 | .00 | 0.20 | .00 | −0.14 | .00 |
| Medicare | 1.35 | .04 | 1.62 | .00 | 0.36 | .00 | 0.06 | .00 |
| Other public insurance | 1.51 | .11 | 1.70 | .02 | 0.06 | .48 | 0.21 | .00 |
| Usual source of care | 3.14 | .00 | 2.87 | .00 | 0.45 | .00 | −0.08 | .00 |
| Interview language | ||||||||
| English response | 1.20 | .00 | 1.19 | .00 | 0.22 | .00 | −0.02 | .01 |
| Location | ||||||||
| Urban | 1.06 | .06 | 1.03 | .31 | 0.07 | .00 | −0.02 | .00 |
| Census region | ||||||||
| Northeast | Reference | Reference | Reference | Reference | ||||
| Midwest | 1.04 | .43 | 1.09 | .03 | 0.09 | .00 | 0.01 | .18 |
| South | 0.94 | .15 | 1.08 | .03 | 0.03 | .17 | 0.05 | .00 |
| West | 0.98 | .65 | 1.02 | .56 | 0.02 | .24 | 0.02 | .00 |
| Survey year | ||||||||
| 2000 | Reference | Reference | Reference | Reference | ||||
| 2001 | 1.14 | .01 | 1.10 | .03 | 0.12 | .00 | −0.01 | .09 |
| 2002 | 1.15 | .01 | 1.11 | .02 | 0.12 | .00 | −0.01 | .32 |
| 2003 | 1.21 | .00 | 1.15 | .00 | 0.14 | .00 | 0.00 | .38 |
| 2004 | 1.05 | .33 | 1.03 | .59 | 0.17 | .00 | −0.01 | .02 |
| 2005 | 1.11 | .04 | 1.08 | .11 | 0.17 | .00 | −0.01 | .02 |
| 2006 | 1.09 | .09 | 1.06 | .25 | 0.13 | .00 | −0.01 | .29 |
| 2007 | 1.14 | .01 | 1.07 | .18 | 0.11 | .00 | −0.03 | .00 |
| Constant | 6.86 | .00 | 0.37 | .00 | ||||
| R2 | 0.22 | 0.20 | 0.22 | 0.23 | ||||
| N | 107,535 | 107,535 | 87,419 | 82,998 | ||||
Notes. Data sources: Medical Expenditure Panel Survey and National Health Interview Survey (2000–2007).
Models in columns 1 and 2 run regressions among all individuals in our sample. Regressions in columns 3 and 4 are conditional on reporting any health spending. All regression models include year fixed effects.
OOP, out -f-pocket expenditures.
On average, Latinos are less likely to report any health expenditure (OR: 0.60) or OOP spending (OR: 0.62). Among foreign-born Latinos, naturalized Latinos ≤10 years (OR: 0.77) and noncitizen Latinos (OR: 0.85), regardless of time of U.S. residence, have the lowest likelihood of reporting any health expenditure. Likewise, naturalized ≤10 years (OR: 0.76) and noncitizen Latinos (OR: 0.81 for ≤10 years and OR: 0.87 for >10 years) report the lowest probability of experiencing any OOP payments compared with whites. These differences are all statistically significant.
No difference in the likelihood of health expenditure and OOP spending exists between naturalized individuals with >10 years in the country and the reference group. Overall, individuals in older age cohorts (>45), women, individuals with more than high school, with a family income above 200 percent federal poverty level (FPL), with a poor health status, insured by Medicaid, Medicare, or private non-HMO insurers, with a usual source of care and who answered the survey in English are more likely to experience health expenditures. Similar results apply to OOP spending.
Model 3 in Table 2 shows disparities on total health expenditure among those individuals who report any. On average Latinos spend 25 percent less than whites. Health expenditure declines significantly for naturalized ≤10 years (−9 percent), noncitizen Latinos (−16 percent for ≤10 years and −9 percent for >10 years), those with less than high school, lower income, and among the uninsured. In contrast, health expenditure increases with age, among women, the unemployed, those with non-HMO private insurance, Medicaid, Medicare, a poor self-reported health status, usual source of care, and among those who answer the survey in English, live in urban areas and live in the Midwest.
Model 4 in Table 2 shows the share of OOP spending among individuals with any. Disparities between Latinos and whites are nonstatistically significant. The share of OOP expenditures with respect to total health expenditures, however, increases for naturalized Latinos with ≤10 years (1 percent); noncitizens (2 percent for ≤10 years and >10 years); those with college degrees, incomes above 100 percent of FPL, with self-perceived fair, good, very good, or excellent health status; the uninsured; individuals enrolled in non-HMO private health insurance, Medicare, and other public health insurance plans; and among individuals living in the south and the west. The OOP share declines for married individuals, women, and the unemployed, recipients of Medicaid, with a usual source of care, among those who answer the survey in English, and live in urban areas.
To address the endogenous relationship between health insurance status and other observed and unobserved factors, we implement a stratified analysis by insurance status to check the sensitivity of previous results. Table 3 details the outcomes of this analysis. It is important to mention that it takes into account all explanatory variables in the model, but they are not shown for brevity. Latino–white disparities in the three outcome measures (i.e., likelihood of health expenditures, probability of reporting OOP, total health spending if any) remain strongly statistically significant among the uninsured (OR: 0.06, OR: 0.59, −30 percent) and the privately (OR: 0.60, OR: 0.64, −26 percent) and publicly (OR: 0.59, OR: 0.61, −26 percent) insured populations. These results confirm the robustness of health expenditure disparities between Latinos and whites.
Table 3.
Multivariate Regressions for Any Heath Spending/OOP and Amount of Payment by Health Insurance Status
| Any Health Expenditures | Any OOP | Total Expenditure if Any | OOP Share if Any | |||||
|---|---|---|---|---|---|---|---|---|
| Odds Ratios | p-Value | Odds Ratios | p-Value | Coefficient | p-Value | Coefficient | p-Value | |
| Model 1: uninsured population | ||||||||
| Race/ethnicity | ||||||||
| Whites | Reference | Reference | Reference | Reference | ||||
| Latinos | 0.61 | .00 | 0.59 | .00 | −0.30 | .00 | −0.01 | .50 |
| Citizenship/years in the United States | ||||||||
| U.S.-born | Reference | Reference | Reference | Reference | ||||
| Naturalized citizens | ||||||||
| ≤10 years | 0.77 | .24 | 0.77 | .22 | 0.11 | .55 | 0.06 | .07 |
| >10 years | 1.03 | .78 | 1.06 | .59 | −0.02 | .83 | 0.04 | .04 |
| Noncitizen | ||||||||
| ≤10 years | 0.93 | .38 | 0.93 | .38 | −0.03 | .71 | 0.03 | .12 |
| >10 years | 1.00 | .97 | 1.01 | .92 | −0.13 | .08 | 0.06 | .00 |
| Model 2: privately-insured population | ||||||||
| Race/ethnicity | ||||||||
| Whites | Reference | Reference | Reference | Reference | ||||
| Latinos | 0.60 | .00 | 0.64 | .00 | −0.26 | .00 | 0.00 | .45 |
| Citizenship/years in the United States | ||||||||
| U.S.-born | Reference | Reference | Reference | Reference | ||||
| Naturalized citizens | ||||||||
| <10 years | 0.76 | .17 | 0.65 | .04 | −0.09 | .01 | 0.00 | .86 |
| ≥10 years | 1.03 | .76 | 1.01 | .91 | −0.06 | .58 | 0.00 | .54 |
| Noncitizen | ||||||||
| ≤10 years | 0.78 | .02 | 0.78 | .01 | −0.07 | .29 | 0.02 | .14 |
| >10 years | 0.75 | .00 | 0.80 | .01 | −0.13 | .01 | 0.00 | .73 |
| Model 3: Population with public insurance only | ||||||||
| Race/ethnicity | ||||||||
| Whites | Reference | Reference | Reference | Reference | ||||
| Latinos | 0.59 | .00 | 0.61 | .00 | −0.26 | .00 | −0.01 | .54 |
| Citizenship/years in the United States | ||||||||
| U.S.-born | Reference | Reference | Reference | Reference | ||||
| Naturalized citizens | ||||||||
| <10 years | 1.36 | .52 | 1.85 | .04 | −0.19 | .03 | −0.05 | .18 |
| ≥10 years | 1.12 | .59 | 0.99 | .96 | 0.14 | .41 | 0.02 | .24 |
| Noncitizen | ||||||||
| ≤10 years | 0.73 | .09 | 0.57 | .00 | −0.34 | .00 | 0.03 | .29 |
| >10 years | 0.74 | .06 | 0.77 | .04 | −0.36 | .00 | 0.02 | .43 |
Notes. Data sources: Medical Expenditure Panel Survey and National Health Interview Survey (2000–2007).
All explantory variables in each model are excluded for brevity, but they are available from the authors.
OOP, out-of-pocket expenditures.
In the case of the citizenship/nativity status and time of U.S. residence, the stratified analyses show that among the uninsured, noncitizen Latinos >10 years are more likely to report a higher OOP share of total health expenditure (6 percent). For those in the privately insured group, Latino–white disparities remain for the two categories of noncitizen Latinos on the likelihood of reporting health expenditures (OR: 0.78 for ≤10 years and OR: 0.75 for >10 years) and the probability of reporting OOP spending (OR: 0.78 for ≤10 years and OR: 0.80 for >10 years); however, total health expenditure disparities are robust only in the >10 years category (−13 percent). Among those who are publicly insured, Latino–white disparities remain for the two categories of non-citizen Latinos on the probability of reporting OOP spending (OR: 0.57 for ≤10 years and OR: 0.77 for >10 years) and total health expenditure (−34 percent for ≤10 years and −36 percent for >10 years), although the likelihood of reporting any health spending is robust only in the >10 years category (OR: 0.74).
Latino–white disparities among naturalized Latinos exist in three categories. Among the uninsured, naturalized Latinos >10 years are more likely to report a higher OOP share of health spending (4 percent). For those in the privately insured group, Latino–white disparities remain for naturalized Latinos ≤10 years on the probability of reporting any OOP spending (OR: 0.65) and on total health expenditure (−9 percent). Among those who are publicly insured, Latino–white disparities exist for naturalized Latinos ≤10 years on the probability of reporting any OOP spending (OR: 1.85) and on total health expenditure (−19 percent).
One of the main objectives of our study is to parse out differences into observed and unobserved factors that affect the probability of incurring health expenditures, the total amount spent, and the OOP share of health spending. Table 4 details the results of the decomposition analysis, taking into account all explanatory variables in the model. Each decomposition model includes the same explanatory variables as the multivariable models. For brevity, the decomposition analyses only list statistically significant explanatory variables.
Table 4.
Decomposition Results for Health Care Expenditure among Whites and Latino Citizenship/Nativity Category by Time of Residence in the United States
| Latinos | Noncitizen Latinos ≤10 Years | Noncitizen Latinos >10 Years | Naturalized Latinos ≤10 Years | Naturalized Latinos >10 Years | U.S.-Born Latinos | |
|---|---|---|---|---|---|---|
| Model 1: probability of any health expenditures | ||||||
| Whites (reference group): predicted value=0.88 | ||||||
| Predicted value | 0.68 | 0.53 | 0.61 | 0.64 | 0.77 | 0.73 |
| Total difference | −0.20 | −0.35 | −0.27 | −0.24 | −0.11 | −0.15 |
| Total explained | −0.15 | −0.26 | −0.17 | −0.13 | −0.05 | −0.11 |
| Significant individual factors (% of total difference) | ||||||
| Age | 5 | 5 | −12 | 9 | ||
| Education attainment | 11 | 9 | 15 | 8 | 14 | |
| Uninsured | 21 | 24 | 18 | 53 | 21 | 15 |
| Usual source of care | 24 | 25 | 28 | 40 | 22 | 21 |
| English response | 10 | 12 | 10 | 7 | ||
| Model 2: ln(total health expenditures) | ||||||
| Whites (reference group): predicted value=7.27 | ||||||
| Predicted value | 6.70 | 6.31 | 6.47 | 6.76 | 6.95 | 6.79 |
| Total difference | −0.57 | −0.95 | −0.80 | −0.51 | −0.32 | −0.48 |
| Total explained | −0.27 | −0.73 | −0.39 | −0.32 | −0.01 (NS) | −0.19 |
| Significant individual factors (% of total difference) | ||||||
| Age | 16 | 20 | 6 | 25 | 29 | |
| Education attainment | 11 | 9 | 14 | 12 | 9 | |
| Worse health status | −16 | −21 | −19 | −12 | ||
| Uninsured | 17 | 25 | 21 | 19 | 8 | |
| Usual source of care | 10 | 14 | 10 | 14 | 8 | |
| Model 3: OOP share | ||||||
| Whites (reference group): predicted OOP share=0.39 | ||||||
| Predicted value | 0.45 | 0.58 | 0.51 | 0.43 | 0.41 | 0.41 |
| Total difference | 0.06 | 0.19 | 0.12 | 0.04 | 0.02 | 0.02 |
| Total explained | 0.06 | 0.16 | 0.09 | 0.04 | 0.01 | 0.02 |
| Significant individual factors (% of total difference) | ||||||
| Education attainment | −6 | −16 | −16 | −10 | ||
| Worse health status | −12 | −10 | −40 | −49 | −22 | |
| Uninsured | 112 | 91 | 100 | 340 | 189 | 140 |
| Medicaid | −18 | −6 | −10 | −101 | −50 | −48 |
| Usual source of care | 15 | 11 | 11 | 69 | 21 | 32 |
Notes. Data sources: Medical Expenditure Panel Survey and National Health Interview Survey (2000–2007). Factors that explain 5% or higher of the total differences are reported. Nonsignificant results for each decomposition model are excluded for brevity. All regression models include year fixed effects. Among individual factors, positive/negative coefficients indicate the share of explanatory variables positively/negatively associated with health spending disparities. The share of observed characteristics explained by the model is the ratio of total explained over total differences. For example, the share of observed characteristics between Latinos and whites for outcome 1 is −0.15/−0.20=75%. The remaining share (25%) corresponds to unobserved heterogeneity.
NS, nonsignificant difference with the reference category; OOP, out-of-pocket expenditures.
Our results confirm the reduced probability of experiencing health expenditures for all Latino categories: noncitizen Latinos (−35 percent for ≤10 years and −27 percent for >10 years), naturalized (−24 percent for ≤10 years and −11 for >10 years), and U.S.-born Latinos (−15 percent). Observed differences explain 75 percent of health expenditure disparities between whites and Latinos (i.e., from a 0.20 difference between the predicted probabilities of Latinos and whites, 0.15 is explained by the model; 0.15/0.20=75 percent). Among Latino groups, the share of observed differences that is explained by the model is 74 percent (≤10 years) and 63 percent (>10 years) for noncitizen, 54 percent (≤10 years) and 45 percent (>10 years) for naturalized, and 73 percent for U.S.-born Latinos. Significant explanatory variables associated with these disparities are insurance status, having a usual source of care, education attainment, responding to the survey in English, and age.
Differences for the natural log of health expenditure, if any, confirm the reduced amount of health expenditures for all Latino categories: −95 percent (≤10 years) and −80 percent (>10 years) for noncitizen Latinos, −51 percent (≤10 years) and −32 percent (>10 years) for naturalized, and −48 percent for U.S.-born Latinos. Once again, disparities are more pronounced for noncitizen Latinos. Observed differences explain 47 percent of health expenditure disparities between Latinos and whites. Among Latino groups, the share of observed differences that is explained by the model is 76 percent (≤10 years) and 48 percent (>10 years) for noncitizen, 62 percent (≤10 years) for naturalized, and 40 percent for U.S.-born Latinos. Differences among naturalized Latinos >10 years are nonsignificant. Explanatory variables associated with these disparities are insurance status, having a usual source of care, age, education attainment, and worse health status.
Estimated differences for the OOP share of total health expenditures are 19 percent (≤10 years) and 12 percent (>10 years) for noncitizen Latinos, 4 percent (≤10 years) and 2 percent (>10 years) for naturalized, and 2 percent for U.S.-born Latinos. These results show a higher OOP share of health expenditures among noncitizen Latinos. Observed differences explain approximately 100 percent of the OOP share of spending disparities between whites and Latinos. Among Latino groups, the share of observed differences that is explained by the model is 84 percent (≤10 years) and 75 percent (>10 years) for noncitizen, 100 percent (≤10 years) and 50 percent (>10 years) for naturalized, and 100 percent for U.S.-born Latinos. Significant explanatory variables associated with these disparities are insurance status, having a usual source of care, education attainment, worse health status, and being in Medicaid.
DISCUSSION
This study investigates health expenditure disparities among Latinos by time of U.S. residence and citizenship/nativity status. Particularly, we analyze if low spending among foreign-born Latinos contributes to health expenditure disparities between Latinos and whites, if disparities decline the longer foreign-born Latinos remain in the country, and if lower spending among Latinos is related to the self-selection of foreign-born Latinos. Our results support our hypotheses.
In the two-part, stratified and decomposition analyses, noncitizen Latinos consistently demonstrate lower health expenditure than whites and other Latino categories and a higher OOP share of total health spending. We also compare whether disparities decline the longer foreign-born Latinos stay in the country. Overall, in the four outcome measures (i.e., likelihood of reporting any spending or OOP, the total amount of health expenditures, and the OOP share) disparities narrow or disappear for naturalized Latinos the longer they reside in the country in the two-part, stratified and decomposition analyses.
These findings provide evidence on the gradual convergence of health expenditure between whites and naturalized Latinos. Lower spending among naturalized Latinos ≤10 years is likely to be related to what is known as the healthy immigrant effect, one feature of positive self-selection (McDonald and Kennedy 2004). A reduced health spending among this group could also relate to the lack of familiarity with the U.S. health care system among foreign-born individuals. In all comparisons that exclude naturalized Latinos ≤10 years, disparities between native-born and foreign-born Latinos are less pronounced. It could be interpreted as evidence of intergenerational improvement and of gradual assimilation of the Latino population in the United States.
For noncitizen Latinos, disparities remain relatively constant or they decline slightly in the two-part and decomposition analyses. These findings should be interpreted with caution, because almost 52 percent of legal foreign-born residents in the United States become citizens (Passel 2007). The transition from noncitizen to naturalized is often lengthy depending on several factors (Anderson and Miller 2006). It is likely that by the time most noncitizen ≤10 become U.S. citizens, they are accounted for under the naturalized citizen >10 years category, which shows no difference with the white population on total health expenditure or the OOP share. Our findings, however, also show that among those who remain in the noncitizen category >10 years, overall disparities remain constant or diminish but on a lesser extent.
It is important to highlight the results of noncitizen Latinos in the stratified analysis. Health-spending disparities are mostly observed among the insured population. Disparities increase over time on total health expenditure for noncitizen Latinos >10 years among those with public and private health insurance. Lower spending from this population could be related to limited eligibility for public plan coverage, to the lack of familiarity with the U.S. health care system, or to more reliance on cross-border health services (Bustamante, Ojeda, and Castaneda 2008).
While most of our results hold in our sensitivity analysis, the analysis by insurance status shows that it is important to account for observed and unobserved factors to estimate the share of disparities that are due to socioeconomic and demographic characteristics and unobserved heterogeneity. Observed measures that characterize the selection of foreign-born Latinos, such as age, health status, health insurance coverage, and usual source of care appear to be the most consistent determinants of health spending differences. While most differences are explained by observable characteristics (45–100 percent), considerable shares of disparities are due to unobserved factors, which should be accounted for on racial/ethnic disparities research. Our results demonstrate that in the absence of immigrant self-selection, particularly noncitizen and naturalized Latinos ≤10 years, differences in health expenditure between Latinos and whites would narrow considerably.
According to our results, individuals in older age cohorts are more likely to experience health expenditures and they also spend more. Interestingly, while age positively accounts for health expenditure disparities between whites, noncitizen Latinos, and U.S.-born Latinos, it negatively accounts for disparities between whites and naturalized Latinos >10 years. This difference is likely to be related to the older composition of naturalized Latinos compared with whites.
Health status negatively contributes to disparities between Latinos and whites for the OOP share and total health expenditures among those with any spending. Latinos in all categories with worse health status experience lower spending and a lower OOP share of health expenditure. In addition to reporting worse health, Latinos still experience lower health care expenditure. The negative signs of the worse health status coefficients show that if Latinos were as healthy as whites, their health care expenditures would still be lower.
Insurance coverage and having a usual source of care are significant explanatory variables in all health expenditure measures in this study. With the recent approval of the Patient Protection and Affordable Care Act, U.S.-born Latinos who are currently uninsured and documented immigrants will have similar entitlements to those of U.S. citizens. The coverage expansion to lower-income individuals (<400 percent FPL) is likely to benefit more U.S.-born Latinos and documented immigrants compared with other ethnic/racial groups with higher shares of insurance coverage. By contrast, undocumented immigrants are excluded from the health insurance mandate but also from the possibility to purchase subsidized health insurance coverage (Rodriguez, Bustamante, and Ang 2009; Kaiser Commision on Medicaid and the Uninsured 2010; Vargas Bustamante et al. 2011). Future research should analyze whether different eligibility criteria among documented and undocumented immigrants would lead to the polarization of Latino–white health spending disparities.
Limitations
While the NHIS recorded if Latinos were U.S.-born, naturalized, or noncitizens, it did not identify undocumented individuals. Undocumented immigrants are likely to be overrepresented among noncitizen Latinos, because approximately 78 percent of undocumented immigrants are from Mexico and other Latin American countries (Passel 2006). The inclusion of undocumented status in the United States could have increased the share of differences in health expenditures explained by observed sociodemographic and economic factors. Health expenditures data were self-reported, and they may be subject to measurement error. The large sample size of this study may influence the statistical significance of some coefficients.
Previous research has documented health consumption and spending heterogeneity across states, which could be related with the uneven distribution of providers and health care professionals (Hargraves and Hadley 2003). Because Latinos cluster in certain geographic regions, health expenditure would be influenced by these factors. While the analysis distinguishes among four U.S. regions (i.e., northeast, midwest, south, and west), it could benefit from state-level information to account for the regional factors that influence health spending. Future research should use longitudinal data and more detailed state-level and regional data to address the endogenous relationship among insurance, health care supply, and health spending.
CONCLUSION
This is the first study that to our knowledge pictures the observed and unobserved share of health spending disparities among Latinos by time of U.S. residence and citizenship/nativity status. Because foreign-born U.S. residents are less likely to spend on health care, we investigate whether increasing Latino–white disparities could be related to the high share of foreign-born individuals among Latinos compared with other racial/ethnic groups. While Latino–white disparities are large among foreign-born Latinos ≤10 years, our findings provide preliminary evidence of the gradual convergence of health spending between foreign-born Latinos and whites, particularly in the naturalized <10 years category. A second relevant finding is that health spending disparities among noncitizen Latinos remain large over time, which could partly contribute to lower average spending among Latinos as a group. We further hypothesize that lower health expenditure among Latinos could be explained by the self-selection of the foreign born. Our study shows that differences are largely explained by related factors such as a relatively young age, low income, fewer years of schooling, good health status, and lower health care access and utilization. Our findings highlight the importance of health insurance coverage and usual source of care to explain inequalities between Latinos and whites.
SUPPORTING INFORMATION
Additional supporting information may be found in the online version of this article:
Appendix SA1: Author Matrix.
Please note: Wiley-Blackwell is not responsible for the content or functionality of any supporting materials supplied by the authors. Any queries (other than missing material) should be directed to the corresponding author for the article.
REFERENCES
- AHRQ. Medical Expenditure Panel Survey. Washington, DC: Agency for Health Research and Quality; 2008. [accessed on August 9]. Available at http://www.meps.ahrq.gov/mepsweb/ [Google Scholar]
- Anderson S, Miller D. Legal Immigrants: Waiting Forever. Washington, DC: National Foundation for American Policy; 2006. [Google Scholar]
- Blinder AS. Wage Discrimination—Reduced Form and Structural Estimates. Journal of Human Resources. 1973;8((4)):436–55. [Google Scholar]
- Borjas GJ. The Labor Demand Curve Is Downward Sloping. Quarterly Journal of Economics. 2003;118((4)):1335–74. Reexamining the Impact of Immigration on the Labor Market. [Google Scholar]
- Bustamante AV, Fang H, Rizzo JA, Ortega AN. Heterogeneity in Health Insurance Coverage among US Latino Adults. Journal of General Internal Medicine. 2009;24((suppl 3)):561–6. doi: 10.1007/s11606-009-1069-7. [DOI] [PMC free article] [PubMed] [Google Scholar]
- Bustamante AV, Ojeda G, Castaneda X. Willingness to Pay for Cross-Border Health Insurance between the United States and Mexico. Health Affairs (Millwood) 2008;27((1)):169–78. doi: 10.1377/hlthaff.27.1.169. [DOI] [PubMed] [Google Scholar]
- Card D. Immigrant Inflows, Native Outflows, and the Local Labor Market Impacts of Higher Immigration. Journal of Labor Economics. 2001;19((1)):22–64. [Google Scholar]
- Center for Medicare and Medicaid Services. National Health Expenditures 2009 Highlights. Washington, DC: Center for Medicare and Medicaid Services; 2010. [Google Scholar]
- Chen J, Fang H, Vargas-Bustamante A, Rizzo JA, Ortega AN. Latino Disparities in Prescription Drug Use and Expenditures. Annals of Pharmacotherapy. 2010;44((1)):57–69. doi: 10.1345/aph.1M467. A Nationally Representative Analysis. [DOI] [PubMed] [Google Scholar]
- Chiswick BR, Lee YL, Miller PW. Immigrant Earnings. Review of Income and Wealth. 2005;51((4)):485–503. A Longitudinal Analysis. [Google Scholar]
- Cook BL, Manning WG. Measuring Racial/Ethnic Disparities across the Distribution of Health Care Expenditures. Health Services Research. 2009;44((5, part 1)):1603–21. doi: 10.1111/j.1475-6773.2009.01004.x. [DOI] [PMC free article] [PubMed] [Google Scholar]
- Cook BL, McGuire T, Miranda J. Measuring Trends in Mental Health Care Disparities, 2000–2004. Psychiatric Services. 2007;58((12)):1533–40. doi: 10.1176/ps.2007.58.12.1533. [DOI] [PubMed] [Google Scholar]
- Cragg JG. Some Statistical Models for Limited Dependent Variables with Application to Demand for Durable Goods. Econometrica. 1971;39((5)):829–44. [Google Scholar]
- DiMassa G, Escarce JJ. Insurance and Health Care Expenditures. Annals of Internal Medicine. 2007;146((11)):814–5. doi: 10.7326/0003-4819-146-11-200706050-00010. What's the Real Question? [DOI] [PubMed] [Google Scholar]
- Escarce JJ, Kapur K. Racial and Ethnic Differences in Public and Private Medical Care Expenditures among Aged Medicare Beneficiaries. Milbank Quarterly. 2003;81((2)):249–75. doi: 10.1111/1468-0009.t01-1-00053. 172. [DOI] [PMC free article] [PubMed] [Google Scholar]
- Freiman MP, Cunningham PJ. Use of Health Care for the Treatment of Mental Problems among Racial/Ethnic Subpopulations. Medical Care Research and Review. 1997;54((1)):80–100. doi: 10.1177/107755879705400105. [DOI] [PubMed] [Google Scholar]
- Goldberger AS. Econometric Theory. New York: John Wiley & Sons; 1964. [Google Scholar]
- Hargraves JL, Hadley J. The Contribution of Insurance Coverage and Community Resources to Reducing Racial/Ethnic Disparities in Access to Care. Health Services Research. 2003;38((3)):809–29. doi: 10.1111/1475-6773.00148. [DOI] [PMC free article] [PubMed] [Google Scholar]
- Jann B. The Blinder–Oaxaca Decomposition for Linear Regression Models. Stata Journal. 2008;8((4)):453–79. [Google Scholar]
- Kaiser Commission on Medicaid and the Uninsured. 2010. Summary of New Health Reform Law. Focus on Health Care Kaiser Family Foundation.
- Ku L. Health Insurance Coverage and Medical Expenditures of Immigrants and Native-Born Citizens in the United States. American Journal of Public Health. 2009a;99((7)):1322–8. doi: 10.2105/AJPH.2008.144733. [DOI] [PMC free article] [PubMed] [Google Scholar]
- Ku L. Medical and Dental Care Utilization and Expenditures under Medicaid and Private Health Insurance. Medical Care Research and Review. 2009b;66((4)):456–71. doi: 10.1177/1077558709334896. [DOI] [PubMed] [Google Scholar]
- Le Cook B, McGuire TG, Zuvekas SH. Measuring Trends in Racial/Ethnic Health Care Disparities. Medical Care Research and Review. 2009;66((1)):23–48. doi: 10.1177/1077558708323607. [DOI] [PMC free article] [PubMed] [Google Scholar]
- Manning WG, Bailit HL, Benjamin B, Newhouse JP. The Demand for Dental-Care—Evidence from a Randomized Trial in Health-Insurance. Journal of the American Dental Association. 1985;110((6)):895–902. doi: 10.14219/jada.archive.1985.0031. [DOI] [PubMed] [Google Scholar]
- Manning WG, Mullahy J. Estimating Log Models. Journal of Health Economics. 2001;20((4)):461–94. doi: 10.1016/s0167-6296(01)00086-8. To Transform or Not to Transform? [DOI] [PubMed] [Google Scholar]
- McDonald JT, Kennedy S. Insights into the ‘Healthy Immigrant Effect’. Social Science and Medicine. 2004;59((8)):1613–27. doi: 10.1016/j.socscimed.2004.02.004. Health Status and Health Service Use of Immigrants to Canada. [DOI] [PubMed] [Google Scholar]
- McGuire TG, Alegria M, Cook BL, Wells KB, Zaslavsky AM. Implementing the Institute of Medicine Definition of Disparities. Health Services Research. 2006;41((5)):1979–2005. doi: 10.1111/j.1475-6773.2006.00583.x. An Application to Mental Health Care. [DOI] [PMC free article] [PubMed] [Google Scholar]
- Mohanty SA, Woolhandler S, Himmelstein DU, Pati S, Carrasquillo O, Bor DH. Health Care Expenditures of Immigrants in the United States. American Journal of Public Health. 2005;95((8)):1431–8. doi: 10.2105/AJPH.2004.044602. A Nationally Representative Analysis. [DOI] [PMC free article] [PubMed] [Google Scholar]
- Monheit AC, Vistnes JP. Race/Ethnicity and Health Insurance Status. Medical Care Research and Review. 2000;57((suppl 1)):11–35. doi: 10.1177/1077558700057001S02. 1987 and 1996. [DOI] [PubMed] [Google Scholar]
- Oaxaca RL, Ransom MR. On Discrimination and the Decomposition of Wage Differentials. Journal of Econometrics. 1994;61((1)):5–21. [Google Scholar]
- Passel JS. Size and Characteristics of the Unauthorized Migrant Population in the U.S. Washington, DC: PEW Hispanic Center; 2006. [Google Scholar]
- Passel JS. Growing Share of Immigrants Choosing Naturalization. Washington, DC: PEW Hispanic Center; 2007. [Google Scholar]
- Passel JS, Cohn DV. U.S. Population Projections: 2005–2050. Washington, DC: PEW Hispanic Center; 2008. [Google Scholar]
- PEW Hispanic Center. Statistical Portrait of the Foreign-Born Population in the United States. Washington, DC: PEW Hispanic Center; 2009. [Google Scholar]
- PEW Hispanic Center. 2008. “Statistical Portrait of Hispanics in the United States, 2006” [accessed on October 31, 2008]. Available at http://pewhispanic.org/factsheets/factsheet.php?FactsheetID=35.
- Rodriguez MA, Bustamante AV, Ang A. Perceived Quality of Care, Receipt of Preventive Care, and Usual Source of Health Care among Undocumented and Other Latinos. Journal of General Internal Medicine. 2009;24((suppl 3)):508–13. doi: 10.1007/s11606-009-1098-2. [DOI] [PMC free article] [PubMed] [Google Scholar]
- Stanton M. The High Concentration of U.S. Health Care Expenditures. Research in Action. Washington, DC: Agency for Healthcare Research and Quality; 2006. [Google Scholar]
- United States National Center for Health Statistics. National Health Interview Survey. Hyattsville, MD: National Center for Health Statistics, Centers for Disease Control and Prevention; 2008. [accessed on August 9]. Available at http://www.cdc.gov/nchs/nhis.htm. [Google Scholar]
- U.S. Census. The Foreign-Born Labor Force in the United States: 2007. Washington, DC: U. S. Census Bureau; 2009. [Google Scholar]
- Vargas Bustamante A. The Tradeoff between Centralized and Decentralized Health Services. Social Science and Medicine. 2010;71((5)):925–34. doi: 10.1016/j.socscimed.2010.05.022. Evidence from Rural Areas in Mexico. [DOI] [PubMed] [Google Scholar]
- Vargas Bustamante A, Chen J, Rodriguez HP, Rizzo JA, Ortega AN. Use of Preventive Care Services among Latino Subgroups. American Journal of Preventive Medicine. 2010;38((6)):610–9. doi: 10.1016/j.amepre.2010.01.029. [DOI] [PubMed] [Google Scholar]
- Vargas Bustamante A, Fang H, Garza J, Carter-Pokras O, Wallace SP, Rizzo JA, Ortega AN. Variations in Healthcare Access and Utilization among Mexican Immigrants. Journal of Immigrants Minor Health. 2011 doi: 10.1007/s10903-010-9406-9. The Role of Documentation Status. [DOI] [PMC free article] [PubMed] [Google Scholar]
- Vargas Bustamante A, Fang H, Rizzo JA, Ortega AN. Understanding Observed and Unobserved Health Care Access and Utilization Disparities among US Latino Adults. Medical Care Research and Review. 2009;66((5)):561–77. doi: 10.1177/1077558709338487. [DOI] [PubMed] [Google Scholar]
- Waidmann TA, Rajan S. Race and Ethnic Disparities in Health Care Access and Utilization. Medical Care Research and Review. 2000;57((suppl 1)):55–84. doi: 10.1177/1077558700057001S04. An Examination of State Variation. [DOI] [PubMed] [Google Scholar]
- Weinick RM, Zuvekas SH, Cohen JW. Racial and Ethnic Differences in Access to and Use of Health Care Services, 1977 to 1996. Medical Care Research and Review. 2000;57((suppl 1)):36–54. doi: 10.1177/1077558700057001S03. [DOI] [PubMed] [Google Scholar]
- Wooldridge J. Econometric Analysis of Cross-Section and Panel Data. Cambridge, MA: Massachusetts Institute of Technology; 2002. [Google Scholar]
- Zuvekas SH, Taliaferro GS. Pathways to Access. Health Affairs (Millwood) 2003;22((2)):139–53. doi: 10.1377/hlthaff.22.2.139. Health Insurance, the Health Care Delivery System, and Racial/Ethnic Disparities, 1996–1999. [DOI] [PubMed] [Google Scholar]
Associated Data
This section collects any data citations, data availability statements, or supplementary materials included in this article.