

Abstract
Objective
To assess accessibility and affordability of health care in eight countries of the former Soviet Union.
Data Sources/Study Setting
Primary data collection conducted in 2010 in Armenia, Azerbaijan, Belarus, Georgia, Kazakhstan, Moldova, Russia, and Ukraine.
Study Design
Cross-sectional household survey using multistage stratified random sampling.
Data Collection/Extraction Methods
Data were collected using standardized questionnaires with subjects aged 18+ on demographic, socioeconomic, and health care access characteristics. Descriptive and multivariate regression analyses were used.
Principal Findings
Almost half of respondents who had a health problem in the previous month which they viewed as needing care had not sought care. Respondents significantly less likely to seek care included those living in Armenia, Georgia, or Ukraine, in rural areas, aged 35–49, with a poor household economic situation, and high alcohol consumption. Cost was most often cited as the reason for not seeking health care. Most respondents who did obtain care made out-of-pocket payments, with median amounts varying from $13 in Belarus to $100 in Azerbaijan.
Conclusions
Access to health care and within-country inequalities appear to have improved over the past decade. However, considerable problems remain, including out-of-pocket payments and unaffordability despite efforts to improve financial protection.
Keywords: Access, former Soviet Union, health systems, equity, out-of-pocket payments
Research on what has been termed global health is geographically uneven. Much of the published literature can be divided into two categories; that addressing issues which are truly global, such as climate change, pandemic influenza, and global health institutions and that addressing issues affecting low-income countries, especially those in sub-Saharan Africa and South Asia. By contrast, there is remarkably little on regions containing middle-income countries, such as the former Soviet Union, the Middle East and North Africa, and the Pacific Islands. Among middle- and low-income countries, a few, such as Bangladesh, Thailand, and Uganda, have been the subject of intensive research while others are almost absent from the literature.
In this study, we examine access to care and its determinants in the context of rapid and diverse change in the funding and delivery of health care in one of these neglected regions, the former Soviet Union, two decades after these countries gained independence. Each country has followed a different trajectory of health system change, and we seek to take a snapshot of access to services for those who believe they need care.
Now is an appropriate time to take stock. The first decade following independence involved a process of state building, as politicians struggled with a new reality in which the old political and economic dogma no longer applied. They all faced catastrophic financial problems and, in some, gross domestic product per capita has not yet returned to 1989 levels. Others recovered more rapidly, but this was often as a consequence of profits from oil, gas, and minerals that were concentrated in the hands of a few. Within the available resources countries varied in how much governments were willing to allocate to public budgets and, in turn, the priority they gave to the health budget (Kutzin, Cashin, and Jakab 2010) (Table 1). In those newly independent states most affected, the Semashko health system inherited from the Soviet Union virtually collapsed, as they were unable to raise the necessary funds, skilled health workers left, and pharmaceuticals and technology, now at world prices (or often higher, as the newly privatized distributors took their cut) became unaffordable (Rechel and McKee 2009). Some sought, with varying degrees of success, to implement new financing systems based on health insurance, while Azerbaijan, Belarus, Tajikistan, Turkmenistan, Ukraine, and Uzbekistan essentially retained many of the features of the Soviet health system, although in the face of growing economic pressures (Figueras et al. 2004; Kutzin 2010). In many, out-of-pocket payments expanded to fill the space left by drastic reductions of state funds.
Table 1.
Key Health System Indicators of the Study Countries (Various Sources, Most Recent Data Available)
| GDP per Capita, PPP* [current international $, 2009]* | Gini Coefficient* | Total Government Expenditure as % of GDP, 2008† | Public Sector Expenditure on Health as % of Total Government Expenditure, 2008† | Public Sector Expenditure on Health as % of Total Health Expenditure, 2008† | Public Sector Expenditure on Health as % of GDP, 2008† | Private Households’ Out-of-Pocket Payment on Health as % of Total Health Expenditure, 2008† | Mandatory Health Insurance Scheme [Yes/No, 2010] [% of Total Health Expenditure in 2006]‡ | Voluntary Insurance [% of Total Health Expenditure, 2006] § | Physicians per 100,000, 2009† | |
|---|---|---|---|---|---|---|---|---|---|---|
| Armenia | 5,279 | 30.2 (2007) | 21.5 | 7.6 | 43.7 | 1.6 | 50.9 | No | Yes [0.1]¶ | 346 |
| Azerbaijan | 9,638 | 16.8 (2005) | 34 | 2.6 | 24 | 0.9 | 67.8 | No | Yes [0.1] ¶ | 367 |
| Belarus | 13,040 | 28.8 (2007) | 49.5 | 9.9 | 75.3 | 4.9 | 17.4 | No | Yes [<0.1] | 511 |
| Georgia | 4,774 | 40.78 (2005) | 36.4 | 4.9 | 20.7 | 1.8 | 66.3 | No. State insurance programs for specific groups | Yes [10%, 2008]¶ | 467 |
| Kazakhstan | 11,510 | 30.9 (2007) | 22.3 | 10.8 | 65.7 | 2.4 | 33.7 | No | Yes [n/a] | 381 |
| Moldova | 2,854 | 37.4 (2007) | 41.6 | 13 | 50.5 | 5.4 | 48.4 | Yes [35.2%] | Yes [0.2] | 310 |
| Russia | 18,963 | 43.7 (2007) | 33.6 | 10.2 | 65.5 | 3.4 | 28.3 | Yes [26.7%] | Yes [3.7%] | 431 (2006) |
| Ukraine | 6,318 | 27.6 (2008) | 44.5 | 8.6 | 56.1 | 3.8 | 40.7 | No | Yes* [0.5%] | 315 |
World Development Indicators online: http://data.worldbank.org/indicato.
WHO Health for all database: http://data.euro.who.int/hfadb/.
Kutzin (2010).
These estimates do not include the community-based insurance schemes (CBHI) existing in Armenia, Georgia, Azerbaijan, and Ukraine (Kutzin, Cashin, and Jakab 2010). These are subregional insurance schemes run by donors or local NGOs that exist in parallel to the mainstream health financing systems and have emerged as a coping mechanism given the failure of the public health system to deliver essential services. Although in some cases the size of population covered is significant (15% of all rural population in Armenia), they have been hampered by low participation rates and lack of integration with the health system.
They have also struggled to reform health care delivery, with health professionals coming to terms with new roles (Healy and McKee 1997) during the reconfiguration of an inefficient and increasingly obsolete health care estate (Healy and McKee 2002). There were many failures but also some successes, with a few countries managing to implement effective policies and achieve good results despite severe economic and institutional constraints (Kutzin, Jakab, and Cashin 2010; Rechel et al. 2011).
This period was extremely traumatic for those living in the region; they were plunged into uncertainty as the paradigm they had grown up with was abandoned (Field and Twigg 2000). New and unfamiliar institutional frameworks were put in place and those interacting with them had to learn the new rules (Lewis 2000). This was especially difficult for many users of health care, who inevitably include many of the most vulnerable in society who have the fewest economic and social resources.
A series of household surveys we conducted in eight former Soviet countries in 2001 as part of the Living Conditions, Lifestyles, and Health (LLH) project revealed the impact on ordinary people (Balabanova et al. 2004). In Belarus, which had rejected rapid economic reforms, people were still able to obtain health care without great difficulty (although it was clear even then that the same lack of reform was also causing the country increasingly to fall behind economically, raising questions about the sustainability of the system). By contrast, for those living in Armenia and Georgia, which in addition to more severe economic collapse had experienced major armed conflicts, the systems were clearly failing. Those who needed care were unable to obtain it and, when they were, largely paid out of pocket. Those who were already disadvantaged were experiencing the greatest problems.
In this study, we report the findings from a new wave of surveys undertaken in countries in this region in early 2010. Since our earlier surveys, things have changed considerably, although not in a consistent way. Most of the economies are growing, in some cases rapidly as a consequence of exploiting natural resources. However, the benefits have not been shared by all and while the share of households with income below the poverty line ($1.25 and $3) has fallen since the early 1990s, incomes are now much more unequal and inequalities continue to grow (World Bank 2010).
Many of the new institutions and practices introduced during the transition from socialism are now embedded in their societies, but reforms to health care financing have proven difficult to implement. Kyrgyzstan and Moldova (Kutzin, Jakab, and Shishkin 2009) have managed to introduce insurance systems with individual enrollment, risk pooling, and output-based payments, although some of these elements can be found in other countries (Kutzin 2010). People in the region now have much greater understanding about how their reconfigured health systems work, although the persistence of informal payments continues to create considerable uncertainty. Populations that were once isolated now have access to developments in the rest of the world, although not necessarily to the democratic systems they see elsewhere. Thus, we were unable to undertake surveys in Turkmenistan, where the government actively suppresses information on the health of its population (Rechel and McKee 2007), or Uzbekistan, which also seeks to control what is reported about it. Finally, the overall stability that has come about in the region remains susceptible to disruption, exemplified by our need to postpone our survey in Kyrgyzstan because of the civil disorder that erupted in early 2010 while the field work in Georgia was complicated in the aftermath of the conflict with Russia over South Ossetia and Abkhazia.
Our approach draws on the WHO framework that identifies the goals of a health system as not only to improve health but also to ensure responsiveness, fairness, and financial protection (WHO 2007). Access to necessary services is a core element of this concept and this is what we focus upon here. It is not possible, with only two studies only a decade apart, to attribute particular findings to specific reforms with any degree of certainty. Hence, our article is of necessity primarily descriptive.
Our focus is on a region of the world that has a number of specificities, in particular the historical legacy of communist rule for most of the 20th century, ending in political, social, and economic collapse. Nonetheless, we believe that some of our findings do have implications for countries elsewhere, including those emerging from major conflicts or large-scale political change.
Aims and Objectives
The aim of this article is to assess the accessibility and affordability of health care in eight countries of the former Soviet Union. It seeks to achieve this in four ways. The first is to describe overall rates of utilization of care in each country among those who had recent illnesses that they felt justified a consultation. Second, it looks at the characteristics of those who were ill and did not obtain care and asks why they did not. Third, it examines where care is obtained, raising questions of whether patterns of utilization are appropriate. Fourth, it explores the scale and nature of out-of-pocket payments for health care.
Methods
Data Sources
Household surveys were undertaken between March and June 2010 in Armenia, Azerbaijan, Belarus, Georgia, Kazakhstan, Moldova, Russia, and Ukraine. These are the same as those included in the 2001 LLH study, with the addition of Azerbaijan but exclusion, for now, of Kyrgyzstan, as noted above. In addition to the exclusion of Uzbekistan and Turkmenistan, for the reasons set out above, the three Baltic States were excluded as they are now members of the European Union and thus are quite different from the rest of the region. Tajikistan was excluded for a combination of budgetary and logistical reasons.
The sampling approach was the same as in the earlier LLH surveys and was designed to capture nationally representative samples of those aged 18 years and older (Pomerleau et al. 2004). A few small regions of Georgia, Russia, and Moldova were omitted from the sampling frame due to geographic inaccessibility, dangerous political situations, and ongoing military actions. The surveys included 1,800 respondents in each country, except in Russia and Ukraine, where 3,000 and 2,000, respectively, were sampled to reflect their larger and more regionally diverse populations. A booster survey of 400 additional respondents was conducted in Georgia in November 2010 to ensure a fully representative sample, so the total sample size there was 2,200. Individual exclusion criteria included being institutionalized, hospitalized or homeless, being intoxicated at the time of the survey, and being in the military or in prison. The total sample size was 16,200.
Subjects were selected using multistage random sampling with stratification by region and rural/urban settlement type. Within each primary sampling unit (approximately 100–200 per country), households were selected by standardized random route procedures. One person was randomly chosen from each selected household (nearest coming or last birthday). If after three visits (on different days and times) there was no one at home, the next household on the route was selected. Face-to-face interviews were conducted by trained fieldworkers in the respondents’ homes. All persons gave their informed consent prior to their inclusion in the study. The research was approved by the ethics committee of the London School of Hygiene and Tropical Medicine.
Questionnaire Variables
The surveys employed a standardized questionnaire to enable the comparison of countries. It was designed to be compatible, as far as possible, with the LLH surveys, but it also improved in the light of experiences with them. The draft questionnaire was forward and backward translated and piloted before being finalized. Except in Russia and Belarus (where all interviews were conducted in Russian) respondents were given the choice of answering in Russian or a local language. The final version contained questions which covered the folllowing: demographic characteristics; social factors such as health service utilization, social capital, living conditions, exercise, alcohol and tobacco; economic characteristics such as income sources, household assets, and economic situation; and a range of self-reported physical and mental health conditions. The questions on utilization of health care employed a shorter recall period than in the 2001 LLH surveys (4 weeks rather than a year) to improve validity.
Analysis
Our analyses examined the presence of self-reported health problems in the 4 weeks before the interview, asking whether the respondent felt that it required health care and, if so, what action he or she took. Those that received health care were asked about out-of-pocket payments they made for that health care (with amounts recorded in national currencies and converted into U.S. dollars using the exchange rates prevailing in March 2010 at the time of the surveys).
The determinants of not seeking care when suffering an illness that the respondent felt justified care were explored using logistic regression. Potential explanatory variables were demographic, social, and economic characteristics. Demographic variables included sex, age, marital status, education level, disability status, number of persons living in the household, and household location (urban/rural). Social variables included living conditions, frequency of drinking alcohol, coverage by a health insurance scheme (public or private) and social capital elements of trust in people, sense of freedom of choice and control, and active membership of a club or organization, and levels of support. Economic variables included employment status, household economic situation, and number of household assets. Further details on the key variables used in the final regression analysis can be found in Appendix SA2.
Multivariate analysis was employed to adjust for the influence of the other variables given that some of the putative independent variables are themselves correlated. Backward stepwise regression was then used to eliminate variables with odds ratios that were not statistically significant (p < .05). The results of univariate analysis of the separate associations between the individual variables and the outcome are presented, along with the multivariate analysis, which is presented in two separate models. The first multivariate model consists of all the demographic and social and economic variables except the country of residence variable. The second multivariate model added the country variable to explore the influence of country-specific effects. Data were adjusted for the sampling design effect.
Results
Illness and Utilization
Thirty-four percent (n = 5,519) of all respondents reported an illness in the previous week, but this varied considerably among countries, from 17 percent in Azerbaijan to 52 percent in Georgia. However, 678 of them did not believe their illness was of sufficient severity to justify seeking care, leaving 45 percent (n = 2,184) of those reporting illness who did feel care was justified but who did not seek it. This figure varied considerably, from 61 percent in Georgia to 30 percent in Moldova (Figure 1).
Figure 1.
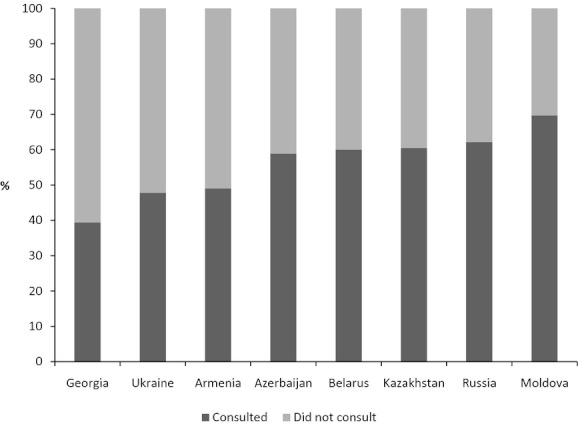
Proportion of Respondents Who Consulted a Health Care Professional in the Previous 4 Weeks (for Those Reporting an Illness They Felt Justified Attendance), by Country (n = 4,823)
Who Does Not Seek Care When Needed?
The next step was to determine the demographic and socioeconomic characteristics of those who did not obtain care despite feeling it was justified, and the results of the regression analysis are shown in Table 2. For brevity, only those variables for which there was a significant association are shown. The significant characteristics shown in the univariate analysis remain significant after adjustment in the multivariate analysis, with the exception of coverage by health insurance, which only becomes significant when the other significant variables are taken into account. Having greater than primary education and being aged 35–49 is associated with lower probability to seek care when needed. Those with only primary education in the former Soviet Union are a now small proportion of the population and often tend to have missed out on education because of disabilities from childhood. Residing in a rural area significantly reduced the likelihood of obtaining care. Utilization is predictably associated with having a long-term illness or certified disability, both of which are likely to require frequent access to services and thus familiarity with the system. People perceiving their financial situation to be “bad” or having the fewest household assets (three or less) were significantly less likely to seek care when needed. More frequent alcohol use is also significantly associated with lower probability of obtaining care.
Table 2.
Characteristics Associated with Being Ill But not Seeking Health Care, across All Countries
| Multivariate Analysis | ||||||||||
|---|---|---|---|---|---|---|---|---|---|---|
| Model 1 | Model 2 | |||||||||
| Characteristic | N | OR | Univariate Analysis [95% CI] | p-Value | OR | [95% CI] | p-Value | OR | [95% CI] | p-Value |
| Russia | 950 | 1.00 | 1.00 | |||||||
| Armenia | 558 | 1.71 | [1.28; 2.27] | .00 | 1.70 | [1.24; 2.34] | .00 | |||
| Azerbaijan | 312 | 1.14 | [0.82; 1.59] | .42 | 1.01 | [0.71; 1.44] | .97 | |||
| Belarus | 703 | 1.09 | [0.84; 1.42] | .51 | 1.03 | [0.80; 1.33] | .81 | |||
| Georgia | 1,059 | 2.52 | [2.06; 3.09] | .00 | 2.11 | [1.68; 2.64] | .00 | |||
| Kazakhstan | 515 | 1.07 | [0.81; 1.42] | .62 | 0.99 | [0.74; 1.33] | .97 | |||
| Moldova | 707 | 0.71 | [0.56; 0.90] | .01 | 0.55 | [0.42; 0.71] | .00 | |||
| Ukraine | 715 | 1.79 | [1.44; 2.23] | .00 | 1.67 | [1.33; 2.11] | .00 | |||
| Age (years) | ||||||||||
| 18–34 | 1,209 | 1.00 | 1.00 | 1.00 | ||||||
| 35–49 | 1,376 | 1.47 | [1.24; 1.74] | .00 | 1.43 | [1.17; 1.74] | .00 | 1.39 | [1.13; 1.70] | .00 |
| 50–64 | 1,586 | 1.17 | [0.99; 1.37] | .06 | 1.21 | [1.00; 1.48] | .05 | 1.20 | [0.98; 1.47] | .08 |
| 65+ | 1,348 | 0.99 | [0.82; 1.19] | .92 | 1.11 | [0.87; 1.40] | .40 | 1.02 | [0.80; 1.29] | .90 |
| Education level | ||||||||||
| Incomplete secondary or lower | 913 | 1.00 | 1.00 | 1.00 | ||||||
| Completed secondary | 2,039 | 1.20 | [1.01; 1.43] | .04 | 1.22 | [1.00; 1.49] | .05 | 0.99 | [0.81; 1.21] | .90 |
| Completed special secondary | 1,443 | 1.24 | [1.03; 1.50] | .02 | 1.28 | [1.04; 1.59] | .02 | 1.08 | [0.87; 1.34] | .49 |
| Completed higher education | 1,116 | 1.26 | [1.03; 1.53] | .02 | 1.39 | [1.12; 1.73] | .00 | 1.08 | [0.86; 1.36] | .50 |
| Marital status | ||||||||||
| Married | 3,284 | 1.00 | 1.00 | 1.00 | ||||||
| Single | 704 | 0.95 | [0.79; 1.15] | .61 | 1.12 | [0.90; 1.40] | .31 | 1.11 | [0.88; 1.39] | .38 |
| Divorced/widowed | 1,505 | 0.84 | [0.73; 0.96] | .01 | 0.84 | [0.73; 0.98] | .02 | 0.88 | [0.76; 1.02] | .10 |
| Disability status | ||||||||||
| No disability | 4,713 | 1.00 | 1.00 | 1.00 | ||||||
| Disability | 801 | 0.52 | [0.44; 0.61] | .00 | 0.54 | [0.45; 0.64] | .00 | 0.55 | [0.46; 0.65] | .00 |
| Place of living | ||||||||||
| Urban area | 3,242 | 1.00 | 1.00 | 1.00 | ||||||
| Rural area | 2,277 | 1.23 | [1.06; 1.42] | .01 | 1.17 | [1.00; 1.37] | .05 | 1.23 | [1.07; 1.43] | .01 |
| Self-reported economic situation of the household | ||||||||||
| Good | 720 | 1.00 | 1.00 | 1.00 | ||||||
| Average | 2,900 | 1.14 | [0.94; 1.39] | .19 | 1.20 | [0.98; 1.48] | .08 | 1.07 | [0.87; 1.32] | .50 |
| Bad | 1,843 | 1.62 | [1.30; 2.01] | .00 | 1.74 | [1.37; 2.22] | .00 | 1.38 | [1.08; 1.76] | .01 |
| Household asset score | ||||||||||
| Quartile 1 (highest) | 852 | 1.00 | 1.00 | 1.00 | ||||||
| Quartile 2 | 1,141 | 1.27 | [1.04; 1.54] | .02 | 1.23 | [1.00; 1.51] | .05 | 1.18 | [0.95; 1.46] | .13 |
| Quartile 3 | 1,392 | 1.21 | [1.01; 1.46] | .04 | 1.22 | [0.99; 1.50] | .07 | 1.13 | [0.91; 1.40] | .27 |
| Quartile 4 (lowest) | 2,134 | 1.40 | [1.18; 1.67] | .00 | 1.44 | [1.17; 1.78] | .00 | 1.30 | [1.03; 1.62] | .03 |
| Alcohol use | ||||||||||
| Never | 1,789 | 1.00 | 1.00 | 1.00 | ||||||
| Once in 2–3 months or less | 1,966 | 1.25 | [1.08; 1.44] | .00 | 1.25 | [1.08; 1.45] | .00 | 1.26 | [1.09; 1.47] | .00 |
| Once per week or less | 1,158 | 1.15 | [0.98; 1.36] | .08 | 1.20 | [1.01; 1.43] | .04 | 1.27 | [1.06; 1.52] | .01 |
| 2–3 times per week or more | 481 | 1.33 | [1.05; 1.69] | .02 | 1.35 | [1.05; 1.72] | .02 | 1.61 | [1.26; 2.07] | .00 |
| Type of insurance | ||||||||||
| Private insurance | 351 | 1.00 | 1.00 | 1.00 | ||||||
| State insurance | 5,150 | 0.96 | [0.75; 1.24] | .76 | 1.13 | [0.87; 1.46] | .37 | 1.56 | [1.19; 2.05] | .00 |
Notes. Only statistically significant (p < .05) variables after stepwise regression analysis are presented in the table. Statistically significant values in bold. N is the number of respondents in the variable category that reported a health problem in the last 4 weeks. Model 1 excludes the country-level variable. Model 2 is all variables included in Model 1 plus country-level variable (N = 4,632).
CI, confidence interval.
Those living in Armenia, Georgia, and Ukraine were significantly less likely to obtain care when needed when compared to Russia. However, those in Moldova were more likely to do so. When adjusting for country of residence, in model 2, most predictors still hold, apart from marital status and education.
Why Do People Not Obtain Care When They Believe They Need It?
Respondents were asked why they did not seek care and could give multiple responses. The most frequent reason cited for not seeking health care (55 percent of the 2,184 who thought that care would have been justified) was the cost of treatment (including drugs), followed by the choice to self-treat (Figure 2). However, self-treatment often involves using various cheaper drugs and traditional remedies and may infer not having resources to obtain conventional treatment.
Figure 2.
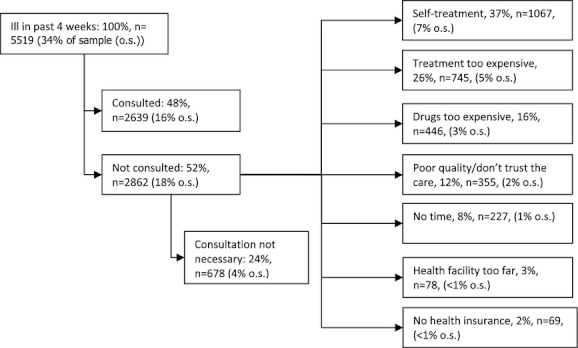
Illness and Consultation Pathway in the Last 4 Weeks, All Countries (n = 16,181, Multiple Responses Allowed)
The proportion of those with illness seen as justifying care who cited unaffordability (of either treatment or drugs) varied hugely across countries, from 70 and 58 percent, respectively, in Georgia and Azerbaijan to under 5 and 3 percent, respectively, in Russia and Belarus (Table 3). However, Belarus, Kazakhstan, and Ukraine have the highest share of those who choose to self-treat despite stating that their condition was serious enough to justify seeking care, suggesting that cheaper home-based treatment may be a substitute for accessing the health system in those countries. Problems related to lack of time, geographical inaccessibility, and lack of health insurance did not appear to deter access.
Table 3.
Main Reasons for Not Consulting a Health Professional for Those Who Had a Health Problem in the Last 4 Weeks, by Country (N = 2,862) (Multiple Responses Allowed)
| Self-Treatment | Could Not Afford Services | Could Not Afford Drugs | Could Not Afford Either Services or Drugs | |||||||||
|---|---|---|---|---|---|---|---|---|---|---|---|---|
| % | [95% CI] | N | % | [95% CI] | N | % | [95% CI] | N | % | [95% CI] | N | |
| Georgia | 20.8 | [17.7; 23.9] | 137 | 66.5 | [62.9; 70.1] | 438 | 38.7 | [35.0; 42.4] | 255 | 69.7 | [66.1; 73.2] | 459 |
| Azerbaijan | 18.2 | [11.9; 24.5] | 27 | 51.4 | [43.2; 59.5] | 76 | 16.9 | [10.8; 23.0] | 25 | 58.1 | [50.1; 66.2] | 86 |
| Armenia | 24.9 | [20.4; 29.4] | 89 | 24.0 | [19.6; 28.5] | 86 | 12.8 | [9.4; 16.3] | 46 | 27.1 | [22.5; 31.7] | 97 |
| Moldova | 39.4 | [33.5; 45.3] | 106 | 20.1 | [15.3; 24.9] | 54 | 15.2 | [10.9; 19.6] | 41 | 28.6 | [23.2; 34.1] | 77 |
| Ukraine | 51.2 | [46.3; 56.1] | 207 | 16.1 | [12.5; 19.7] | 65 | 11.4 | [8.3; 14.5] | 46 | 20.5 | [16.5; 24.4] | 83 |
| Kazakhstan | 50.2 | [43.8; 56.6] | 121 | 4.1 | [1.6; 6.7] | 10 | 5.0 | [2.2; 7.7] | 12 | 8.3 | [4.8; 11.8] | 20 |
| Russia | 45.1 | [40.4; 49.9] | 195 | 3.5 | [1.7; 5.2] | 15 | 2.5 | [1.1; 4.0] | 11 | 4.6 | [2.6; 6.6] | 20 |
| Belarus | 52.9 | [47.6; 58.1] | 185 | 0.3 | [0.0; 0.8] | 1 | 2.9 | [1.1; 4.6] | 10 | 2.9 | [1.1; 4.6] | 10 |
Note. CI, confidence interval.
Where Do People Obtain Care?
Of those reporting a health problem, 2,639 (48 percent) consulted a health care professional. These included primary care physicians (including family physicians where these exist) (48 percent of respondents who sought health care), specialists (33 percent), pharmacists (7 percent), feldshers (health workers with basic medical training that played an important role in delivering care, especially in rural areas, in the Soviet system) (5 percent), dentists (3 percent), midwives (2 percent), alternative medicine specialists (1 percent), and others (1 percent).
Most of those who did seek care consulted primary care physicians. The Soviet system employed large numbers of what were termed specialists with very basic training in a narrow field (in part reflecting the Soviet system of undergraduate specialization). The retraining of many of these specialists as family physicians has been a major feature of health reforms in the region over the past decade, albeit with varying degrees of success. The balance between consultations with primary care physicians and specialists varied among countries, with the former predominating in Moldova (77 percent), while the share of consultations with primary care physicians and specialists is about equal in Georgia (40 and 39 percent, respectively).
Compared to the previous 2001 LLH surveys, the use of feldshers and midwives has fallen (4 percent of users living in urban areas consulting with a feldsher or midwife; 11 percent living in rural areas). Rural utilization varied from 4 percent in Azerbaijan to 16 percent in Kazakhstan and 21 percent in Ukraine.
Payment for Health Care
Among the 2,639 respondents who sought health care in the last 4 weeks, out-of-pocket payment (formal and informal) for health care is commonplace (Table 4). This is surprising given that 95 percent of respondents in the sample as a whole nominally have access to care funded from general government revenues or insurance (26 percent government revenues and 69 percent insurance). The frequency of out-of-pocket payment varies, with four out of five respondents using outpatient facilities in Azerbaijan making out-of-pocket payments compared with less than one in five in Belarus and Russia. The median out-of-pocket payments for outpatient care vary from $9 in Belarus to $29 in Russia and for inpatient care from $0.04 in Kazakhstan to $172 in Azerbaijan. Payment for drugs is common in all countries, although country differentials are high and payments were extremely high in Azerbaijan. The highest level of expenditure (expressed as a proportion of annual per capita GDP in 2009) on total health care and drugs (for the 1-month recall period) were in Azerbaijan (1.03 percent), Georgia (0.83 percent), and Moldova (0.83 percent). The lowest proportions were in Belarus (0.10 percent), Kazakhstan (0.15 percent), and Russia (0.17 percent) (Table 4).
Table 4.
Proportion of Respondents Having to Make a Payment for Obtaining Health Care, and the Median Amounts Paid (US$), by Country (n = 2,639)
| Outpatient Costs | Inpatients Costs | Drug Costs | Transport Costs | Total Costs for Health Care and Drugs† (Outpatient and/or Inpatient and/or Drugs) | ||||||||||||
|---|---|---|---|---|---|---|---|---|---|---|---|---|---|---|---|---|
| %* | N | Median US$ [95% CI] | %* | N | Median US$ [95% CI] | %* | N | Median US$ [95% CI] | %* | N | Median US$ [95% CI] | %‡ | N | Median US$ [95% CI] | % of Annual per Capita GDP§ | |
| Azerbaijan | 78.4 | 98 | 24.91 [18.68; 32.44] | 17.1 | 13 | 171.89 [47.82; 621.82] | 86.2 | 100 | 74.74 [62.28; 87.19] | 77.0 | 107 | 3.74 [2.49; 3.74] | 97.5 | 158 | 99.65 [74.74; 118.31] | 1.03 |
| Georgia | 59.1 | 218 | 17.15 [14.29; 22.86] | 11.9 | 17 | 114.32 [17.21; 228.64] | 88.1 | 266 | 28.58 [28.58; 38.30] | 69.8 | 226 | 1.14 [1.14; 1.71] | 96.9 | 342 | 39.44 [34.30; 52.22] | 0.83 |
| Ukraine | 52.0 | 146 | 12.57 [9.20; 13.47] | 25.6 | 35 | 62.84 [29.37; 188.52] | 80.8 | 206 | 18.85 [12.57; 25.14] | 50.8 | 123 | 0.75 [0.52; 1.26] | 95.5 | 296 | 28.53 [21.39; 36.95] | 0.45 |
| Armenia | 43.7 | 80 | 11.55 [9.24; 23.10] | 28.2 | 24 | 92.17 [19.20; 354.29] | 86.0 | 154 | 18.48 [16.17; 23.10] | 61.9 | 96 | 1.16 [0.46; 2.31] | 97.0 | 193 | 23.10 [18.48; 34.53] | 0.44 |
| Moldova | 36.6 | 142 | 12.06 [8.04; 16.08] | 29.0 | 27 | 64.34 [31.62; 89.01] | 91.2 | 279 | 21.71 [17.38; 24.13] | 93.4 | 199 | 1.21 [0.80; 1.61] | 96.3 | 421 | 23.64 [19.62; 27.64] | 0.83 |
| Kazakhstan | 28.6 | 76 | 10.75 [4.75; 14.93] | 43.6 | 116 | 0.04 [0.04; 0.04] | 77.8 | 207 | 13.56 [13.56; 16.99] | 69.9 | 186 | 0.68 [0.54; 0.81] | 85.3 | 227 | 16.99 [13.57; 20.38] | 0.15 |
| Russia | 19.0 | 91 | 28.82 [18.86; 39.61] | 5.7 | 16 | 43.39 [22.09; 151.95] | 70.4 | 299 | 22.04 [20.27; 27.12] | 49.7 | 189 | 1.22 [0.95 1.70] | 85.9 | 440 | 32.34 [26.92; 33.90] | 0.17 |
| Belarus | 13.7 | 47 | 8.91 [6.60; 15.65] | 42.1 | 8 | 34.65 [9.45; 76.31] | 93.4 | 241 | 9.90 [8.25; 13.20] | 78.3 | 137 | 0.46 [0.46; 0.66] | 98.6 | 348 | 12.54 [9.90; 13.20] | 0.10 |
Notes. Data include both formal and informal payments as it can be difficult for health care users to clearly distinguish between informal and formal payments. Exchange rates to U.S. dollars used from the period of data collection. The median amounts exclude zero values (i.e., when no payment was made).
% is proportion of all respondents in each category who had to make a payment.
Total for outpatient, inpatient, and drugs costs combined. Note that respondents may have paid for more than one of these types.
% is proportion of all respondents who used health care who had to pay for outpatient and/or inpatient and/or drugs.
Based on 2009 GDP per capita data.
CI, confidence interval.
Source: World Development Indicators online: http://databank.worldbank.org/ddp/home.do?Step=12&id=4&CNO=2.
Discussion
Many of the health reforms implemented in the former Soviet Union following independence sought to mobilize and restructure financing and improve efficiency without compromising the affordability and accessibility of health services for vulnerable groups. However, evidence about the situation facing users “on the ground” is scarce. This study seeks to redress this by employing a set of comparable, nationally representative surveys conducted in eight countries.
The study has some limitations. First, it is a cross-sectional descriptive study that by its design cannot attribute change to particular policies. Instead, we sought to interpret access to services in the context of ongoing health reforms by describing the broader fiscal contexts and priority given to funding the health system within the public budgets across the study countries (Table 1). Second, it used a standardized questionnaire to provide comparable data between the countries, and the meanings of certain terms could potentially have varied between countries, although this risk was minimized through a thorough process of re-translation, pretesting and piloting, and external validity tests. Third, we were unable to obtain objective information on the health problems reported by respondents over the previous 4 weeks, and reliance on subjective understanding of a health problem and their threshold for seeking care inevitably reflects their individual experiences and expectations of the health care system. This threshold appears to be higher in countries where health systems are less effective (e.g., just 40 percent of respondents in Georgia with a health care problem sought care compared to 70 percent in Moldova or 62 percent in Russia). As a result, the study findings may underestimate the scale of the problem where the situation is worst. Fourth, there may have been some recall problems especially about payment for care. A 4-week recall period was introduced to improve accuracy (it was 12 months in the 2001 survey), but this reduced the sample size in the regression analysis which meant there was insufficient power to look at differences in explanatory factors among countries and between regions in the larger countries. Fifth, as noted above, certain geographic regions of countries were excluded, due to inaccessibility although these regions accounted for only small proportions of the populations in the study countries (approximately 3 percent of the Georgian population, 5 percent of the Moldovan population, and 2 percent of the population of the Russia). Although there are major logistical and security constraints to doing so, future studies of these excluded populations would be useful as they are likely to have different patterns of health care utilization.
The analysis indicates the persistence of considerable problems with access to health services in the region, with only a half of those who thought their illness justified consulting a health professional actually seeking care. While some differences in health-seeking behavior are to be expected due to cultural norms and attitudes shaping the way people interact with the health system, <50 percent of those reporting illness in Armenia, Georgia, and Ukraine reported seeking care. Our earlier analysis also found that the situation was much worse in Georgia and Armenia than elsewhere, while at that time the situation in Ukraine was much closer to that in Russia (Balabanova et al. 2004). Although the scale of these problems has slightly decreased in the current surveys, unaffordability has persisted despite attempts at reform, particularly in Georgia (Gotsadze, Zoidze, and Vasadze 2005). Our findings are consistent with those from other country-level surveys in Moldova (Richardson et al. 2011) and Russia (Balabanova, Falkingham, and McKee 2003).
Interestingly, the current study indicates that geographical access may not be a major barrier to seeking care. Payments for transport were generally low. Since independence, all of the countries except Azerbaijan have introduced family practitioners trained in modern primary health care to replace the poorly trained and equipped district physicians, although the distribution of family practitioners remains uneven in many of the countries (Rese et al. 2005). However, the extent to which this has been achieved varies greatly among countries—family practitioners operate in rural areas in Russia and Belarus and in pilot regions of Georgia and Ukraine. Even where there are family practitioners in place, they are often not supported and are under-resourced, limiting their effectiveness. The creation of a new cadre of family physicians was in large part to address the bypassing of the district physicians that began in the dying days of the Soviet Union, so reinvigorating primary care (Healy and McKee 1997). Our findings indicate that primary care physicians (some of whom will include the new family practitioners) are the main group of health care provider consulted. With the exception of Kazakhstan and Ukraine, the feldsher system is largely obsolete now that health systems have, in theory, the capacity to deliver modern health care that extends beyond first aid and symptomatic relief. While migration of health workers and deteriorating infrastructure are causes for concern, access to first-line providers near to people's homes appears to be maintained.
Governments in this region have inherited an expectation that they will provide, at least in theory, universal health coverage, which in some countries is enshrined in constitutions. However, they have also had to confront stark challenges. Availability of funds has reduced as they have struggled to establish effective systems to raise revenues. The scope of health care has expanded with the availability of often expensive Western drugs and other elements of modern medicine. Governments have responded in different ways. Some measures are explicit, such as by introducing cost sharing or reducing the package of care that is funded (Gotsadze and Gaal 2010). Others are implicit, allowing capacity to wither, tolerating a growing gap between entitlement and capacity. The consequence has been, to varying degrees, a form of de facto privatization. In this situation, where citizens are denied the usual remedies of voice and exit, they have instead opted for what has been termed “inxit,” or informal exit, whereby the remain partly within the public system, using its staff and facilities, and partly outside it, as they pay out of pocket for the service they receive (Gaal and McKee 2004). Inevitably, given that a major purpose of public funding of health care is to redistribute resources from the rich and well to the poor and ill, this has the greatest impact on the most vulnerable individuals.
Attempts to formalize the situation by implementing formal payments, in the hope that they will displace informal payments, have not been successful in Armenia (Hakobyan et al. 2006). However, in Kyrgyzstan results of a recent longitudinal survey of payment for care in Kyrgyz hospitals shows a clear reduction in the overall level of out-of-pocket payments between 2001 and 2006 as well as reductions in informal payments. While informal payments to health workers slightly increased over the period, this was more than offset by reductions in informal payments for drugs and medical supplies (Jakab and Kutzin 2009; Kutzin 2010). While large sums are still being paid for specialist care, the frequency of payment has declined for routine consultations and treatment and there appears to have been sustained decrease in out-of-pocket and informal payments (Falkingham, Akkazieva, and Baschieri 2010; Ministry of Health 2011). There is also some evidence from Russia, where regions now have the ability to impose different payment schemes, that formal and informal payments may substitute for one another (Aarva et al. 2009).
Other efforts to implement reforms of financing have also been problematic. There have been many attempts to introduce forms of health insurance, dating from the mid-1990s. Most countries have draft laws, some have been enacted, and some have been at least partly implemented. However, these policies were subsequently reversed in Georgia and Kazakhstan (Rechel and McKee 2009). Thus, in Georgia, payroll-based earmarked tax for health care was abolished in 2004 and a radically different system based on private insurance was introduced in 2008 (Chanturidze et al. 2009). The two countries in this study that currently have health insurance systems, Moldova and Russia, have not managed to achieve universal coverage, with some groups being particularly difficult to include (Balabanova, Falkingham, and McKee 2003; Jowett and Shishkin 2010).
An important historical feature of health care systems in this region was the existence of employment-based health services for employees of major industries, the military, transport workers, and civil servants, among others. Use of these “parallel” services is now extremely low with the exception of Azerbaijan. This is likely to reflect a combination of privatization of industry (although this has varied considerably among countries) and reduced resources to those sectors still within the state apparatus.
In the absence of formal support, people experiencing illness employ a range of coping strategies. These include self-treatment with herbs, alcohol, and traditional medicines (Brown and Rusinova 2002). This may be a cultural preference (e.g., in Belarus and Ukraine), but it is likely that it is often used as a substitute for mainstream health care. If this is considered a manifestation of affordability, then the situation is likely to be rather worse than at first seems from the responses to the question of reasons for not seeking care. Unsurprisingly, reported unaffordability was most commonly reported from Georgia where the benefits package is most tightly circumscribed, and in Azerbaijan, where out-of-pocket payments for care are highest.
A majority of respondents report making out-of-pocket payments despite large-scale reforms that have sought to improve financial protection. Paying to obtain treatment (including formal or informal payment) is now almost universal, showing a dramatic increase since 2001. Although some of this difference can be attributed to different recall period (with payments less accurately reported for the 1-year period compared to the 4 weeks in the current study), there are substantial increases in most countries. It is important to note that the composition and level of expenditure varies. More than three quarters of respondents in Azerbaijan paid for outpatient care and the amounts are high. Payments for inpatient care are more common in Kazakhstan and Belarus, but the amounts paid are much lower than elsewhere. An alarming finding is that expenditure on drugs is now becoming very significant and is commensurate with payment for outpatient care. For example, payments for drugs are high even where patients are protected from out-of-pocket payments for care; this may help explain why in countries such as Belarus use of homemade drugs and treatments is high despite formal access not being a problem. A high proportion of those who had used services paid for drugs regardless of the health financing system. This is in part a legacy of the Semashko system, where outpatient pharmaceutical costs were not part of the universal package; this has allowed governments to omit many pharmaceutical costs from the general package of benefits made available to the population. The cost of pharmaceuticals in the region is also higher as a result of market forces: there is inadequate capacity in the former Soviet Union to manufacture all the drugs needed for the population so most are imported, generally through privatized supply networks, at high cost. The pharmaceutical sector is among those that were fully liberalized after the transition with often limited safeguards (Balabanova and Coker 2008). There is evidence of extensive inappropriate prescribing (Danishevski, McKee, and Balabanova 2008) and there is strong resistance from patients and physicians to the substitution of brand-name drugs with generics. One manifestation of this is the irregular use of medication by those suffering from hypertension (Roberts et al. 2010).
The analysis of determinants of utilization presents an interesting picture. In the 2001 survey, there was much more variation between sociodemographic and economic groups. Only the poorest and most disadvantaged groups are now significantly less likely to obtain care. Now, country of residence and having a long-term illness or disability are the variables most strongly associated with the probability of not using health services, suggesting that there are structural issues affecting the whole population. For example, Georgia has devoted a low proportion of its national income to public health care and has high out-of-pocket payments and poor access to care when needed. Moldova, which is much poorer, has given a higher priority to government health care expenditure, achieving lower out-of-pocket payments and has better access to care (Table 1 and Figure 1). In the early stages of transition, during the initial health care reforms, personal knowledge and advice from others, many of whom were themselves struggling to understand how to navigate an unfamiliar system, may have been crucial in facilitating access to appropriate care. These may have become less important as the reforms advance and rules are set, with the reform design and implementation more likely to affect actual reality on the ground.
In general, this article shows that the countries are diverging from each other and the nature of their problems is increasingly different. The countries of the South Caucasus (Armenia, Azerbaijan, and Georgia) continue to experience sustained problems in their health systems, consistent with their overall economic and political situations. The very limited state health expenditure in all three countries has resulted in the continuing growth of out-of-pocket payments, and in the case of Armenia, offset by remittances from relatives living abroad (Roberts and Banaian 2004). In Russia, Moldova, and Belarus, gaps in coverage gaps are less severe, potentially reflecting the greater political priority afforded to the health sector in these countries.
In summary, while the eight countries included in this analysis have suffered major political and economic problems, with widening socioeconomic inequalities, inequalities in access to health care within countries have declined compared to our 2001 study. These findings are encouraging, although it is difficult to attribute these improvements to specific reforms. Despite efforts to implement reforms to health system financing and delivery of care, with the goal of universal financial protection, results have not been encouraging, particularly in central Asia and the Caucasus. Armenia and Georgia show similar or worse access than in 2001 (although in Georgia, where reforms were introduced in 2008, it may be too soon to assess the results). Even in countries that have implemented new financing mechanisms, significant elements of the population are excluded and they confront other obstacles such as inadequate infrastructure. In many countries, out-of-pocket payments remain common and expensive, and what progress has been made is vulnerable to future economic problems. There are still significant unmet needs among the most vulnerable which require targeted strategies.
Acknowledgments
Joint Acknowledgment/Disclosure Statement: The HITT Project was funded by the European Union's 7th Framework Program, project HEALTH-F2-2009-223344. The European Commission cannot accept any responsibility for any information provided or views expressed.
We are grateful to all members of the Health in Times of Transition Project (HITT) study teams who participated in the coordination and organization of data collection for this working paper. We are also grateful to the anonymous referees for their helpful suggestions.
Disclosures: None.
Disclaimers: None.
SUPPORTING INFORMATION
Additional supporting information may be found in the online version of this article:
Appendix SA1: Author Matrix.
Appendix SA2: List of Key Variables Included in Regression Analysis.
Please note: Wiley-Blackwell is not responsible for the content or functionality of any supporting materials supplied by the authors. Any queries (other than missing material) should be directed to the corresponding author for the article.
References
- Aarva P, Ilchenko I, Gorobets P, Rogacheva A. Formal and Informal Payments in Health Care Facilities in Two Russian Cities, Tyumen and Lipetsk. Health Policy Plan. 2009;24(5):395–405. doi: 10.1093/heapol/czp029. [DOI] [PubMed] [Google Scholar]
- Balabanova D, Coker R. Health Systems of Russia and Former USSR. In: Heggenhougen K, Quah S, editors. International Encyclopedia of Public Health. San Diego, CA: Academic Press; 2008. pp. 627–37. [Google Scholar]
- Balabanova DC, Falkingham J, McKee M. Winners and Losers: Expansion of Insurance Coverage in Russia in the 1990s. American Journal of Public Health. 2003;93(12):2124–30. doi: 10.2105/ajph.93.12.2124. [DOI] [PMC free article] [PubMed] [Google Scholar]
- Balabanova D, McKee M, Pomerleau J, Rose R, Haerpfer C. Health Service Utilization in the Former Soviet Union: Evidence from Eight Countries. Health Services Research. 2004;39(6 Pt 2):1927–50. doi: 10.1111/j.1475-6773.2004.00326.x. [DOI] [PMC free article] [PubMed] [Google Scholar]
- Brown J, Rusinova N. Curing and Crippling: Biomedical and Alternative Healing in Post-Soviet Russia. The Annals of the American Academy of Political and Social Science. 2002;583(1):160–72. [Google Scholar]
- Chanturidze T, Ugulava T, Durán A, Ensor T, Richardson E. Georgia: Health System Review. Health Systems in Transition. 2009;11(8):1–116. [Google Scholar]
- Danishevski K, McKee M, Balabanova D. Prescribing in Maternity Care in Russia: The Legacy of Soviet Medicine. Health Policy. 2008;85:242–51. doi: 10.1016/j.healthpol.2007.08.001. [DOI] [PubMed] [Google Scholar]
- Falkingham J, Akkazieva B, Baschieri A. Trends in Out-of-Pocket Payments for Health Care in Kyrgyzstan, 2001-2007. Health Policy Plan. 2010;25(5):427–36. doi: 10.1093/heapol/czq011. [DOI] [PMC free article] [PubMed] [Google Scholar]
- Field MG, Twigg JL. Russia's Torn Safety Nets: Health and Social Welfare during the Transition. New York: St Martin's Press; 2000. [Google Scholar]
- Figueras J, McKee M, Cain J, Lessof S. Health Systems in Transition: Learning from Experience. Copenhagen: European Observatory on Health Care Systems; 2004. [Google Scholar]
- Gaal P, McKee M. Informal Payment for Health Care and the Theory of ‘INXIT’. The International Journal of Health Planning and Management. 2004;19(2):163–78. doi: 10.1002/hpm.751. [DOI] [PubMed] [Google Scholar]
- Gotsadze G, Gaal P. Coverage Decisions: Benefit Entitlements and Patient Cost Sharing. In: Kutzin J, Cashin C, Jakab M, editors. Implementing Health Financing Reform: Lessons from Countries in Transition. Copenhagen: World Health Organization; 2010. pp. 187–217. [Google Scholar]
- Gotsadze G, Zoidze A, Vasadze O. Reform Strategies in Georgia and Their Impact on Health Care Provision in Rural Areas: Evidence from a Household Survey. Social Science and Medicine. 2005;60:809–21. doi: 10.1016/j.socscimed.2004.06.017. [DOI] [PubMed] [Google Scholar]
- Hakobyan T, Nazaretyan M, Makarova T, Aristakesyan M, Margaryants H, Nolte E. Armenia: Health System Review. Health Systems in Transition. 2006;8(6):1–180. [Google Scholar]
- Healy J, McKee M. Health Sector Reform in Central and Eastern Europe: The Professional Dimension. Health Policy and Planning. 1997;12:186–95. doi: 10.1093/heapol/12.4.286. [DOI] [PubMed] [Google Scholar]
- Healy J, McKee M. Implementing Hospital Reform in Central and Eastern Europe. Health Policy and Planning. 2002;61:1–19. doi: 10.1016/s0168-8510(01)00213-5. [DOI] [PubMed] [Google Scholar]
- Jakab M, Kutzin J. Improving Financial Protection in Kyrgyzstan through Reducing Informal Payments. Evidence from 2001–06. Bishkek: Health Policy Analysis Unit (DFID/WHO); 2009. Policy Research Paper 57. [Google Scholar]
- Jowett M, Shishkin S. Extending Population Coverage in the National Health Insurance Scheme in the Republic of Moldova. Copenhagen: World Health Organization, Regional Office for Europe; 2010. Health Financing Policy Paper 2010/1. [Google Scholar]
- Kutzin J, Cashin C, Jakab M. Implementing Health Financing Reform: Lessons from Countries in Transition. Copenhagen, Denmark: World Health Organization, on behalf of the European Observatory on Health Systems and Policies; 2010. [Google Scholar]
- Kutzin J, Jakab M, Cashin C. Lessons from Health Financing Reform in Central and Eastern Europe and the Former Soviet Union. Health Economics, Policy, and Law. 2010;5(2):135–47. doi: 10.1017/S1744133110000010. [DOI] [PubMed] [Google Scholar]
- Kutzin J, Jakab M, Shishkin S. From Scheme to System: Social Health Insurance Funds and the Transformation of Health Financing in Kyrgyzstan and Moldova. Advances in Health Economics and Health Services Research. 2009;21:291–312. [PubMed] [Google Scholar]
- Lewis M. Who Is Paying for Health Care in Eastern Europe and Central Asia? Washington, DC: World Bank; 2000. [Google Scholar]
- Ministry of Health. Evaluation of National Health Programme “Manas Taalimi”. Bishkek: Ministry of Health; 2011. [Google Scholar]
- Pomerleau J, Gilmore A, McKee M, Rose R, Haerpfer CW. Determinants of Smoking in Eight Countries of the Former Soviet Union: Results from the Living Conditions, Lifestyles and Health Study. Addiction. 2004;99:1577–85. doi: 10.1111/j.1360-0443.2004.00885.x. [DOI] [PubMed] [Google Scholar]
- Rechel B, McKee M. The Effects of Dictatorship on Health: The Case of Turkmenistan. BMC Medicine. 2007;5:21. doi: 10.1186/1741-7015-5-21. [DOI] [PMC free article] [PubMed] [Google Scholar]
- Rechel B, McKee M. Health Reform in Central and Eastern Europe and the Former Soviet Union. Lancet. 2009;374(9696):1186–95. doi: 10.1016/S0140-6736(09)61334-9. [DOI] [PubMed] [Google Scholar]
- Rechel B, Ahmedov M, Akkazieva B, Katsaga A, Khodjamurodov G, McKee M. Lessons from Two Decades of Health Reform in Central Asia. Health Policy and Planning. 2011 doi: 10.1093/heapol/czr040. [Epub ahead of print] [DOI] [PubMed] [Google Scholar]
- Rese A, Balabanova D, Danishevski K, McKee M, Sheaff R. Implementing General Practice in Russia: Getting beyond the First Steps. British Medical Journal. 2005;331(7510):204–7. doi: 10.1136/bmj.331.7510.204. [DOI] [PMC free article] [PubMed] [Google Scholar]
- Richardson E, Roberts B, Sava V, Menon R, McKee M. Health Insurance Coverage and Health Care Access in Moldova. Health Policy and Planning. 2011 doi: 10.1093/heapol/czr024. [Epub ahead of print] [DOI] [PubMed] [Google Scholar]
- Roberts BW, Banaian K. Remittances in Armenia: Size, Impacts, and Measures to Enhance Their Contribution to Development. Yerevan: USAID; 2004. [Google Scholar]
- Roberts B, Stickley A, Balabanova D, McKee M. Irregular Treatment of Hypertension in the Former Soviet Union. The Journal of Epidemiology and Community Health. 2010 doi: 10.1136/jech.2010.111377. [Epub ahead of print] [DOI] [PubMed] [Google Scholar]
- WHO. Everybody's Business: Strengthening Health Systems to Improve Health Outcomes. WHO's Framework for Action. Geneva: World Health Organization; 2007. [Google Scholar]
- World Bank. World Development Indicators. Washington, DC: World Bank; 2010. [accessed March 2011]. Available at: http://data.worldbank.org/indicator. [Google Scholar]
Associated Data
This section collects any data citations, data availability statements, or supplementary materials included in this article.