Abstract
Glu (glutamate), the excitatory transmitter at the main signalling pathway in the retina, is critically involved in changes in the protein repertoire through the activation of signalling cascades, which regulate protein synthesis at transcriptional and translational levels. Activity-dependent differential gene expression by Glu is related to the activation of ionotropic and metabotropic Glu receptors; however, recent findings suggest the involvement of Na+-dependent Glu transporters in this process. Within the retina, Glu uptake is aimed at the replenishment of the releasable pool, and for the prevention of excitotoxicity and is carried mainly by the GLAST/EAAT-1 (Na+-dependent glutamate/aspartate transporter/excitatory amino acids transporter-1) located in Müller radial glia. Based on the previous work showing the alteration of GLAST expression induced by Glu, the present work investigates the involvement of GLAST signalling in the regulation of protein synthesis in Müller cells. To this end, we explored the effect of D-Asp (D-aspartate) on Ser-2448 mTOR (mammalian target of rapamycin) phosphorylation in primary cultures of chick Müller glia. The results showed that D-Asp transport induces the time- and dose-dependent phosphorylation of mTOR, mimicked by the transportable GLAST inhibitor THA (threo-β-hydroxyaspartate). Signalling leading to mTOR phosphorylation includes Ca2+ influx, the activation of p60src, phosphatidylinositol 3-kinase, protein kinase B, mTOR and p70S6K. Interestingly, GLAST activity promoted AP-1 (activator protein-1) binding to DNA, supporting a function for transporter signalling in retinal long-term responses. These results add a novel receptor-independent pathway for Glu signalling in Müller glia, and further strengthen the critical involvement of these cells in the regulation of glutamatergic transmission in the retina.
Keywords: excitatory amino acid, gene expression regulation, signalling
Abbreviations: AMPA, α-amino-3-hydroxy-5-methylisoxazole-4-propionic acid; AP-1, activator protein-1; EAAT1-5, excitatory amino acids transporters 1-5; 4E-BP, 4E-binding protein; GLAST, Na+-dependent glutamate/aspartate transporter; iGluR, ionotropic receptor; KA, kainite; MGC, Müller glia cells; mGluRs; mGluRs, G-protein-coupled metabotropic receptors; mTOR, mammalian target of rapamycin; NMDA, N-methyl-D-aspartate; PBS, phosphate-buffer saline; PDC, L-trans-pyrrolidine-2,4-dicarboxylic acid; PKB/Akt, protein kinase B; p70S6K, 70 kDa S6 ribosomal kinase; RTK, receptor tyrosine kinase; Src, non-receptor tyrosine kinase p60src; T3MG, (±)-threo-3-methylglutamic acid; THA, threo-β-hydroxyaspartate
INTRODUCTION
Glu (glutamate), the main excitatory neurotransmitter in the radial signalling pathway of the vertebrate retina (Massey and Miller, 1990), regulates proliferation, migration and survival of neuronal progenitors and immature neurons (Guerrini et al., 1995). It also plays a key role in the regulation of gene expression required for physiological adaptive processes, including synaptic plasticity (Thomas and Huganir, 2004; Wang et al., 2007).
The ability of Glu to drive a diversity of functions relates to its interaction with a wide variety of receptor subtypes and transporters that act independently or in combination to attain differential responses. Glutamatergic activity is mediated by iGluRs (ionotropic receptors) and mGluRs (G-protein-coupled metabotropic receptors). The superfamily of iGluRs includes the Na+- or Ca2+-permeable cation channels NMDA (N-methyl-d-aspartate), AMPA (α-amino-3-hydroxy-5-methylisoxazole-4-propionic acid) and KA (kainite) receptors. Eight mGluRs, linked to the activation of second messenger cascades, have been identified (Michaelis, 1998), coupled to the stimulation of phospholipase C and the release of intracellular Ca2+ (Group I), or to the inhibition of adenylyl cyclase (Groups II and III) (Coutinho and Knopfel, 2002).
Glia cells respond to neurotransmitters through the activation of specific receptors and intracellular pathways, which directly or indirectly modify the neuronal activity (Fields and Stevens-Graham, 2002). Among its functions, MGC (Müller glia cells), the main type of retinal glia, are responsible for potassium homoeostasis, lactate supply to neurons, pH regulation and neurotransmitter removal (Hollander et al., 1991; Lopez-Colome and Romo-de-Vivar, 1991; Rauen and Kanner, 1994; Lopez et al., 1997; Bringmann et al., 2009).
Owing to their close apposition to synaptic contacts in both plexiform layers of the retina, MGC are exposed to synaptically released Glu, and are involved in the recycling of Glu through the Glu/glutamine neuron–glia shuttle, which provides Glu supply to the presynaptic terminals. Also along this line, the activation of Glu receptors in Müller cells feeds back on to neurons by triggering the release of neuroactive compounds (Uchihori and Puro, 1993; Lopez-Colome et al., 1995; Lopez et al., 1998; Lopez-Bayghen et al., 2006).
mTOR (mammalian target of rapamycin), now officially known as mechanistic TOR, is a protein kinase involved in the regulation of a wide range of cellular processes including protein synthesis, gene transcription, the cell cycle and autophagy (Proud, 2007; Laplante and Sabatini, 2012), and it has been implicated in cancer and other diseases, as well as in the control of lifespan and aging (Blagosklonny, 2010). mTOR forms the catalytic core of two different complexes: mTOR complex 1 (mTORC1) and mTOR complex 2 (mTORC2) that differ in composition; while complex 1 contains raptor, complex 2 is composed of rictor, Sin1 and protor. Both complexes contain mLST8 (Wang and Proud, 2011). mTORC1 but not mTORC2 is inhibited by a low concentration of the macrolide rapamycin; in an over-simplified scenario, mTORC1 mediates the mTOR effects that are rapamycin-sensitive. An accepted index of mTOR activation is Ser-2448 phosphorylation as the result of a signalling cascade involving PI3K (phosphoinositide 3-kinase), PDK1 (phosphoinositide-dependent kinase 1), mTORC2 and PKB/Akt (protein kinase B), which can phosphorylate mTORC1 (Foster and Fingar, 2010). Phosphorylated mTORC1 acts on p70S6K (70 kDa S6 ribosomal kinase), 4E-BP (4E-binding protein), eEF2K (eukaryotic elongation factor 2 kinase) and eEF1A (eukaryotic elongation factor 1A), increasing translation. It should be noted that p70S6K also phosphorylates mTOR at Ser-2448, which is assumed to be an additional level of mTOR regulation (Rosner and Hengstschlager, 2010).
Glu concentration at the synaptic cleft requires tight regulation in order to avoid excitotoxic neuronal death (Mattson, 2003; Olney, 2003). Such regulation is accomplished through the removal of Glu by a family of Na+-dependent transporters expressed in neurons and glia (Danbolt, 2001). To date, five subtypes of transporters known as EAAT1–5 (excitatory amino acids transporters 1–5) have been reported. The glia transporters EAAT-1 [GLAST (Na+-dependent glutamate/aspartate transporter)] and EAAT-2 (GLT-1) are responsible for more than 90% of the Glu uptake in the brain. In the retina, although the expression of EAAT-4 has been reported (Fyk-Kolodziej et al., 2004), GLAST, located in Müller cells, is the predominant transporter responsible for Glu reuptake (Gadea et al., 2004).
Evidence has accumulated suggesting that Glu transporters might be involved in intracellular signalling. In fact, Glu and transportable blockers down-regulate Glu uptake in a receptor-independent manner (Gonzalez and Ortega, 2000; Gadea et al., 2004). Furthermore, the coupling of GLAST/EAAT-1 activity to the Na+/K+ ATPase in astrocytes (Gegelashvili et al., 2007; Rose et al., 2009) and to the promotion of mTOR phosphorylation in cerebellar glia (Zepeda et al., 2008) has also been reported.
Dysfunction of EAATs is specifically involved in excitotoxic neuronal death under pathological neurodegenerative conditions and ischaemic stroke injury, characterized by the elevation of extracellular Glu. Hence, the characterization of signalling mechanisms activated by transporter function may provide tools for the modulation of EAAT function under pathological conditions.
In order to provide evidence for GLAST/EAAT-1-mediated Glu signalling in the vertebrate retina, we analysed transporter-dependent mTOR phosphorylation in primary cultures of chick MGC. Our results show that GLAST activity triggers Ca2+ influx, and increases mTOR phosphorylation and AP-1 (activator protein-1) DNA-binding activity, suggesting that Glu imbalance could alter the translation of proteins involved in gene regulation in the retina.
MATERIALS AND METHODS
Materials
Tissue culture reagents were obtained from GE Healthcare. Wortmannin, amiloride [3,5-diamino-6-chloro-N-(diaminomethylene)pyrazine-2-carboxamide], PP2 {4-amino-5-(4-chlorophenyl)-7-(dimethylethyl)pyrazolo[3,4-d]pyrimidine}, W7 [N-(6-aminohexyl)-5-chloro-1-naphthalenesulfonamide], AMPA, KA acid, NMDA, CNQX (6-cyano-7-nitroquinoxaline-2,3-dione), DL-TBOA (dl-threo-b-benzyloxyaspartic acid), THA (threo-β-hydroxyaspartate), D-Asp and Glu were all obtained from Tocris-Cookson. 45Ca2+ and [α32P]dATP was from PerkinElmer. Polyclonal anti-phospho-mTOR (Ser-2448) and anti-mTOR antibodies (05-235) were purchased from Cell Signalling Technology. Anti-phospho-p60src (Tyr-527) was obtained from Abcam. Horseradish peroxidase-linked anti-rabbit antibodies and the enhanced chemiluminescence reagent (ECL) were obtained from Amersham Biosciences. PDC (l-trans-pyrrolidine-2,4-dicarboxylic acid), T3MG [(±)-threo-3-methylglutamic acid] and all other chemicals were purchased from Sigma.
Cell culture and stimulation protocol
Primary cultures of retina MGC were prepared from 7-day-old chick embryos as previously described (Lopez-Colome et al., 1993). The cells were plated in 6- or 24-well plastic culture dishes in OptiMEM containing 4% foetal bovine serum, 2 mM glutamine and gentamicin (50 μg/ml) and used on the 10th to the 12th day in the culture. Before any treatment, confluent monolayers were serum-deprived with 0.5% bovine serum albumin in OptiMEM for 30 min and then treated as indicated. Inhibitors were included 30 min prior to agonist addition. Glu and its analogues were added to the medium for the indicated time periods; following treatment, the medium was replaced by 0.5% albumin/OptiMEM.
SDS/PAGE and Western blots
Cells from confluent monolayers were harvested in PBS (phosphate-buffered saline) (10 mM K2HPO4/KH2PO4, 150 mM NaCl, pH 7.4) containing phosphatase inhibitors (10 mM NaF, 1 mM Na2MoO4 and 1 mM Na3VO4). The cells were lysed with RIPA buffer (50 mM Tris/HCl, 1 mM EDTA, 150 mM NaCl, 1 mM PMSF, 1 mg/ml aprotinin, 1 mg/ml leupeptin, 1% NP-40, 0.25% sodium deoxycolate, 10 mM NaF, 1 mM Na2MoO4 and 1 mM Na3VO4, pH 7.4). Cell lysates were denatured in Laemmli's buffer, and proteins resolved by SDS/PAGE (6–10% gel) and electroblotted on to nitrocellulose membranes. Blots were stained with Ponceau S to confirm that protein content was equal in all lanes. Membranes were soaked in PBS to remove the Ponceau S and incubated in 50 mM Tris/HCl, pH 7.4, and 150 mM NaCl (TBS) containing 5% dried skimmed milk and 0.1% Tween 20 for 60 min to block the excess of non-specific protein binding sites. The membranes were then incubated overnight at 4°C with the primary antibodies indicated in each Figure, followed by the corresponding secondary antibodies. Immunoreactive polypeptides were detected by chemiluminescence and exposed to X-ray films. Densitometric analyses were performed and data were analysed with Prism from GraphPad Software.
45Ca2+ Influx
Confluent MGC monolayers seeded in 24-well plates were washed three times to remove all non-adhering cells with 0.5 ml aliquots of solution A containing 25 mM Hepes/Tris, 130 mM NaCl, 5.4 mM KCl, 1.8 mM CaCl2, 0.8 mM MgCl2, 33.3 mM glucose and 1 mM NaH2PO4 at pH 7.4. The Glu- or D-Asp-induced 45Ca2+ influx was initiated at t = 0 by the addition of 0.5 ml of solution A containing 1.5 μCi of 45Ca2+/ml solution A, Glu or D-Asp at a given concentration. When tested, inhibitors or modulators were included 30 min prior to the addition of 45Ca2+. The reaction was stopped by aspirating the radioactive medium and washing each well within 15 s with 0.5 ml aliquots of an ice-cold solution A. The cells were digested in 0.5 ml of 1 M NaOH for 2 h at 37°C. The radioactivity contained in each fraction was determined using a Beckmann 7800LS scintillation counter in the presence of a scintillation cocktail. All experiments were performed in triplicate.
EMSAs (electrophoretic mobility-shift assays)
After the stimulation period, the cells were shifted to complete culture media for 1 h and nuclear extracts were prepared as described previously (Zepeda et al., 2008). All the buffers contained a protease inhibitor cocktail to prevent nuclear factor proteolysis. Protein concentration was measured using the Bradford method. Nuclear extracts (approximately 20 μg) from control or treated MGC were incubated on ice with 500 ng of poly[(dI-dC)] as non-specific competitor (LG Healthcare) and 1 ng of [32P]-end labelled double-stranded AP-1 (SV40) oligonucleotide: 5′-CTAGTTCCGGCTGAGTCATCAAGC-3′
The reaction mixtures were incubated for 20 min on ice, and the proteins were separated by electrophoresis in SDS/PAGE (6% gels) in a low ionic strength 0.5X TBE buffer. The gels were vacuum-dried and exposed to an auto-radiographic film overnight.
Statistical analysis
Data are expressed as the mean (average) ± standard error (S.E.). A one-way analysis of variance (ANOVA) (Kruskal–Wallis test) and Dunn's post-hoc test were performed to determine significant differences between conditions with the Prism software.
RESULTS
Glu- and D-Asp-induced mTOR phosphorylation in MGCs
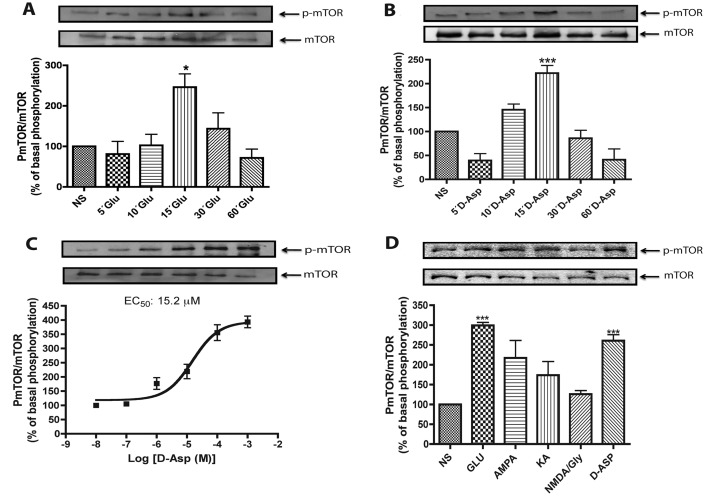
mTOR is a fundamental kinase involved in translational control, the fine-tuning process of gene expression. As Glu is known to modify this process, we investigated a possible Glu transport-mediated change in mTOR phosphorylation pattern in retinal MGC. As depicted in Figure 1(A), inclusion of 1 mM Glu induced a fast time-dependent increase in Ser-2448 mTOR phosphorylation, reaching a maximal value at 15 min. No apparent changes in mTOR levels were observed in this condition. The results presented in Figure 1(B) show that a time-dependent increase in mTOR phosphorylation by Glu was also induced by 1 mM D-Asp. The return of mTOR phosphorylation to basal levels in both conditions suggests a Glu- or D-Asp-dependent p70S6K dephosphorylation that through a feedback loop would decrease mTOR Ser-2448 phosphorylation (Harrington et al., 2004; Um et al., 2004; Rosner and Hengstschlager, 2010).
Figure 1. D-Asp induces Ser-2448 mTOR phosphorylation.
(A) MGC were treated with 1 mM Glu for the indicated time periods, and the level of total and Ser-2448 phosphorylated mTOR were analysed by Western blot as described in the Materials and methods section. (B) Confluent MGC monolayers were treated with 1 mM D-Asp for the indicated time periods. The level of mTOR phosphorylation was determined as described for (A). (C) Müller glia cultures were exposed for 15 min to increasing D-Asp concentrations; the EC50 was calculated from the densitometric analysis using the Prism program (GraphPad). (D) Cells were incubated for 15 min with vehicle (NS), Glu (1 mM) or the Glu analogues AMPA (1 mM), KA (1 mM), NMDA (1 mM) plus 10 μM glycine (NMDA/Gly), and D-Asp (1 mM). The results are presented as the mean ±S.E. of at least three independent experiments. In each panel, a representative Western blot is shown. Statistical analysis was performed comparing against non-stimulated cells using a non-parametric one-way ANOVA (Kruskal–Wallis test) and Dunn's post-hoc test (*P<0.05, ***P<0.001).
Exposure of MGC cultures to increasing concentrations of D-Asp for 15 min reveals a clear dose-dependency with an apparent EC50 of 15.2 μM (Figure 1C), indicating the specificity of the effect. It should be noted that this value is only indicative of a receptor/transporter-mediated effect, as it does not take into consideration the amplification inherent to signalling cascades (Kholodenko, 2006).
In order to discard the contribution of Glu receptors to the observed effects, the cells were treated with 1 mM of the specific ionotropic receptor agonists: AMPA, KA and NMDA plus glycine (10 μM). A discrete non-significant increase in mTOR phosphorylation by AMPA and KA was detected (Figure 1D), suggesting that the transporter activity is responsible for most, if not all, of the Glu-induced mTOR phosphorylation.
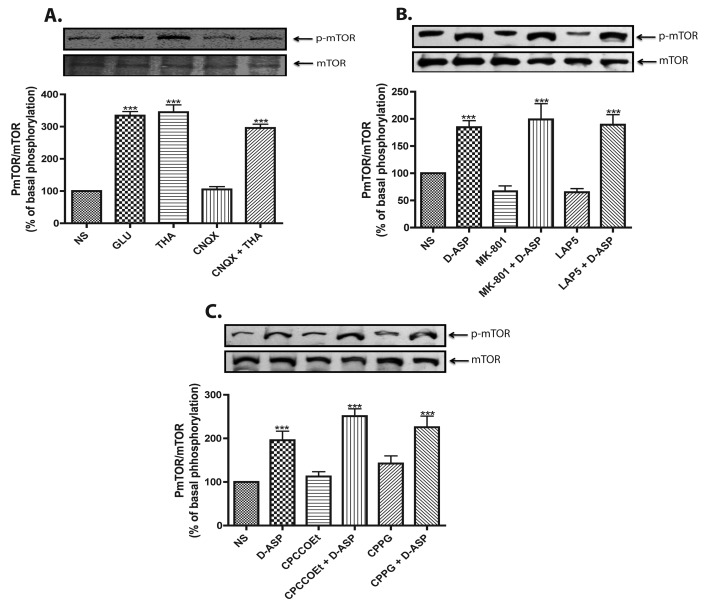
In order to confirm these results, MGC were treated for 30 min, prior to D-Asp or THA addition, with 50 μM of the non-NMDA iGluR antagonist CNQX (Figure 2A), the NMDA receptor antagonist MK-801, the group I mGluR antagonist LAP5, or with CPCCOEt, the group II/III mGluR antagonist (Figures 2B and 2C). The results showed that Glu receptor antagonists failed to block the increase in mTOR phosphorylation induced by D-Asp or THA, further supporting the fact that the effect of Glu on mTOR is mainly transporter-mediated. Moreover, as D-Asp does not activate Glu receptors, the lack of a statistically significant difference between the Glu- and D-Asp-induced effects further indicates that mTOR phosphorylation is transporter-mediated.
Figure 2. D-Asp-induced mTOR phosphorylation is GLAST activity-dependent.
In all panels phosphorylated mTOR was detected as described for Figure 1. (A) MGC monolayers were incubated for 15 min with Glu (1 mM), THA (100 μM), the AMPA receptor antagonist CNQX (50 μM), and CNQX plus THA, in this case CNQX was added 30 min prior to THA treatment (100 μM, 15 min). MGC cultures were pre-exposed to NMDA receptor antagonists MK-801 (5 μM) or LAP5 (10 μM) (B) and to metabotropic Glu receptors antagonists, for group I CPCCOEt (100 μM) and for group II/III CPPG (300 μM) (C), 30 min prior to D-Asp treatment (1 mM, 15 min). Data are expressed as the mean ±S.E. of at least three independent experiments. Representative Western blots are shown for each condition. Statistical analysis was performed comparing against non-stimulated cells using a non-parametric one-way ANOVA (Kruskal–Wallis test) and Dunn's post-hoc test (*P<0.05, ***P<0.001).
GLAST/EAAT-1-dependent mTOR phosphorylation
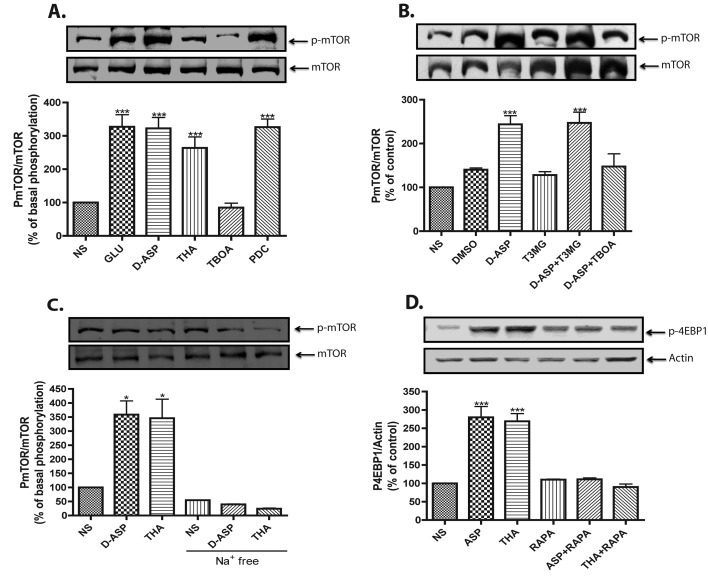
In order to directly confirm that the D-Asp-induced increase in mTOR phosphorylation relies on GLAST/EEAT-1 transport activity, the effect of transportable and non-transportable GLAST inhibitors was analysed. As shown in Figure 3(A), D-Asp-induced increase in mTOR phosphorylation was mimicked by 100 μM of the transportable inhibitors THA and PDC. In contrast, the non-transportable inhibitor TBOA (100 μM) had no effect. As the expression of EAAT-4 in MGC has been recently reported (Fyk-Kolodziej et al., 2004), we evaluated the involvement of this transporter in mTOR phosphorylation. As clearly shown in Figure 3(B), pretreatment with the specific EAAT-4 blocker T3MG did not alter the D-Asp response, ruling out the participation of EAAT-4.
Figure 3. D-Asp-induced mTOR phosphorylation is transport-dependent event.
(A) MGC monolayers were incubated for 15 min with vehicle (NS), Glu (1 mM), D-Asp (1 mM) or EAAT blockers, THA (100 μM), TBOA (100 μM) and PDC (100 μM), and the levels of Ser-2448 phosphorylated mTOR and total mTOR were detected via Western blots. (B) Cultured cells were treated with EAAT-4 blocker T3MG (200 μM) or TBOA (100 μM) for 30 min, prior to the addition of 1 mM D-Asp for 15 min, DMSO (0.01%) was used as a vehicle control. (C) MGC monolayers were exposed to vehicle (NS), D-Asp (1 mM) or THA (100 μM), in complete or Na+-free assay buffer and then the phosphorylation of mTOR was analysed. (D) Levels of Thr 70 phosphorylated 4E-BP were detected after treatment with 1 mM D-Asp or 100 μM THA in the presence or absence of 100 nM rapamicin (RAPA) for 30 min; actin was used as loading control. Data are expressed as the mean ±S.E. of at least three independent experiments. Representative Western blots are shown for each condition. Statistical analysis was performed comparing against non-stimulated cells using a non-parametric one-way ANOVA (Kruskal–Wallis test) and Dunn's post-hoc test (*P<0.05, ***P<0.001).
If, indeed, the effect of D-Asp and THA is mediated by GLAST activity, it should be abolished in the Na+-free medium. As clearly shown in Figure 3(C), mTOR phosphorylation was completely prevented by substituting choline chloride for NaCl, clearly demonstrating the involvement of Na+-dependent transport in this process. In order to provide evidence for transporter-mediated mTOR activation, we explored the phosphorylation of one of its substrates, 4E-BP; the results are shown in Figure 4(D). Exposure of the cultured cells to D-Asp or THA results in a rapamycin-sensitive increase in 4E-BP phosphorylation.
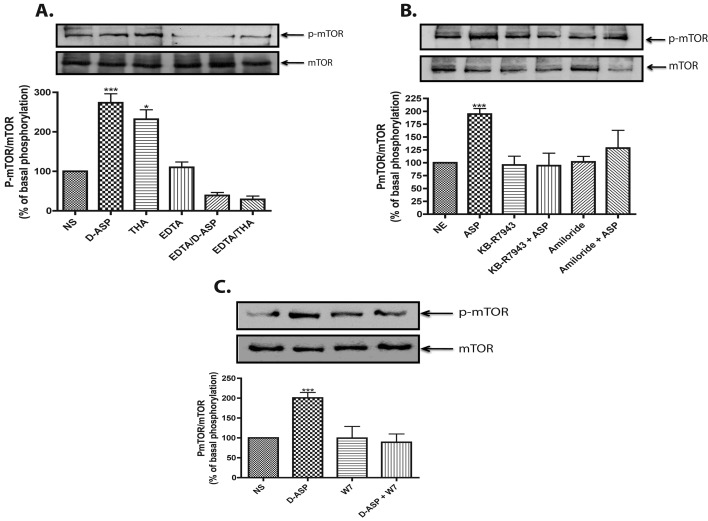
Figure 4. D-Asp-induced mTOR phosphorylation is a Na+/Ca2+ exchanger-dependent event.
mTOR phosphorylation was detected as for Figure 1. (A) Monolayers were incubated in normal or Ca2+-free medium supplemented with EDTA (500 μM, 30 min), and then treated with D-Asp (1 mM) or THA (100 μM) for 15 min. (B) MGC were stimulated with D-Asp (1 mM, 15 min) in the presence or absence of the Na+/Ca2+ exchanger inhibitors amiloride (10 μM) or KB-R7943 (15 μM) added 30 min prior to D-Asp treatment. (C) MGC monolayers were pretreated (30 min) with the calmodulin antagonist, W7 (25 μM) prior treatment with D-Asp (1 mM, 15 min). The results are the mean ±S.E. of at least three independent experiments. In each panel a representative Western blot is shown. Statistical analysis was performed comparing against non-stimulated cells using a non-parametric one-way ANOVA (Kruskal–Wallis test) and Dunn's post-hoc test (*P<0.05, ***P<0.001).
GLAST-induced mTOR phosphorylation is Ca2+-dependent
Intracellular Na+ increase driven by GLAST may activate Na+/Ca2+ exchange, leading to an increase in intracellular Ca2+ concentration. In order to assess the Ca2+-dependence of the GLAST response, the cells were treated with D-Asp or THA in Ca2+-free medium supplemented with 500 μM EDTA. As shown in Figure 4(A), removal of extracellular Ca2+ fully prevented the GLAST effect on mTOR phosphorylation. These results demonstrate that GLAST-mediated mTOR phosphorylation requires Ca2+ influx. As a possible mechanism linking transporter activity to Ca2+ entry, the activation of the Na+/Ca2+ exchanger by GLAST-mediated Na+ influx was explored using the inhibitors amiloride and KB-R7943. The results in Figure 4(B) show that both compounds prevented D-Asp-induced mTOR phosphorylation. Since calmodulin is the main Ca2+ intracellular receptor, its possible participation in GLAST induction of Ca2+-dependent mTOR activation was explored. The results in Figure 4(C) show that 25 μM of the calmodulin antagonist W7 fully prevented the D-Asp response. Collectively, these data indicate that the D-Asp increase in mTOR phosphorylation is achieved through the entry of Na+ as a result of GLAST activity and the consequent activation of the Na+/Ca2+ exchanger, which, in turn, increases the intracellular Ca2+ that binds to calmodulin.
GLAST-induced 45Ca2+ influx
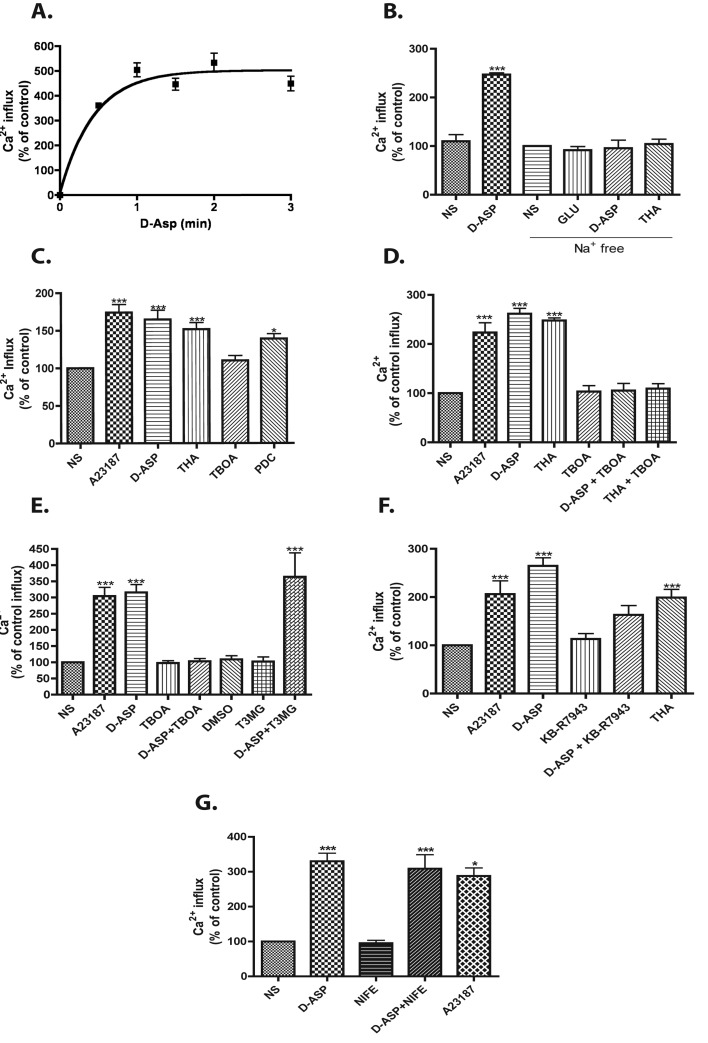
To further confirm this conclusion, confluent MGC cultures were exposed to a 1 mM D-Asp solution containing 1 μCi/ml 45Ca2+ for various time periods. As shown in Figure 5(A), D-Asp induced a fast time-dependent influx of 45Ca2+, which saturated at 3 min. As expected, removal of extracellular Na+ ions prevents the D-Asp-induced 45Ca2+ influx (Figure 5B). A fixed 10 μM concentration of the Ca2+ionophore A23187, as well as THA and PDC, also evoked significant entry of the radioactive ion (Figure 5C). In contrast, the non-transportable GLAST inhibitor TBOA did not induce 45Ca2+ influx (Figure 5D). The EAAT-4 blocker T3MG failed to prevent the D-Asp-evoked response (Figure 5E). Furthermore, the Na+/Ca2+ exchanger specific inhibitor KB-R7943 prevented the D-Asp-triggered increase in 45Ca2+ influx (Figure 5F), clearly indicating a transporter-induced effect. To rule out the participation of the L-type voltage-gated Ca2+ channels (VGCC), confluent MGC cultures were pre-incubated with 10 μM nifedipine and the effect of D-Asp measured. As shown in Figure 5(G), pre-incubation with nifedipine did not modify the D-Asp-dependent Ca2+ influx.
Figure 5. GLAST activity induces 45Ca2+ entry.
(A) MGC were incubated with 1 mM D-Asp at room temperature, and 45Ca2+ uptake was measured at the indicated time periods (0, 0.5, 1, 1.5, 2 and 3 min). (B) Monolayers were incubated in complete or Na+-free assay buffer and treatment with Glu (1 mM), D-Asp (1 mM) or THA (100 μM). (C) 45Ca2+ influx was determined in the presence of 1 mM D-Asp, 100 μM THA, 100 μM TBOA or 100 μM PDC. The Ca2+ ionophore A23187 (10 μM) was used as a positive control. All drugs were included for 3 min. (D) Cells were pre-exposed for 30 min to the non-transportable Glu transport blocker TBOA 100 μM and then to D-Asp 1 mM and THA 100 μM, the influx time was 3 min. (E) MGC were incubated with TBOA (100 μM) or EAAT-4 blocker T3MG (200 μM) for 30 min prior the D-Asp treatment and then 45Ca2+ uptake was measured. (F) Monolayers were pre-incubated (30 min) in presence or absence of KB-R7943 (15 μM) and treatment with D-Asp (1 mM). (G) MGC were pre-incubated for 30 min with the L-type VGCC blocker nifedipine (NIFE, 10 μM), and then exposed to 1 mM D-Asp. The Ca2+ ionophore A23187 10 μM was used as a positive control. The different drugs were present during the 3 min of 45Ca2+ influx. Values represent the mean ±S.E. of at least three independent experiments performed in triplicate. Statistical analysis was performed comparing against non-stimulated cells using a non-parametric one-way ANOVA (Kruskal–Wallis test) and Dunn's post-hoc test (*P<0.05, ***P<0.001).
Intracellular signalling involved in GLAST-mediated mTOR phosphorylation
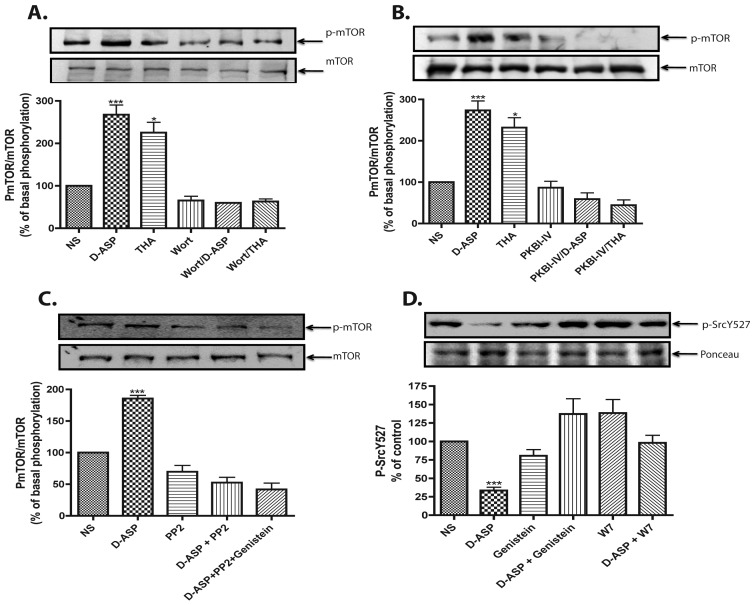
To establish the molecular signalling cascade involved in GLAST-mediated mTOR phosphorylation, we first explored the participation of PI3K, known to act upstream of mTOR in several systems. Pretreatment of MGC for 15 min with 10 nM of the PI3K inhibitor wortmannin, completely prevented the increase in mTOR phosphorylation induced by either D-Asp or THA (Figure 6A).
Figure 6. D-Asp-induced mTOR phosphorylation is a PI3K-PKB/Akt pathway-dependent event.
MGC were pre-incubated for 30 min with 10 nM of the PI3K inhibitor wortmannin (Wort) (A), with 100 nM of the PKB inhibitor (PKBI-IV) (B), or the p60src inhibitor PP2 (10 nM) in the absence or presence of the RTK inhibitor genistein at 25 μM (C); and then treated with D-Asp (1 mM) or THA (100 μM). Levels of mTOR phosphorylation were detected as for Figure 1. (D) Levels of Tyr-527 phosphorylated p60src were detected after treatment with 1 mM D-Asp in the presence/absence of W7 (25 μM) or genistein (25 μM). Phospho-p60src levels were analysed by Western blot, Ponceau S was used as a loading control. The results are the mean ±S.E. of at least three independent experiments. In each panel, a representative Western blot is shown. Statistical analysis was performed comparing against non-stimulated cells using a non-parametric one-way ANOVA (Kruskal-Wallis test) and Dunn's post-hoc test (*P<0.05, ***P<0.001).
The phosphorylation of membrane phosphatidylinositol at the C3-OH position of the inositol ring by PI3K is known to anchor proteins containing PH (pleckstrin homology) domains (Harrington et al., 2004), such as PKB. The results in Figure 6(B) demonstrate that 100 nM of the PKB inhibitor PKBI-IV was capable of preventing the GLAST-mediated effect, indicating the involvement of PKB, downstream of PI3K, in GLAST-dependent mTOR phosphorylation.
Activation of PI3K involves the docking of the regulatory subunit of PI3K to a phosphorylated tyrosine residue (Vanhaesebroeck and Alessi, 2000). We evaluated the possible involvement of the Src (non-receptor tyrosine kinase p60src) in GLAST signalling. As clearly shown in Figure 6(C), MGC pretreatment with 10 nM of the specific Src inhibitor PP2, prevented the D-Asp effect on mTOR. Since Src activation requires Tyr-527 in a dephosphorylated state, we examined the phosphorylation level of this residue in D-Asp-stimulated MGC and showed that, indeed, D-Asp treatment sharply reduced Tyr-527 p60src phosphorylation levels (Figure 6D). This result suggested the participation of an RTK (receptor tyrosine kinase) upstream of Src in GLAST-mediated mTOR phosphorylation. In order to explore this possibility, the effect of the RTK inhibitor genistein (25 μM) was tested. As expected, genistein was capable of preventing the effect of D-Asp (Figure 6D), suggesting a p60src-dependent RTK trans-phosphorylation.
GLAST activity signalling-dependent transcriptional control
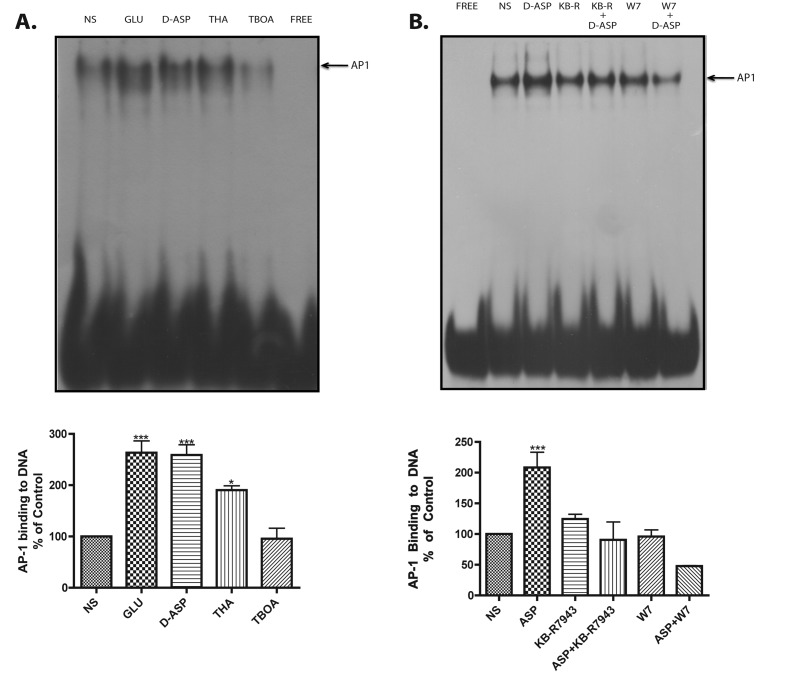
Glu stimulation has been linked to transcriptional control in glial cells (Lopez-Bayghen et al., 2006). Following the demonstration of GLAST-induced Ca2+-dependent activation of the translation regulator mTOR, the possible induction of gene transcription by this process was analysed. We investigated if GLAST activity induced by D-Asp and THA results in increased DNA binding of the inducible transcription factor AP-1, known to be Ca2+-dependent in MGC (Lopez-Colome et al., 1995). The results presented in Figure 7(A), clearly show that D-Asp as well as Glu and THA increase GLAST-mediated AP-1 DNA-binding activity in Müller cells. In order to explore the participation of Na+/Ca2+ exchanger in transcriptional regulation, the effects of the Na+/Ca2+ exchanger inhibitor (KB-R7943) and of the calmodulin antagonist W7 were determined. The results shown in Figure 7(B) clearly demonstrate that Na+/Ca2+ exchanger and calmodulin participates in the transcriptional regulation mediated by GLAST.
Figure 7. GLAST activity signals to AP-1 DNA binding.
(A) EMSAs. Nuclear extracts were prepared from control or treated cells (Glu, D-Asp, THA or TBOA) and binding to the AP-1 consensus sequence was analysed as described in the Materials and methods section. (B) Nuclear extracts were prepared from cells pre-incubated 30 min with Na+/Ca2+ exchanger inhibitor (KB-R7943, 15 μM) and with the calmodulin antagonist (W7, 25 μM), after that treated with D-Asp (1 mM, 90 min) the binding to the AP-1 consensus sequence was analysed. The results are the mean ±S.E. of at least three independent experiments. Statistical analysis was performed comparing against non-stimulated cells using a non-parametric one-way ANOVA (Kruskal–Wallis test) and Dunn's post-hoc test (*P<0.05, ***P<0.001).
DISCUSSION
Traditionally regarded as supportive and passive elements, glia cells have proven to be critically involved in glutamatergic transmission (Eulenburg and Gomeza, 2010). The participation of glia cells in the control of excitatory transmission through the so-called Glu/glutamine shuttle, which replenishes releasable Glu stores in neurons, has been recognized for more than 25 years (Shank and Campbell, 1984). Furthermore, an energetic neuronal dependence on astrocytes has also been described for glutamatergic synapses (Pellerin, 2008). In spite of the fact that most Glu receptors are expressed in glia cells (D'Antoni et al., 2008), the availability of Glu for inter-neuronal and neuron–glia interactions relies on an efficient Glu uptake activity. It is therefore conceivable that transporters may contribute to Glu signalling, particularly in glia cells. In this context, we have described the regulation of Glu removal in radial glia cells by a transporter-mediated process involving the regulation of GLAST/EAAT-1 membrane expression (Gonzalez and Ortega, 2000; Gadea et al., 2004). More recently, the group of Hampson have demonstrated a direct coupling of Glu transporters to the Na,K-ATPase in glia cells (Rose et al., 2009). In such a scenario, it is tempting to speculate that intracellular signalling activated by Glu transporters could be linked to the long-term regulation of glia–neuronal reciprocal interactions in excitatory transmission.
The results from this study clearly show that the transport process itself triggers a signal transduction cascade involving the activation of p60src, PI3K and PKB (Akt) linked to extracellular Ca2+ entry, which leads, not only to the promotion of translation by Ser-2448 phosphorylated mTOR, but also to transcriptional activity mediated by Ca2+-dependent binding of inducible transcription factors, such as the AP-1. In this regard, the activation of CaMKII induces the phosphorylation/activation of RTKs which, in turn, allows PI3K membrane anchoring and activation (Wang and Proud, 2011). We show here, that Ca2+ entry promoted by GLAST activity induces a transient mTOR phosphorylation through p60src/PI3K/Akt/mTOR/p70S6K signalling. It is quite possible that the Ca2+ signal activates phosphatase 2A that would dephosphorylate and inactivate p70S6K, thus reducing mTOR Ser-2448 phosphorylation giving up the transient nature of the effect (Nunbhakdi-Craig et al., 2002). Furthermore, as CaMKII has been shown to activate the expression of c-fos through the MAPK MEK/ERK cascade in Müller glia, the proposed GLAST signalling cascade is supported by the increase in AP-1 binding (Abe and Saito, 2001; Takeda et al., 2002).
As mTOR has been regarded as a master regulator of protein synthesis (Foster and Fingar, 2010) and AP-1 DNA binding is critical for the transcriptional control of a number of genes (Shaulian, 2010), it is possible that the removal of Glu from the synaptic cleft is linked to gene expression regulation in glia cells. A working hypothesis is that specific genes, such as those coding for the Glu transporters, the Na+/K+-ATPase, glutamine synthetase or the neutral amino acid transporters could be the targets of GLAST-dependent gene expression regulation, and could participate actively in glia–neuronal coupling. Work currently in progress in our group is aimed at the identification of these genes. Taking into consideration that mTOR is not only a transducing molecule for mitogenic signals, but also for nutrient availability correlated with protein synthesis for housekeeping glial functions, transporter signalling to mTOR and gene expression could play a role in linking these responses (towards cell division).
The functional significance of signalling through the transporters compared with the cascades activated via Glu receptors, and the fact that both would lead to gene expression regulation in glia cells (Lopez-Bayghen et al., 2006), is elusive at this point. Yet, it is conceivable that the difference in the kinetics of activation, favoured by lower affinity of the transporters and their higher density (Danbolt, 2001), is the basis for a transporter-selective response at the level of transcriptional and/or translational control. Yet another possibility is that an activity-dependent differential distribution of transporters and receptors in detergent-resistant membrane domains and the inclusion or not of differential signalling partners constitutes the molecular basis of the existence of transporter-mediated signal transduction (Butchbach et al., 2004; Gonzalez et al., 2007; Hou et al., 2008).
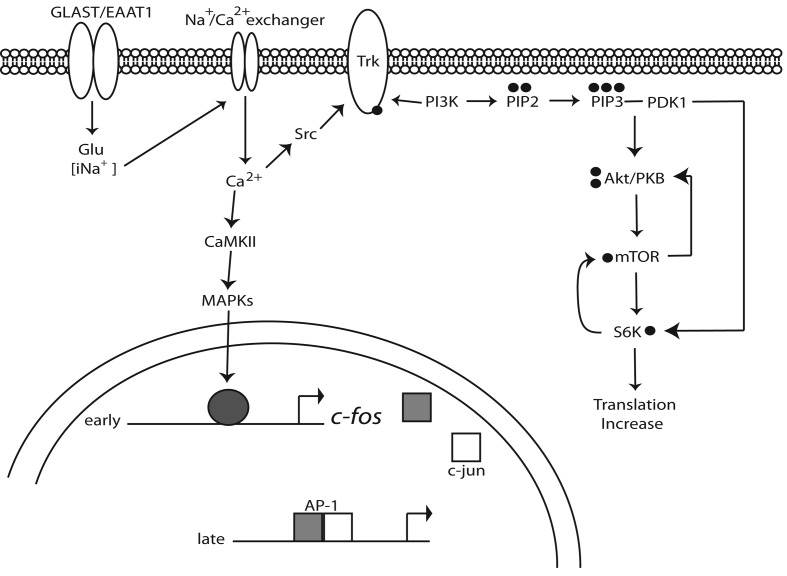
In summary, we demonstrated here that Glu transport in MGC is linked to the activation of signal transduction cascades that lead to gene expression regulation. A description of our present findings is summarized in Figure 8. Our results further strengthen the pivotal role of glia cells in glutamatergic transmission in the retina.
Figure 8. Current model for GLAST signalling in MGC.
Glu uptake leads to an influx of Na+ that activates the Na+/Ca2+ exchanger, resulting in a net Ca2+ influx. The elevation of intracellular Ca2+ leads to the up-regulation of c-fos transcription and the promotion of AP-1 DNA-binding activity. On the other hand, Ca2+ entry results in p60src Tyr-527 dephosphorylation and Trk transactivation, the recruitment and activation of PI3K and Akt/PKB, which, in turn, results in mTOR phosphorylation and an increase in mRNA translation.
ACKNOWLEDGEMENTS
The technical assistance of Luis Cid and Blanca Ibarra and the critical reading of the paper by Professor Angelina Rodríguez are acknowledged.
Footnotes
This work was supported by the Conacyt-Mexico [grant numbers 79502 and 123625 (to A.O.)], PAPIIT/UNAM [grant number IN201812 (to A.M.L.C.)]. Z.M.-L. and A.M.G. are supported by fellowships from Conacyt-Mexico.
REFERENCES
- Abe K, Saito H. Possible linkage between glutamate transporter and mitogen-activated protein kinase cascade in cultured rat cortical astrocytes. J Neurochem. 2001;76:217–223. doi: 10.1046/j.1471-4159.2001.00062.x. [DOI] [PubMed] [Google Scholar]
- Blagosklonny MV. Revisiting the antagonistic pleiotropy theory of aging: TOR-driven program and quasi-program. Cell Cycle. 2010;9:3151–3156. doi: 10.4161/cc.9.16.13120. [DOI] [PubMed] [Google Scholar]
- Bringmann A, Pannicke T, Biedermann B, Francke M, Iandiev I, Grosche J, Wiedemann P, Albrecht J, Reichenbach A. Role of retinal glial cells in neurotransmitter uptake and metabolism. Neurochem Int. 2009;54:143–160. doi: 10.1016/j.neuint.2008.10.014. [DOI] [PubMed] [Google Scholar]
- Butchbach ME, Tian G, Guo H, Lin CL. Association of excitatory amino acid transporters, especially EAAT2, with cholesterol-rich lipid raft microdomains: importance for excitatory amino acid transporter localization and function. J Biol Chem. 2004;279:34388–34396. doi: 10.1074/jbc.M403938200. [DOI] [PubMed] [Google Scholar]
- Coutinho V, Knopfel T. Metabotropic glutamate receptors: electrical and chemical signaling properties. Neuroscientist. 2002;8:551–561. doi: 10.1177/1073858402238514. [DOI] [PubMed] [Google Scholar]
- D'Antoni S, Berretta A, Bonaccorso CM, Bruno V, Aronica E, Nicoletti F, Catania MV. Metabotropic glutamate receptors in glial cells. Neurochem Res. 2008;33:2436–2443. doi: 10.1007/s11064-008-9694-9. [DOI] [PubMed] [Google Scholar]
- Danbolt NC. Glutamate uptake. Prog Neurobiol. 2001;65:1–105. doi: 10.1016/s0301-0082(00)00067-8. [DOI] [PubMed] [Google Scholar]
- Eulenburg V, Gomeza J. Neurotransmitter transporters expressed in glial cells as regulators of synapse function. Brain Res Rev. 2010;63:103–112. doi: 10.1016/j.brainresrev.2010.01.003. [DOI] [PubMed] [Google Scholar]
- Fields RD, Stevens-Graham B. New insights into neuron–glia communication. Science. 2002;298:556–562. doi: 10.1126/science.298.5593.556. [DOI] [PMC free article] [PubMed] [Google Scholar]
- Foster KG, Fingar DC. Mammalian target of rapamycin (mTOR): conducting the cellular signaling symphony. J Biol Chem. 2010;285:14071–14077. doi: 10.1074/jbc.R109.094003. [DOI] [PMC free article] [PubMed] [Google Scholar]
- Fyk-Kolodziej B, Qin P, Dzhagaryan A, Pourcho RG. Differential cellular and subcellular distribution of glutamate transporters in the cat retina. Vis Neurosci. 2004;21:551–565. doi: 10.1017/S0952523804214067. [DOI] [PubMed] [Google Scholar]
- Gadea A, Lopez E, Lopez-Colome AM. Glutamate-induced inhibition of D-aspartate uptake in Muller glia from the retina. Neurochem Res. 2004;29:295–304. doi: 10.1023/b:nere.0000010458.45085.e8. [DOI] [PubMed] [Google Scholar]
- Gegelashvili M, Rodriguez-Kern A, Sung L, Shimamoto K, Gegelashvili G. Glutamate transporter GLAST/EAAT1 directs cell surface expression of FXYD2/gamma subunit of Na, K-ATPase in human fetal astrocytes. Neurochem Int. 2007;50:916–920. doi: 10.1016/j.neuint.2006.12.015. [DOI] [PubMed] [Google Scholar]
- Gonzalez MI, Ortega A. Regulation of high-affinity glutamate uptake activity in Bergmann glia cells by glutamate. Brain Res. 2000;866:73–78. doi: 10.1016/s0006-8993(00)02226-5. [DOI] [PubMed] [Google Scholar]
- Gonzalez MI, Susarla BT, Fournier KM, Sheldon AL, Robinson MB. Constitutive endocytosis and recycling of the neuronal glutamate transporter, excitatory amino acid carrier 1. J Neurochem. 2007;103:1917–1931. doi: 10.1111/j.1471-4159.2007.04881.x. [DOI] [PubMed] [Google Scholar]
- Guerrini L, Blasi F, Denis-Donini S. Synaptic activation of NF-kappa B by glutamate in cerebellar granule neurons in vitro. Proc Natl Acad Sci USA. 1995;92:9077–9081. doi: 10.1073/pnas.92.20.9077. [DOI] [PMC free article] [PubMed] [Google Scholar]
- Harrington LS, Findlay GM, Gray A, Tolkacheva T, Wigfield S, Rebholz H, Barnett J, Leslie NR, Cheng S, Shepherd PR, Gout I, Downes CP, Lamb RF. The TSC1-2 tumor suppressor controls insulin-PI3K signaling via regulation of IRS proteins. J Cell Biol. 2004;166:213–223. doi: 10.1083/jcb.200403069. [DOI] [PMC free article] [PubMed] [Google Scholar]
- Hollander H, Makarov F, Dreher Z, van Driel D, Chan-Ling TL, Stone J. Structure of the macroglia of the retina: sharing and division of labour between astrocytes and Muller cells. J Comp Neurol. 1991;313:587–603. doi: 10.1002/cne.903130405. [DOI] [PubMed] [Google Scholar]
- Hou Q, Huang Y, Amato S, Snyder SH, Huganir RL, Man HY. Regulation of AMPA receptor localization in lipid rafts. Mol Cell Neurosci. 2008;38:213–223. doi: 10.1016/j.mcn.2008.02.010. [DOI] [PMC free article] [PubMed] [Google Scholar]
- Kholodenko BN. Cell-signalling dynamics in time and space. Nat Rev Mol Cell Biol. 2006;7:165–176. doi: 10.1038/nrm1838. [DOI] [PMC free article] [PubMed] [Google Scholar]
- Laplante M, Sabatini DM. mTOR Signaling. Cold Spring Harb Perspect Biol. 2012;4:2. doi: 10.1101/cshperspect.a011593. [DOI] [PMC free article] [PubMed] [Google Scholar]
- Lopez T, Lopez-Colome AM, Ortega A. NMDA receptors in cultured radial glia. FEBS Lett. 1997;405:245–248. doi: 10.1016/s0014-5793(97)00195-6. [DOI] [PubMed] [Google Scholar]
- Lopez T, Lopez-Colome AM, Ortega A. Changes in GluR4 expression induced by metabotropic receptor activation in radial glia cultures. Brain Res Mol Brain Res. 1998;58:40–46. doi: 10.1016/s0169-328x(98)00094-1. [DOI] [PubMed] [Google Scholar]
- Lopez-Bayghen E, Cruz-Solis I, Corona M, Lopez-Colome AM, Ortega A. Glutamate-induced octamer DNA binding and transcriptional control in cultured radial glia cells. J Neurochem. 2006;98:851–859. doi: 10.1111/j.1471-4159.2006.03929.x. [DOI] [PubMed] [Google Scholar]
- Lopez-Colome AM, Romo-de-Vivar M. Excitatory amino acid receptors in cultures of glial cells from the retina. Glia. 1991;4:431–439. doi: 10.1002/glia.440040502. [DOI] [PubMed] [Google Scholar]
- Lopez-Colome AM, Murbartian J, Ortega A. Excitatory amino acid-induced AP-1 DNA binding activity in Muller glia. J Neurosci Res. 1995;41:179–184. doi: 10.1002/jnr.490410205. [DOI] [PubMed] [Google Scholar]
- Lopez-Colome AM, Ortega A, Romo-de-Vivar M. Excitatory amino acid-induced phosphoinositide hydrolysis in Muller glia. Glia. 1993;9:127–135. doi: 10.1002/glia.440090206. [DOI] [PubMed] [Google Scholar]
- Massey SC, Miller RF. N-methyl-D-aspartate receptors of ganglion cells in rabbit retina. J Neurophysiol. 1990;63:16–30. doi: 10.1152/jn.1990.63.1.16. [DOI] [PubMed] [Google Scholar]
- Mattson MP. Excitotoxic and excitoprotective mechanisms: abundant targets for the prevention and treatment of neurodegenerative disorders. Neuromolecular Med. 2003;3:65–94. doi: 10.1385/NMM:3:2:65. [DOI] [PubMed] [Google Scholar]
- Michaelis EK. Molecular biology of glutamate receptors in the central nervous system and their role in excitotoxicity, oxidative stress and aging. Prog Neurobiol. 1998;54:369–415. doi: 10.1016/s0301-0082(97)00055-5. [DOI] [PubMed] [Google Scholar]
- Nunbhakdi-Craig V, Machleidt T, Ogris E, Bellotto D, White CL, 3rd, Sontag E. Protein phosphatase 2A associates with and regulates atypical PKC and the epithelial tight junction complex. J Cell Biol. 2002;158:967–978. doi: 10.1083/jcb.200206114. [DOI] [PMC free article] [PubMed] [Google Scholar]
- Olney JW. Excitotoxicity, apoptosis and neuropyschiatric disorders. Curr Opin Pharmacol. 2003;3:101–109. [PubMed] [Google Scholar]
- Pellerin L. Brain energetics (thought needs food). Curr Opin Clin Nutr Metab Care. 2008;11:701–705. doi: 10.1097/MCO.0b013e328312c368. [DOI] [PubMed] [Google Scholar]
- Proud CG. Cell signaling: mTOR, unleashed. Science. 2007;318:926–927. doi: 10.1126/science.1150653. [DOI] [PubMed] [Google Scholar]
- Rauen T, Kanner BI. Localization of the glutamate transporter GLT-1 in rat and macaque monkey retinae. Neurosci Lett. 1994;169:137–140. doi: 10.1016/0304-3940(94)90375-1. [DOI] [PubMed] [Google Scholar]
- Rose EM, Koo JC, Antflick JE, Ahmed SM, Angers S, Hampson DR. Glutamate transporter coupling to Na,K-ATPase. J Neurosci. 2009;29:8143–8155. doi: 10.1523/JNEUROSCI.1081-09.2009. [DOI] [PMC free article] [PubMed] [Google Scholar]
- Rosner M, Hengstschlager M. Evidence for cell cycle-dependent, rapamycin-resistant phosphorylation of ribosomal protein S6 at S240/244. Amino Acids. 2010;39:1487–1492. doi: 10.1007/s00726-010-0615-2. [DOI] [PubMed] [Google Scholar]
- Shank RP, Campbell GL. Amino acid uptake, content, and metabolism by neuronal and glial enriched cellular fractions from mouse cerebellum. J Neurosci. 1984;4:58–69. doi: 10.1523/JNEUROSCI.04-01-00058.1984. [DOI] [PMC free article] [PubMed] [Google Scholar]
- Shaulian E. AP-1–The Jun proteins: Oncogenes or tumor suppressors in disguise? Cell Signal. 2010;22:894–899. doi: 10.1016/j.cellsig.2009.12.008. [DOI] [PubMed] [Google Scholar]
- Takeda M, Takamiya A, Yoshida A, Kiyama H. Extracellular signal-regulated kinase activation predominantly in Muller cells of retina with endotoxin-induced uveitis. Invest Ophthalmol Vis Sci. 2002;43:907–911. [PubMed] [Google Scholar]
- Thomas GM, Huganir RL. MAPK cascade signalling and synaptic plasticity. Nat Rev Neurosci. 2004;5:173–183. doi: 10.1038/nrn1346. [DOI] [PubMed] [Google Scholar]
- Uchihori Y, Puro DG. Glutamate as a neuron-to-glial signal for mitogenesis: role of glial N-methyl-D-aspartate receptors. Brain Res. 1993;613:212–220. doi: 10.1016/0006-8993(93)90901-x. [DOI] [PubMed] [Google Scholar]
- Um SH, Frigerio F, Watanabe M, Picard F, Joaquin M, Sticker M, Fumagalli S, Allegrini PR, Kozma SC, Auwerx J, Thomas G. Absence of S6K1 protects against age- and diet-induced obesity while enhancing insulin sensitivity. Nature. 2004;431:200–205. doi: 10.1038/nature02866. [DOI] [PubMed] [Google Scholar]
- Vanhaesebroeck B, Alessi DR. The PI3K-PDK1 connection: more than just a road to PKB. Biochem J . 2000;346:561–576. [PMC free article] [PubMed] [Google Scholar]
- Wang H, Gong B, Vadakkan KI, Toyoda H, Kaang BK, Zhuo M. Genetic evidence for adenylyl cyclase 1 as a target for preventing neuronal excitotoxicity mediated by N-methyl-D-aspartate receptors. J Biol Chem. 2007;282:1507–1517. doi: 10.1074/jbc.M607291200. [DOI] [PubMed] [Google Scholar]
- Wang X, Proud CG. mTORC1 signaling: what we still don't know. J Mol Cell Biol. 2011;3:206–220. doi: 10.1093/jmcb/mjq038. [DOI] [PubMed] [Google Scholar]
- Zepeda RC, Barrera I, Castelan F, Soto-Cid A, Hernandez-Kelly LC, Lopez-Bayghen E, Ortega A. Glutamate-dependent transcriptional regulation in bergmann glia cells: involvement of p38 MAP kinase. Neurochem Res. 2008;33:1277–1285. doi: 10.1007/s11064-007-9580-x. [DOI] [PubMed] [Google Scholar]


