

Abstract
We consider the problem of processing high angular resolution diffusion images described by orientation distribution functions (ODFs). Prior work showed that several processing operations, e.g., averaging, interpolation and filtering, can be reduced to averaging in the space of ODFs. However, this approach leads to anatomically erroneous results when the ODFs to be processed have very different orientations. To address this issue, we propose a group action induced distance for averaging ODFs, which leads to a novel processing framework on the spaces of orientation (the space of 3D rotations) and shape (the space of ODFs with the same orientation). Experiments demonstrate that our framework produces anatomically meaningful results.
Index Terms: biomedical image processing, information geometry, Riemannian manifolds, diffusion magnetic resonance imaging
1. INTRODUCTION
High angular resolution diffusion imaging (HARDI) is a diffusion MRI technique that can be used to infer the tissue microstructure in vivo [1]. This requires the reconstruction of the orientation distribution function (ODF), a non-parametric probability density function (PDF) describing the anisotropy of water diffusion at a spatial location. The ODF model offers improved accuracy in resolving intra-voxel complexities over the diffusion tensor (DT) model [2], currently the de facto standard for neuroimaging.
Developing mathematical methods for processing fields of ODFs is important in many aspects. For instance, by computing the mean of a set of ODFs, one can statistically compare ODF images of several subjects. Similarly, almost every geometric transformation applied to a grayscale image requires interpolation between intensity values and this is also true in the case of ODF images. Convolution and filtering are also needed to denoise ODF images that are estimated from noisy HARDI signals. These operations should be reformulated to properly handle the mathematical structure of the space of ODFs.
Doing calculus with DTs or ODFs requires defining a metric to compare two such elements. In the case of DTI, there exist several frameworks based on the well-studied geometry of the space of second-order tensors. Typical examples employ affine-invariant [3] and Log-Euclidean metrics [4]. In the case of HARDI, one should consider the statistical manifold whose elements are PDFs. Existing frameworks for HARDI processing [5, 6] exploit the fact that ODFs are probability density functions on the 2-sphere
 and that under a particular re-parametrization, the square-root representation of ODFs, various Riemannian operations are computable in closed-form.
In some cases, however, the methods of [5, 6] fail to provide anatomically meaningful results by producing ODF “bloating” and creating false fiber crossings. Fig. 1 shows two such cases: averaging (Fig. 1(a)) and interpolation (Fig. 1(b)). In the first case, we average ODFs with the same shape but different orientations. We expect a mean ODF with no difference in shape (red frame), but [5, 6] produce a “bloated” ODF (blue frame). In the second case, we interpolate two 1-fiber ODFs and expect to preserve their shapes (red frame), but [5, 6] produce 2-fiber (crossing) ODFs (blue frame).
Fig. 1.

Averaging and linear interpolation of ODFs using existing frameworks (blue frame) and the proposed framework (red frame).
To alleviate these issues, [7] suggests to separate the information from an ODF into orientation and shape components. In this work, we formalize this idea into a novel framework for HARDI processing. We propose a group action induced distance for ODFs, where the rotation group is the orientation space and the shape space is the space of ODFs with the same orientation. We compute the mean ODF by alternating between aligning the ODFs to the current estimate and updating its orientation and shape via Riemannian averaging in these two spaces. We evaluate our framework on synthetic and real data.
2. RIEMANNIAN MANIFOLD OF ODFs
On the manifold of ODFs, i.e., the space of PDFs p on
, the Fisher-Rao (FR) metric [8] determines a Riemannian metric that is invariant to re-parameterizations. By using a particular re-parameterization, the square-root representation, the manifold of ODFs is a unit sphere in a Hilbert space with the Fisher-Rao metric being the
 metric [9]. Then the space of square-root density functions
is
metric [9]. Then the space of square-root density functions
is
| (1) |
Ψ is the non-negative orthant of a unit Hilbert sphere and the geodesic distance between ψi, ψj ∈ Ψ is the angle between them, i.e.,
| (2) |
Let TψΨ denote the tangent space of Ψ at ψ. Under the square-root representation, several Riemannian operations such as the exponential map exp: TψΨ → Ψ and logarithm map log: Ψ → TψΨ can be computed in closed-form [5]. In practice the ODF p is represented in terms of its samples at M directions as the vector p ∈ ℝM. In our implementation, we use the vector
, the M-bin histogram of ψ, such that ψ ∈ Ψ ⊂
 . For the sake of clarity, we refer to the function ψ as “ODF” in the following discussions.
Riemannian Averaging of ODFs
The Riemannian weighted average of N ODFs with weights is the solution to . It is computed via Riemannian gradient descent, which involves consecutive evaluations of the aforementioned logarithm and exponential maps until a convergence criterion is met. The reader is referred to [5, 11] for further details.
3. GROUP ACTION INDUCED AVERAGING FOR PROCESSING ODFs
3.1. A Group Action Induced Distance between ODFs
To explicitly represent the orientation information of an ODF, we use the action of the rotation group SO(3) on Ψ. The rotation group SO(3) = {R ∈ ℝ3×3|R⊤ = R−1, det(R) = 1} is a matrix Lie group whose tangent space at the identity element I ∈ ℝ3×3 is the Lie algebra so(3), which is the space of 3 × 3 skew-symmetric matrices. The geodesic distance between two elements Ri, Rj ∈ SO(3) is
| (3) |
where ||·||F is the Frobenius norm and Log is the matrix logarithm (see [10, 11] for details on the Riemannian operations and optimization in SO(3)). The action of SO(3) on Ψ is a rotation around the origin, i.e., if R ∈ SO(3) and ψ ∈ Ψ, then the group action R ∘ ψ ∈ Ψ is defined as R ∘ ψ(s) = ψ(Rs), ∀s ∈
.
We define the rotation group action induced distance in Ψ as
| (4) |
The first term measures the dissimilarity in shape when the ODFs ψi and ψj are “aligned”, while the second term measures the amount of alignment needed, i.e., the dissimilarity in orientation. The parameter λ is a trade-off parameter between the shape and orientation terms and needs to be chosen such that λ > 0. Otherwise, the ODF alignment problem in (4) may not have a unique solution due to the possible symmetries of the ODFs. Finally, notice also that dψ is a rotation-invariant distance on Ψ, i.e., for all ψi, ψj ∈ Ψ and all R ∈ SO(3), we have dΨ(ψi, ψj) = dΨ(R ∘ ψi, R ∘ ψj), because dF R is rotation-invariant and .
3.2. Group Action Induced Averaging of ODFs
The average of N ODFs with respect to dΨ is defined as
| (5) |
where ψ = R ∘ φ is a decomposition of ψ into its orientation and shape components R and φ, respectively. We propose to compute via an iterative method that alternates between aligning the ODFs to the current estimate of , updating the orientation component given the current alignments and shape component, and updating the shape component given the current alignments and orientation component.
To derive the algorithm, let Qn = RnR⊤ and notice that
| (6) |
Therefore, we can rewrite (5) as
| (7) |
We solve this problem using an alternating minimization strategy.
In the alignment step, we solve for Qn assuming that we have estimates φ = φk and R = Rk at iteration k. From (7) we obtain
| (8) |
By setting Qn = RnRk⊤ and ψk = Rk ∘ φk, notice that this problem is equivalent to , which is of the form in (4). We compute numerically using the Nelder-Mead method [12] extended from ℝn to SO(3). The method is initialized with the icosahedral rotation group, a finite point subgroup of SO(3), and converges to a local minimum.
In the orientation step, we solve for R with φ = φk and . From (7) we obtain
| (9) |
Hence, (Rk+1)⊤ is the Riemannian average of the current alignments, which can be computed using Riemannian gradient descent.
In the shape step, we solve for φ with R = Rk+1 and . From (7) we obtain
| (10) |
Thus, φk+1 is the Riemannian average with respect to dF R of the rotated ODFs , which can be computed using the algorithm of [5], as described in §2. Finally, the new estimate of mean ODF , ψk+1, is obtained by composing the orientation and shape updates as ψk+1 = Rk+1 ∘ φk+1. The above alternating minimization algorithm converges to a local minimum of the cost function in (7). In our experiments we run a single iteration of this method starting at R0 = I and φ0 = ψn for any n = 1, …, N.
3.3. Group Action Induced Interpolation and Filtering of ODFs
Having presented how to perform averaging of ODFs, let us now consider the problems of interpolation and filtering. Assuming that we know N endpoints in a multi-dimensional lattice, inter-polation of ODFs at point x can be defined as the solution to
| (11) |
where ψ(xn) is the ODF at point xn and wn(x) is the corresponding interpolation weight. Notice that ψ(x) is the weighted average of and can be computed from the algorithm in §3.2.
Discrete convolution of an ODF image ψ with the filter g ≥ 0 of spatial support
 can be written as
| (12) |
Again, notice that the filtered ODF ϕ(x) is the weighted average of {ψ(x − u)}u∈
 and can be computed from the algorithm in §3.2.
4. VALIDATION AND DISCUSSIONS
4.1. Experiments on Synthetic Data
We generate the synthetic data using the multi-tensor model, where the HARDI signal at a gradient direction g is a convex combination of functions e−bg⊤Dkg, Dk being the k-th tensor and b = 3, 000 s/mm2. We simulate the signal at 81 gradient directions, add complex Gaussian noise, and reconstruct the ODFs as described in [13].
Averaging
We generate five sets of ODFs (Fig. 2) to illustrate the difference between the averages ϕ̄ and computed usin dF R and dΨ, respectively. The ODFs are generated by gradually rotating and/or changing the shape of the leftmost ODFs as well as adding noise to the signals they are reconstructed from. Thus, we expect to obtain mean ODFs “similar” to the fifth ODFs in the sets. In the first set, the ODFs do vary in shape but not in orientation, and hence both methods yield the same mean ODF. In the second set, the ODFs have the same shape but different orientations and averaging using dF R produces a bloating effect on the resulting ODF. Our framework, on the other hand, produces an ODF with the same shape as that of the ODFs it is computed from and its orientation is the average of their orientations. For the remaining sets, averaging with dΨ produces more meaningful results than averaging with dF R.
Fig. 2.
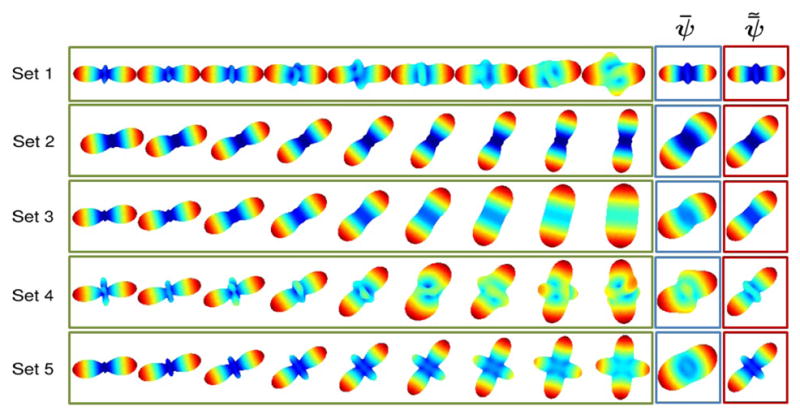
Averaging ODFs (green frames): the averages ϕ̄ (blue frames) and (red frames) are computed using dF R and dΨ, respectively.
Interpolation
We first perform linear interpolation between three pairs of ODFs (Fig. 3(a)). In the first and second cases, interpolation using dF R produces a 2-fiber ODF at the mid-point, whereas using dΨ interpolates the ODFs via rotation. In the third case, two 2-fiber ODFs that are different in orientation and in shape are interpolated. We observe that our framework prevents the bloating effect observed when interpolation is performed using dF R. More precisely, the entropy of the interpolated ODFs is higher than that of the ODFs being interpolated when interpolation is performed using dF R (Fig. 3(b)), whereas interpolation using dΨ results in an approximately linear relationship between the entropies. We also perform 2D interpolation between four ODFs, which have either different orientations but the same shape (Figs. 4(a)–4(b)), or different shapes including crossing configurations (Figs. 4(c)–4(d)). We observe that interpolation using dF R produces ODFs with large amounts of bloating, whereas our framework yields smooth and visually appealing interpolations.
Fig. 3.

(a) Interpolation between pairs of ODFs using dF R (blue frames) and using dΨ (red frames). (b) Study of bloating effects for interpolation using dF R and using dΨ.
Fig. 4.

2D interpolation among four ODFs (blue frames): (a,b) Input ODFs have the same shape but different orientations; (c,d) Input ODFs have different shapes and orientations.
Filtering
We convolve an ODF image (Fig. 5(a)) with sharp discontinuities (in orientation) with a 5 × 5 Gaussian filter of standard deviation 1. Figs. 5(b)–5(c) show the resulting images after filtering using dF R and dΨ, respectively. We observe that our framework yields a more realistic smoothed version of the input image.
Fig. 5.

(a) ODF image to be smoothed, (b) Image obtained after filtering using dF R, (c) Image obtained after filtering using dΨ.
4.2. Experiments on Real Data
We also evaluate our framework on a human brain HARDI dataset [14] where 105 images were acquired, 11 with no diffusion weighting and 94 with diffusion weighting at b = 1, 159 s/mm2, by using a 128×128 acquisition matrix (1.8 mm in-plane resolution) and 55 axial slices (2 mm thick). Prior to ODF reconstruction, the diffusion weighted images of each subject are nonlinearly registered to a group-averaged template. We perform averaging of the ODFs over 20 subjects in a ROI containing parts of the corpus callosum and cingulum. These tracts do not intersect, but there exist partial volume averaging due to low image resolution, as illustrated in Figs. 6(a)–6(b). Fig. 6(d) shows the mean ODF image computed using dΨ, where both tracts are accurately delineated without ODF bloating. Our framework prevents the generation of spurious ODFs with crossing configurations by considering the orientation as a separate entity. As a result, the number of voxels with partial volume averaging (see number of the blue frames in Fig. 6(d)) is reduced compared to that in the mean ODF image computed using dF R (see number of the blue frames in Fig. 6(c)). This demonstrates that by using the proposed framework, one can obtain anatomically more meaningful averages.
Fig. 6.

(a,b) ODF images of selected subjects; (c,d) The mean ODF images computed using dF R and using dΨ, respectively. The ODFs in the blue frames show partial volume averaging.
5. CONCLUSIONS AND FUTURE WORK
We presented a novel framework for performing averaging, interpolation, and filtering of ODFs. We showed how these operations reduce to weighted averaging and proposed the rotation induced distance dΨ, which led to an iterative method that updates the orientation and shape of the current estimate via Riemannian averaging in the orientation and shape spaces, respectively. We demonstrated that our framework produces anatomically more meaningful results, especially in highly anisotropic regions, by reducing partial volume averaging and eliminating unrealistic changes in ODFs. As a future work, we aim to improve the quality of white matter atlases by averaging ODFs across several subjects using dΨ, and the accuracy of tractography by increasing the coherence among ODF orientations via filtering.
Footnotes
H.E. Çetingül performed this work while at JHU. M.J. Wright and P.M. Thompson contributed to this work by providing the brain HARDI dataset.
References
- 1.Tuch DS. Q-ball imaging. Magnetic Resonance in Medicine. 2004;52(6):1358–1372. doi: 10.1002/mrm.20279. [DOI] [PubMed] [Google Scholar]
- 2.Basser PJ, Mattiello J, LeBihan D. Estimation of the effective self-diffusion tensor from the NMR spin echo. Journal of Magnetic Resonance B. 1994;103(3):247–254. doi: 10.1006/jmrb.1994.1037. [DOI] [PubMed] [Google Scholar]
- 3.Pennec X, Fillard P, Ayache N. A Riemannian framework for tensor computing. International Journal of Computer Vision. 2006;66(1):41–46. [Google Scholar]
- 4.Arsigny V, Fillard P, Pennec X, Ayache N. Log-Euclidean metrics for fast and simple calculus on diffusion tensors. Magnetic Resonance in Medicine. 2006;56(2):411–421. doi: 10.1002/mrm.20965. [DOI] [PubMed] [Google Scholar]
- 5.Goh A, Lenglet C, Thompson PM, Vidal R. A nonparametric Riemannian framework for processing high angular resolution diffusion images and its applications to ODF-based morphometry. NeuroImage. 2011;56(1):1181–1201. doi: 10.1016/j.neuroimage.2011.01.053. [DOI] [PMC free article] [PubMed] [Google Scholar]
- 6.Cheng J, Ghosh A, Jiang T, Deriche R. A Riemannian framework for orientation distribution function computing. Medical Image Computing and Computer-Assisted Intervention - MICCAI 2009. 2009;LNCS 5761:911–918. doi: 10.1007/978-3-642-04268-3_112. [DOI] [PubMed] [Google Scholar]
- 7.Ncube S, Srivastava A. A novel Riemannian metric for analyzing HARDI data. Proceedings of the SPIE. 2011;7962 [Google Scholar]
- 8.Rao CR. Information and accuracy attainable in the estimation of statistical parameters. Bulletin of the Calcutta Mathematical Society. 1945;37:81–89. [Google Scholar]
- 9.Srivastava A, Jermyn I, Joshi S. Riemannian analysis of probability density functions with applications in vision. IEEE Conference on Computer Vision and Pattern Recognition; 2007. pp. 1–8. [DOI] [PMC free article] [PubMed] [Google Scholar]
- 10.Moakher M. Means and averaging in the group of rotations. SIAM Journal on Matrix Analysis and Applications. 2002;24(1):1–16. [Google Scholar]
- 11.Afsari B, Tron R, Vidal R. On the convergence of gradient descent for finding the Riemannian center of mass. arXiv:1201.0925v1 [math.DG] [Google Scholar]
- 12.Nelder JA, Mead R. A simplex method for function minimization. The Computer Journal. 1965;7(4):308–313. [Google Scholar]
- 13.Goh A, Lenglet C, Thompson PM, Vidal R. Estimating orientation distribution functions with probability density constraints and spatial regularity. Medical Image Computing and Computer-Assisted Intervention. 2009;LNCS 5761:877–885. doi: 10.1007/978-3-642-04268-3_108. [DOI] [PubMed] [Google Scholar]
- 14.Chiang MC, Barysheva M, Lee AD, Madsen SK, Klunder AD, Toga AW, McMahon K, de Zubicaray GI, Meredith M, Wright MJ, Srivastava A, Balov N, Thompson PM. Brain fiber architecture, genetics, and intelligence: A high angular resolution diffusion imaging (HARDI) study. Medical Image Computing and Computer-Assisted Intervention - MICCAI 2008. 2008;LNCS 5241:1060–1067. doi: 10.1007/978-3-540-85988-8_126. [DOI] [PMC free article] [PubMed] [Google Scholar]