Abstract
Large multi-site image-analysis studies have successfully discovered genetic variants that affect brain structure in tens of thousands of subjects scanned worldwide. Candidate genes have also associated with brain integrity, measured using fractional anisotropy in diffusion tensor images (DTI). To evaluate the heritability and robustness of DTI measures as a target for genetic analysis, we compared 417 twins and siblings scanned on the same day on the same high field scanner (4-Tesla) with two protocols: (1) 94-directions; 2mm-thick slices, (2) 27-directions; 5mm-thickness. Using mean FA in white matter ROIs and FA ‘skeletons’ derived using FSL, we (1) examined differences in voxelwise means, variances, and correlations among the measures; and (2) assessed heritability with structural equation models, using the classical twin design. FA measures from the genu of the corpus callosum were highly heritable, regardless of protocol. Genome-wide analysis of the genu mean FA revealed differences across protocols in the top associations.
Index Terms: imaging genetics, DTI protocol stability, corpus callosum, genome-wide association study, multi-site analysis
1. INTRODUCTION
Large-scale meta-analyses of brain images, such as the ENIGMA project ([1], http://enigma.loni.ucla.edu) reveal common variants on the human genome that are associated with measurable brain differences. Each of these variants individually explains less than 5% of the variance in the brain measures, so the quest to identify them has been empowered by multivariate models of the image and genome [2], as well as meta-analysis.
Large imaging genetics consortia, such as ENIGMA, have recently combined structural imaging measures and genome-wide scans (GWAS) from 20,800 individuals assessed at over 21 sites worldwide, and have identified robust gene effects not detectable in any single cohort but replicated by meta-analysis. These meta-analyses have identified common genetic variants associated with hippocampal volume and total brain volume [1]. In a multi-site study, any differences across sites in scanning protocols (different scanner field strengths, image resolutions) and in image analysis protocols (such as segmentation methods) may reduce power to find and replicate genetic associations. Segmentation programs, for example, do not always work well across all datasets [3]. Realizing that scanner effects may matter, some studies have recently compared 1.5 and 3 Tesla scans of the same subjects for detecting neurodegenerative changes with morphometric analysis [4].
Recently, DTI measures have shown promising associations with common genetic variants, such as those in the Alzheimer’s disease risk gene, CLU [5] and the growth factor gene, BDNF [6]. However, the reproducibility and signal-to-noise ratio in DTI depends on the spatial and angular resolution (the number of directional diffusion-weighted gradients applied) [7]. Structural MRI images are typically acquired with ~1-mm3 spatial resolution, but 2–5 mm voxels are common for diffusion-weighted scans. Additionally, the number of diffusion-weighted gradients applied may vary drastically, from the minimum needed to reconstruct a tensor (6), to high angular resolution (HARDI) scans with hundreds of diffusion-weighted scans.
To determine a stable DTI phenotype for genetic analysis, here we analyzed DTI scans from 417 genotyped twins and siblings scanned with two diffusion imaging protocols, differing in spatial (2mm vs 5mm slices) and angular resolution (27 vs 94 directions). Common voxelwise and region-of-interest analyses were performed on FA maps and on the FA ‘skeletons’ from the widely-used method, TBSS (‘tract-based spatial statistics’ from FSL [8]). Various levels of Gaussian smoothing were also applied to the FA images prior to analysis. As genetic associations are likely to be discovered only for traits that are heritable, a formal twin-based heritability analysis was performed using an A/C/E-type structural equation model on the mean FA of various regions defined by the JHU-DTI atlas. A region of the corpus callosum, with high heritability regardless of to the protocol, was then carried forward for genome-wide association analyses (GWAS) where the most significantly associated single nucleotide polymorphisms (SNPs) from different protocols and analyses were compared.
2. METHODS
2.1. Image Acquisition and Genotyping
Structural and diffusion-weighted whole-brain MRI scans were acquired for each of 620 genotyped subjects (on a 4T Bruker Medspec scanner in Brisbane, Australia). T1-weighted images were acquired with an inversion recovery rapid gradient echo sequence (TI/TR/TE = 700/1500/3.35 ms; flip angle=8°; slice thickness = 0.9 mm, with a 2562 acquisition matrix). Diffusion-weighted images were acquired using single-shot echo planar imaging with a twice-refocused spin echo sequence to reduce eddy-current induced distortions.
The first imaging protocol consisted of a 3-minute, 30-image acquisition designed to optimize signal-to-noise ratio for diffusion tensor estimation [9]. Imaging parameters were: TR/TE=6090/91.7 ms, FOV=23 cm, with a 128×128 acquisition matrix. Each 3D volume consisted of 21 5-mm thick axial slices with a 0.5mm gap, and a 1.8×1.8 mm2 in-plane resolution. 30 images were acquired per subject: 3 with no diffusion sensitization (i.e., T2-weighted b0 images) and 27 diffusion-weighted (DW) images (b = 1132 s/mm2) with gradient directions uniformly distributed on the hemisphere. We will refer to this protocol as DTI-30.
The second imaging protocol was used for 490 of the same subjects. It consisted of a 14.2-minute, 105-image acquisition. Imaging parameters were: TR/TE=6090/91.7 ms, FOV=23 cm, with a 128×128 acquisition matrix. Each 3D volume consisted of 55 2-mm thick axial slices with no gap and 1.8×1.8 mm2 in-plane resolution. 105 images were acquired per subject: 11 with no diffusion sensitization (i.e., T2-weighted b0 images) and 94 diffusion-weighted (DW) images (b = 1149 s/mm2) with gradient directions uniformly distributed on the hemisphere. We refer to this protocol as DTI-105.
Genomic DNA was analyzed on the Human610-Quad BeadChip (Illumina) according to the manufacturers’ protocols (Infinium HD Assay; Super Protocol Guide; Rev. A, May 2008).
2.2. Image Processing and Co-registration
Extracerebral tissues were removed from structural and diffusion-weighted images with ROBEX [3]and FSL’s BET, respectively. All DW images were corrected for minor motion and eddy current distortions using FSL. Average b0 images were elastically registered [10] to T1-scans to adjust for EPI-induced distortions.
Using the high-resolution scans, a minimal deformation template (MDT) was created based on corrected FA maps from 32 (16M/16F) subjects. Template creation and subject coregistration of FA maps was performed as in [11]. Registered FA maps were also smoothed with different sized Gaussian filters (5- and 7-mm FWHM) to assess differences related to smoothing of the data.
Rigorous quality control (QC) excluded subjects with imaging artifacts in their raw scans including slice dropouts, excess movement, or a cropped FOV. All scans from both protocols were also assessed for the quality of their registration to the template image. This thorough QC filtering of scans left 417 subjects with usable scans for both DWI protocols.
TBSS [8] was performed using the registered images. We did not use the full TBSS pipeline including registration, to ensure that differences in registration methods did influence our analysis. TBSS was performed for all co-registered raw FA maps, as well as those smoothed at 5 and 7mm, for both the DTI-30 and DTI-105 scans. The suggested FA threshold of 0.2 was used.
12 sets of images were analyzed in total – 6 (3 variously smoothed DTI-30 and 3 DTI-105) images of the full WM in 3D (not just skeletons), and 6 corresponding TBSS skeletons.
2.3. Defining regions of interest
The FA image from the Johns Hopkins University DTI atlas [12] was registered to the MDT using the same registration pipeline used for co-registration. Deformations from this registration were applied to the atlas labels defining 50 regions of interest. 10 of these regions - including the lower part of the corticospinal tract and the cerebellar peduncles - fell mostly or partly outside the cerebral field of view and were excluded from analysis. Table 1 lists the regions assessed.
Table 1.
Regions of interest evaluated from the JHU DTI atlas
| 3/4/5 | G/B/SCC | Genu/body/splenium of corpus callosum |
| 6 | FX | Fornix (column and body of fornix) |
| 15/16 | CP | Cerebral peduncle L/R |
| 17/18 | ALIC | Anterior limb of internal capsule L/R |
| 19/20 | PLIC | Posterior limb of internal capsule L/R |
| 21/22 | RLIC | Retrolenticular part of internal capsule L/R |
| 23/24 | ACR | Anterior corona radiata L/R |
| 25/26 | SCR | Superior corona radiata L/R |
| 27/28 | PCR | Posterior corona radiata L/R |
| 29/30 | PTR | Posterior thalamic radiation L/R |
| 31/32 | SS | Sagittal stratum L/R |
| 33/34 | EC | External capsule left |
| 35/36 | CGC | Cingulum (cingulate gyrus) L/R |
| 37/38 | CGH | Cingulum (hippocampus) L/R |
| 39/40 | FX/ST | Fornix (crus) / stria terminalis L/R |
| 41/42 | SLF | Superior longitudinal fasciculus L/R |
| 43/44 | SFO | Superior fronto-occipital fasciculus L/R |
| 45/6 | IFO | Inferior fronto-occipital fasciculus L/R |
| 47/8 | UNC | Uncinate fasciculus L/R |
| 49/50 | TAP | Tapetum L/R |
2.4. Voxelwise/ROI comparison maps
Images were analyzed on a voxelwise level by performing t-tests, F-tests, and correlations to assess differences between the DTI-30s and DTI-105s. We assessed differences in the means and standard deviations of the DTI-derived measures, as well as correlations between them. For this analysis, we assessed a subset of 266 unrelated subjects to avoid the kinship issue (correlated samples).
2.4. A/C/E Heritability Analysis
A covariance matrix Sg was obtained for every white matter ROI for all twins (identical and fraternal). A structural equation model (SEM) was fitted to compare the observed and expected covariances (under different degrees of heritability) to infer the proportion of the variance attributable to additive genetic (A), shared environmental (C) and unique environmental (E) components of variance [13]: Z = Aa + Cc + Ee. Z can be any quantitative phenotypic trait, in this case the mean FA for the particular ROI. A, C, and E are latent (unobserved) variables and a, c, e are each parameter’s weights determined by optimizing S via full information maximum likelihood estimation (FIML). The variance components combine to create the total observed inter-individual variance, and sum to one: a2 + c2 + e2 = 1
This SEM uses FIML: with a χ2 null distribution to estimate genetic versus environmental contributions to the observed variance, where m is the number of twin pairs per group (48 for MZ and 74 for DZ), is the observed Sg covariance matrix for each twin group g, and Σg is the expected covariance matrix for group g, with α=1 for the MZ group and α =0.5 for DZ:
In SEM, the χ2 goodness of fit measure determines a p-value for all specified regions of interest (elements of the matrix) where the test was performed. This value indicates that the model fits the data well if p>0.05 (this is the opposite of the usual convention that rejects models or hypotheses).
OpenMX software [14] was implemented in R (http://www.r-project.org/) to calculate the A/C/E parameters. Subject sex was added to the model to control for the inclusion of mixed-sex dizygotic twin pairs.
2.3. Genome-wide associations across protocols
Genome-wide associations were performed for the mean FA in the genu of the corpus callosum - approximately the front third of the CC as defined by the JHU atlas. The mean FA was defined for regions-of-interest in the full FA map or the TBSS skeleton, by overlaying the co-registered, parcellated, JHU atlas on the individual data. To account for family structure, EmmaX [15] was used, with a kinship matrix specifying the relationships among family members, to fit a mixed effects model regression. As with the A/C/E model, MZ twins were coded with a kinship of 1 and dizygotic twins and siblings with 0.5. The kinship for unrelated individuals was set to 0. SNPs (single nucleotide polymorphisms) with a minor allele frequency (MAF) below 0.05 were excluded from the analysis, leaving a total of 500,628 SNPs. As no SNPs were found to be genome-wide significant (5×10⁻⁸) across the GWASs, we set a threshold for suggestive significance of 5×10 −5. GWAS results from protocols were compared in the following respects: 1) the number of SNPs found to be suggestively significant, 2) the number of those SNPs that were also significant between protocols (DTI-30 and DTI-105), 3) the number of those SNPs that are also suggestively significant in the other protocol, 4) the most significant (lowest) p-value for genetic association, and whether that same SNP was also significant in the corresponding matched protocol.
3. RESULTS
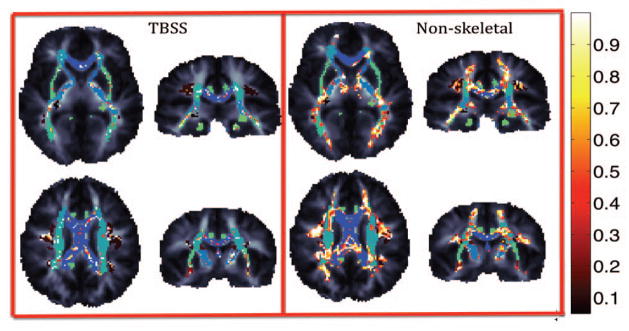
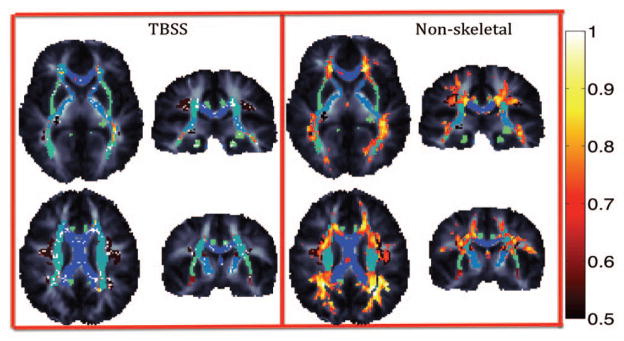
Voxelwise tests are shown in Figures 1–2 for unsmoothed images overlaid on the JHU atlas ROIs. Paired t-tests between the DTI-30 and DTI-105 protocols (not shown) revealed that only sparsely distributed voxels on the borders of tracts appear to have similar values. This is expected as FA value is much lower in images with larger voxels (due to partial volume effects). Figure 1 shows the results of F-tests between the DTI-30 and DTI-105 protocols. Even when mean values of FA differ (as seen through the t-tests), many WM regions do not significantly differ in variance structure ( p > 0.05 from an F-test) despite differences in imaging protocols. This is an important consideration for imaging genetics studies, as the variance structure is decomposed to estimate the contributions of genetic and environmental factors to the observed variance. Figure 2 shows Pearson’s correlations between measures derived from the two protocols. The genu and longitudinal fasciculi show high correlations while the splenium shows lower correlation.
Figure 1.
Voxelwise F-tests between DTI-30 and DTI-105 protocols (in 266 independent subjects) to test the difference in FA variation (across the sample) at every voxel. Regions are highlighted if they are not significantly different (p>0.05). Green/blue regions represent ROIs from the JHU atlas.
Figure 2.
Voxelwise Pearson’s correlations between DTI-30 and DTI-105 protocols (in 266 independent subjects). In some regions is very strong (hot colors run from 0.5 to 1).
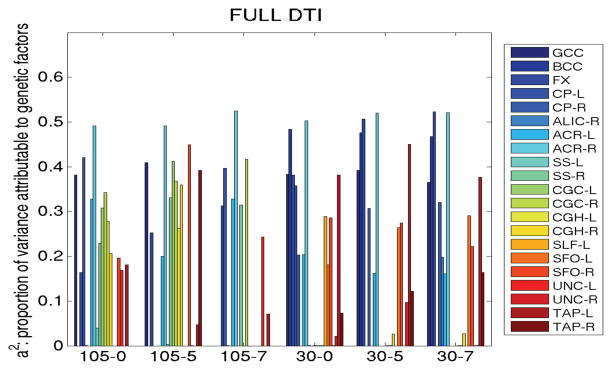
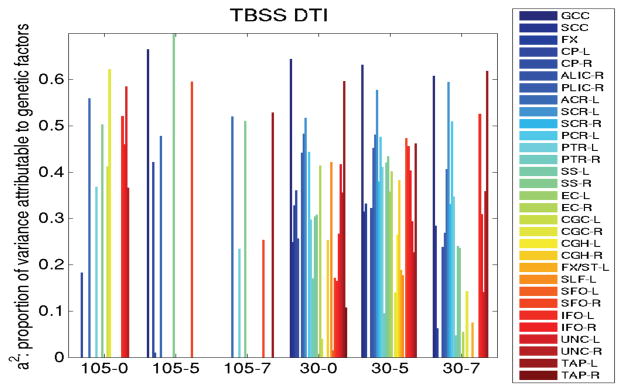
Results showing variance components from A/C/E analysis of the JHU ROIs are shown in Figure 3 for the full FA maps and Figure 4 for the TBSS analysis. Regions (including the splenium of the corpus callosum) were not shown if the A/C/E model did not fit the data well (in SEMs, this means that the p-value for the fit was less than 0.05). Genetic components (a2) derived from A/C/E structural equation modeling of 48 pairs of monozygotic twins and 74 pairs of dizygotic twins in ROIs defined on TBSS skeletonized FA maps, although higher, were not as indifferent to smoothing or protocol as when using the full ROIs. The smoothing level did not influence results as much as the scanning protocol. More regions’ mean FA values were more heritable when not skeletonized: the genu of the corpus callosum generally exhibited high heritability regardless of the protocol, level of smoothing, or the type of analysis (TBSS or otherwise). Therefore, we carried forward the mean genu FA as a target phenotype to run genome-wide associations.
Figure 3.
The heritability of DTI measures (i.e., the genetic component of variance, a2) derived from A/C/E structural equation modeling of 48 pairs of monozygotic twins and 74 pairs of dizygotic twins depends little on the smoothing level applied, but is highly dependent on imaging protocol. The x-axis shows the number of diffusion gradients followed by the level of smoothing applied (FWHM in mm)
Figure 4.
Heritability (i.e., genetic component of variance, a 2) for ROIs defined on TBSS skeletonized FA maps is generally higher, but not as indifferent to smoothing or protocol used as when using the full ROIs to compute the mean FA.
Table 2 shows results from the various GWAS analyses. When using full ROIs as opposed to the TBSS skeletal ROIs, a single SNP was suggestively significant in both the DTI-30 and the DTI-105 protocols in all smoothing schemes. Interestingly, the lower resolution scans yielded more suggestively significant SNPs for both TBSS GWAS and otherwise. Surprisingly, most SNPs that were suggestive in one protocol were not so in the other, with some not even nominally significant ( p<0.05) in the other protocol. Not skeletonizing the FA (i.e. averaging across the full ROI) resulted in roughly the same amount of suggestively associated SNPs. As evident by the 5mm smoothed results, some smoothing may be beneficial for finding more consistently associated SNPs.
Table 2.
Genome-wide associations for the different DTI protocols at different smoothing levels reveal varying numbers of suggestively associated SNPs. Little difference in protocol variation is seen between skeletonizing the FA maps and using the full ROI.
| # SNPs suggestively significant | # SNPs significant in matched protocol | # SNPs suggestive in matched protocol | Does the lowest p-value replicate? (yes/no) | ||
|---|---|---|---|---|---|
| TBSS-0mm | 105 | 27 | 12 | 1 | 4.9×10⁻⁶-N |
| 30 | 31 | 18 | 1 | 2.3×10⁻⁶-N | |
| fullROI-0mm | 105 | 28 | 16 | 1 | 5.4×10⁻⁶ -Y |
| 30 | 55 | 39 | 1 | 5.6×10⁻⁷ -N | |
| TBSS-5mm | 105 | 30 | 21 | 2 | 6.7×10⁻⁷-Y |
| 30 | 58 | 41 | 2 | 3.5×10⁻⁷-Y | |
| fullROI-5mm | 105 | 27 | 18 | 2 | 3.1×10⁻⁷-Y |
| 30 | 58 | 40 | 2 | 4.7×10⁻⁷-Y | |
| TBSS-7mm | 105 | 29 | 22 | 1 | 1.1×10⁻⁶-Y |
| 30 | 54 | 38 | 1 | 4.5×10⁻⁷-N | |
| fullROI-7mm | 105 | 26 | 18 | 1 | 1.1×10⁻⁶-Y |
| 30 | 62 | 36 | 1 | 5.2×10⁻⁷-N |
4. DISCUSSION
In this large DTI study of over 400 individuals, we compared two very different diffusion imaging protocols to determine a stable phenotype for genetic analysis. The genu of the corpus callosum showed high heritability, regardless of imaging protocol and the method used to define its mean FA. However, in GWAS analyses, the most significant SNPs from one protocol were not necessarily replicated in another, which suggests the critical need for meta-analysis and/or multivariate methods that simultaneously assess sets of locations on the genome and the image [2]. Amazingly, regardless of protocol, level of smoothing, skeletonization or not, one single SNP continuously showed suggestive significance.
One limitation of this study is that in order to ensure that different registration methods did not play a role in our comparisons, we did not use FSL registrations typically used for TBSS analysis; this will be assessed in future. Additionally, ROI analyses incur partial voluming effects, when the atlas is not perfectly aligned with the individual data. Fiber tractography and clustering may be useful to obtain improved ROIs in the future.
Acknowledgments
This work was supported by NIH grant R01 HD050735, NHMRC (Australia) grant 496682, R01 EB008281, and P41 RR013642.
References
- 1.ENIGMA Consortium. Genome-Wide Association Meta-Analysis of Hippocampal Volume: Results from the ENIGMA Consortium. Organization for Human Brain Mapping; Quebec City, Canada: 2011. [Google Scholar]
- 2.Hibar DP, et al. Multilocus genetic analysis of brain images. Frontiers in Genetics. 2011 Oct 21;2 doi: 10.3389/fgene.2011.00073. [DOI] [PMC free article] [PubMed] [Google Scholar]
- 3.Iglesias JE, et al. Robust brain extraction across datasets and comparison with publicly available methods. IEEE Trans Med Imaging. 2011 Sep;30:1617–34. doi: 10.1109/TMI.2011.2138152. [DOI] [PubMed] [Google Scholar]
- 4.Ho AJ, et al. Comparing 3 T and 1.5 T MRI for tracking Alzheimer's disease progression with tensor-based morphometry. Hum Brain Mapp. 2010 Apr;31:499–514. doi: 10.1002/hbm.20882. [DOI] [PMC free article] [PubMed] [Google Scholar]
- 5.Braskie MN, et al. Common Alzheimer's Disease Risk Variant within the CLU Gene Affects White Matter Microstructure in Young Adults. J Neurosci. 2011;31 doi: 10.1523/JNEUROSCI.5794-10.2011. [DOI] [PMC free article] [PubMed] [Google Scholar]
- 6.Chiang MC, et al. BDNF gene effects on brain circuitry replicated in 455 twins. Neuroimage. 2011;55:448–54. doi: 10.1016/j.neuroimage.2010.12.053. [DOI] [PMC free article] [PubMed] [Google Scholar]
- 7.Zhan L, et al. How does angular resolution affect diffusion imaging measures? NeuroImage. 2010;49:1357–71. doi: 10.1016/j.neuroimage.2009.09.057. [DOI] [PMC free article] [PubMed] [Google Scholar]
- 8.Smith SM, et al. Tract-based spatial statistics: voxelwise analysis of multi-subject diffusion data. Neuroimage. 2006 Jul 15;31:1487–505. doi: 10.1016/j.neuroimage.2006.02.024. [DOI] [PubMed] [Google Scholar]
- 9.Jones DK, et al. Optimal strategies for measuring diffusion in anisotropic systems by magnetic resonance imaging. Magn Reson Med. 1999 Sep;42:515–25. [PubMed] [Google Scholar]
- 10.Leow AD, et al. Statistical properties of Jacobian maps and the realization of unbiased large-deformation nonlinear image registration. IEEE Trans Med Imaging. 2007;26:822–32. doi: 10.1109/TMI.2007.892646. [DOI] [PubMed] [Google Scholar]
- 11.Jahanshad N, et al. Genetic influences on brain asymmetry: a DTI study of 374 twins and siblings. Neuroimage. 2010 Aug 15;52:455–69. doi: 10.1016/j.neuroimage.2010.04.236. [DOI] [PMC free article] [PubMed] [Google Scholar]
- 12.Mori S, et al. Stereotaxic white matter atlas based on diffusion tensor imaging in an ICBM template. Neuroimage. 2008 Apr 1;40:570–82. doi: 10.1016/j.neuroimage.2007.12.035. [DOI] [PMC free article] [PubMed] [Google Scholar]
- 13.Rijsdijk FV, Sham PC. Analytic approaches to twin data using structural equation models. Brief Bioinform. 2002 Jun;3:119–33. doi: 10.1093/bib/3.2.119. [DOI] [PubMed] [Google Scholar]
- 14.Boker S, et al. OpenMx: An Open Source Extended Structural Equation Modeling Framework. Psychometrika. 2011 Apr;76:306–317. doi: 10.1007/s11336-010-9200-6. [DOI] [PMC free article] [PubMed] [Google Scholar]
- 15.Kang HM, et al. Variance component model to account for sample structure in genome-wide association studies. Nat Genet. 2010 Apr;42:348–54. doi: 10.1038/ng.548. [DOI] [PMC free article] [PubMed] [Google Scholar]


