Abstract
Graph theory can be applied to matrices that represent the brain’s anatomical connections, to better understand global properties of anatomical networks, such as their clustering, efficiency and “small-world” topology. Network analysis is popular in adult studies of connectivity, but only one study – in just 30 subjects – has examined how network measures change as the brain develops over this period. Here we assessed the developmental trajectory of graph theory metrics of structural brain connectivity in a cross-sectional study of 467 subjects, aged 12 to 30. We computed network measures from 70×70 connectivity matrices of fiber density generated using whole-brain tractography in 4-Tesla 105-gradient high angular resolution diffusion images (HARDI). We assessed global efficiency and modularity, and both age and age2 effects were identified. HARDI-based connectivity maps are sensitive to the remodeling and refinement of structural brain connections as the human brain develops.
Index Terms: graph theory, high angular resolution diffusion imaging (HARDI), tractography, network analyses, development, structural connectivity
1. INTRODUCTION
The human brain changes profoundly as it develops. Classical anatomical studies show pruning of short-range connections throughout childhood, in favor of long range ones [1]. Diffusion imaging may also be combined with fiber tractography to reveal axonal pathways in vivo. In DTI studies, the fractional anisotropy of diffusion, which is sensitive to myelination, increases in childhood, plateaus in adulthood, and then declines in old age [2]. Defining the developmental trajectory for various aspects of brain structure is critical in determining how the brain normally develops. Normative statistics on brain connectivity are also useful to help identify anomalies of brain wiring that have been implicated in autism, schizophrenia, and other neurological and psychiatric disorders.
Graph theory, a branch of mathematics created to describe and analyze graphs, has recently been applied to characterize structural and functional networks computed from brain images [3]. Resting-state fMRI and MEG/EEG studies define connectivity in terms of correlations in time-series, for signals recorded from different parts of the brain. Recent high profile studies have estimated the “developmental ages” or relative maturity of subjects, based on resting-state data in children [4]. If diffusion images are collected, whole-brain tractography can be used to recover the density and integrity of tracts that interconnect pairs of brain regions. The topology and network properties of the resulting connectivity matrices can be summarized in terms of their characteristic path length (CPL), mean clustering coefficient (MCC), global efficiency (EGLOB), small-worldness (SW), and modularity (MOD) [5]. CPL measures a network’s average path length - the minimum number of edges needed to travel from one node to another. MCC measures how many neighbors of a given node are also connected to each other, relative to the total possible number of connections in the network. EGLOB is the inverse of CPL; networks with lower CPL are more efficient. SW represents the balance between network differentiation and integration, calculated as a ratio of local clustering and characteristic path length of a node relative to the same ratio in a randomized network. MOD is the degree to which a system may be subdivided into smaller networks [6].
Network metrics have been fruitfully applied to brain networks [7] but only one study has investigated their developmental trajectory [8] – in only 30 subjects. Here we scanned a much larger sample of 467 subjects – aged 12 to 30 – with 4-Tesla 105-gradient diffusion imaging. We set out to determine which measures of structural brain connectivity change the most from late childhood to adulthood. We computed graph theory metrics, from whole-brain HARDI tractography, in young and older adolescents (12 and 16 years old) and adults (aged 20–30).
2. METHODS
2.1. Subjects and Image Acquisition
Participants were recruited as part of a 5-year research project scanning healthy young adult Australian twins with structural brain MRI and DTI [9]. We analyzed scans from 467 right-handed subjects (adult sample: 232 females/133 males, mean age=23.6, SD=2.16; child sample: 53 females/49 males, mean age=14.4, SD=1.96). This population included 161 monozygotic (MZ) twins, 271 dizygotic (DZ) twins, and 35 non-twin siblings, from 284 families. 365 were adults, 55 were adolescents, and 47 were children.. Whole-brain anatomical MRI and high angular resolution diffusion images (HARDI) were collected with a 4T Bruker Medspec MRI scanner. T1-weighted anatomical images were acquired with an inversion recovery rapid gradient echo sequence, with TI/TR/TE = 700/1500/3.35ms; flip angle = 8 degrees; slice thickness = 0.9mm, and a 256×256×256 acquisition matrix. Diffusion-weighted images (DWI) were also acquired using single-shot echo planar imaging with a twice-refocused spin echo sequence to reduce eddy-current induced distortions. Imaging parameters were: 23cm FOV, TR/TE 6090/91.7ms, with a 128×128 acquisition matrix. Each 3D volume consisted of 55 2-mm thick axial slices with no gap and 1.79×1.79 mm2 in-plane resolution. 105 images were acquired per subject: 11 with no diffusion sensitization (i.e., T2-weighted b0 images) and 94 diffusion-weighted (DW) images (b = 1159 s/mm2) with gradient directions evenly distributed on the hemisphere. The HARDI scan took 14.2 min to collect.
2.2. Cortical Extraction and HARDI Tractography
Connectivity analysis was performed as in [10]. Briefly, non-brain regions were automatically removed from each T1-weighted MRI scan, and from a T2-weighted image from the DWI set, using the FSL tool “BET” (FMRIB Software Library, http://fsl.fmrib.ox.ac.uk/fsl/). A neuroanatomical expert manually edited the T1-weighted scans to refine the brain extraction. All T1-weighted images were linearly aligned using FSL (with 9 DOF) to a common space with 1mm isotropic voxels and a 220×220×220 voxel matrix. For each subject, the 11 eddy-corrected images (using FSL tool “eddy_correct” http://fsl.fmrib.ox.ac.uk/fsl/) with no diffusion sensitization were averaged, linearly aligned and resampled to a downsampled version of their corresponding T1 image (110×110×110, 2×2×2mm). Averaged b0 maps were elastically registered to the structural scan using a mutual information cost function to compensate for EPI-induced susceptibility artifacts. 35 cortical labels per hemisphere, as listed in the Desikan-Killiany atlas [11], were automatically extracted from all aligned T1-weighted structural MRI scans using FreeSurfer (http://surfer.nmr.mgh.harvard.edu/). T1-weighted images and cortical models were aligned to the original T1 input image space and down-sampled to the space of the DWIs, using nearest neighbor interpolation (to avoid intermixing of labels). To ensure tracts would intersect cortical labeled boundaries, labels were dilated with an isotropic box kernel of size 5×5×5 voxels.
The matrix transforming the mean b0 image to the T1-weighted volume was applied to each of the 94 gradient directions to properly re-orient the orientation distribution functions (ODFs). At each HARDI voxel, ODFs were computed using the normalized and dimensionless ODF estimator, derived for q-ball imaging (QBI). We performed HARDI tractography on the linearly aligned sets of DWI volumes using these ODFs, using the Hough transform method [12]. Elastic deformations obtained from the EPI distortion correction, mapping the average b0 image to the T1-weighted image, were then applied to the tracts’ 3D coordinates to accurately align the anatomy. Each subject’s dataset contained 2000–10000 useable fibers (3D curves). For each subject, a full 70×70 connectivity matrix was created. Each element described the proportion of the total number of fibers connecting each of the labels; diagonal elements describe the total number of fibers passing through a certain cortical region of interest. Values were calculated as a proportion - normalized to the total number of fibers traced for each individual participant, so that results were not skewed by raw fiber count.
2.3. Graph Theory Analyses
On the 70×70 matrices generated above, we used the Brain Connectivity Toolbox (5; https://sites.google.com/a/brain-connectivity-toolbox.net/bct/Home) to compute CPL, MCC, EGLOB, SW, and MOD. All measures were calculated for the network as a whole, based on equations in [5].
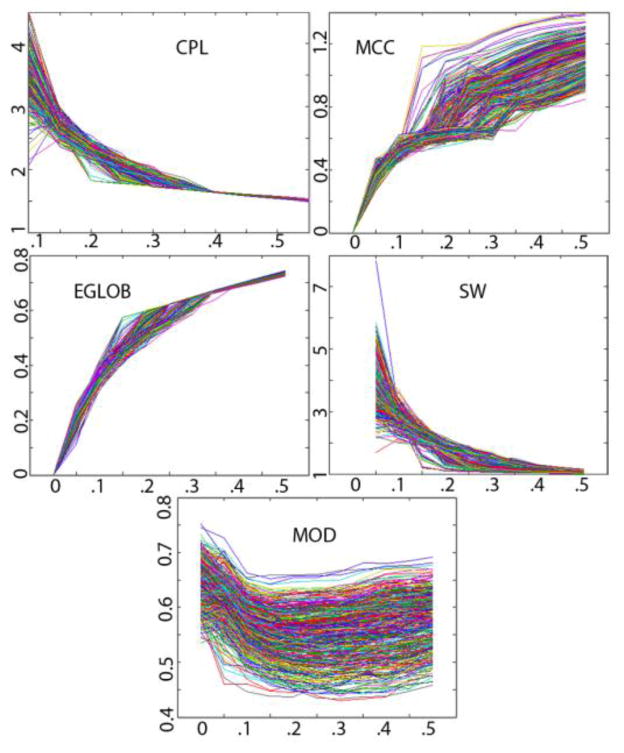
In graph theory analyses, it is necessary to select a sparsity for the network, based on thresholding. Networks with a sparsity of 0.2 retain only 20% of the connections of the network computed from all available data. Completing analyses at a single sparsity level may be considered arbitrary, so we calculated network properties at multiple sparsities, and integrated the results across a specific range to generate more stable scores. We calculated the network measures for the whole brain over a range of sparsities (0.2–0.3, in 0.01 increments), and calculated the area under the plot spanned by those 11 data points to generate an integrated score for each measure. To determine at which sparsity these measures were most stable, we calculated them over the range 0–0.5, in 0.05 increments to assess these plots (see Figure 1). A sparsity higher than 0.3 is considered implausible for biological structural networks [13], and our plots show that the range 0–0.2 is unstable. We therefore selected the sparsity range 0.2–0.3 for our analyses.
Figure 1.
Values for 467 participants on 5 global connectivity measures across a sparsity range of 0–0.5 in 0.05 increments. The choice of sparsity, when defining the network, affects the measures. At zero sparsity, CPL is infinite, and is omitted from the graph.
2.4. Age Regression
Age effects on graph theory metrics of structural brain connectivity were estimated using the general linear mixed effects model, as well as two simpler linear mixed effects models, as follows:
| (Eq. 1) |
| (Eq. 2) |
Here, “graph theory metrics” could be any of those listed above. A is a constant for each regression model, the βs are the covariate regression coefficients, and α is a coefficient that accounts for random effects. Random effects were used to account for family relatedness. We modeled the other variables (age, sex, TBV, age2) as fixed effects. TBV denotes total brain volume. Zeros refers to the number of entries in the 70×70 matrix with a ‘0’ value, meaning no connection. This was included so that our analyses reflected differences in the connections present.
3. RESULTS
Beta coefficients and associated p-values for the age, age2, sex, and age*sex elements from Eq. 1 are shown in Table 1. For the sake of space we focus on the EGLOB and MOD results. Results are corrected for multiple comparisons using the false discovery rate (FDR) method [14].
Table 1.
Effects of Age and Age2 (when both are included in the model) on global brain connectivity measures (where significant, Beta and p-values are shown).
| Whole Brain Connectivity Measures | ||||
|---|---|---|---|---|
| Age | Age2 | Sex | Age*Sex | |
| EGLOB | ns | ns | Ns | ns |
| MOD | ns | 0.0017 (0.017) | 0.35 (0.0094) | −0.017 (0.0054) |
Table 2 shows beta coefficients and p-values for each element in the model from Eq. 2, with just age in separate models. Results are corrected for multiple comparisons using FDR.
Table 2.
Regression results for a model that includes Age, Sex, and their interaction, but not Age2 on global measures of connectivity. Beta values estimate the change in connectivity per unit of the covariate (e.g., per year, for Age); P-values are in parentheses.
| Whole Brain Connectivity Measures | |||
|---|---|---|---|
| Age | Sex | Age*Sex | |
| EGLOB | 0.013 (6.5×10⁻⁵) | ns | Ns |
| MOD | 0.032 (0.0013) | 0.31 (0.020) | −0.015 (0.0098) |
When both age and age2 are included, we detect a non-linear increase in MOD with age. We also see significant sex and age*sex effects for MOD. When only age is included, we see significant increases in both EGLOB and MOD with age, and the sex and age*sex effects are still present.
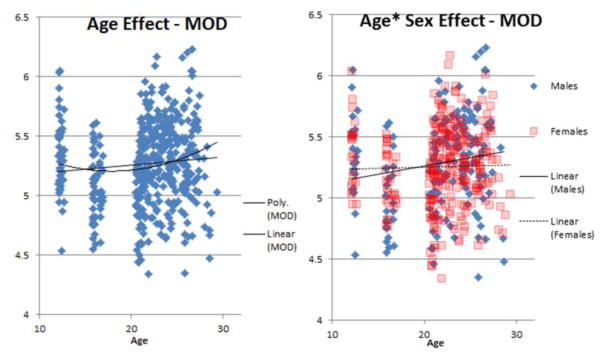
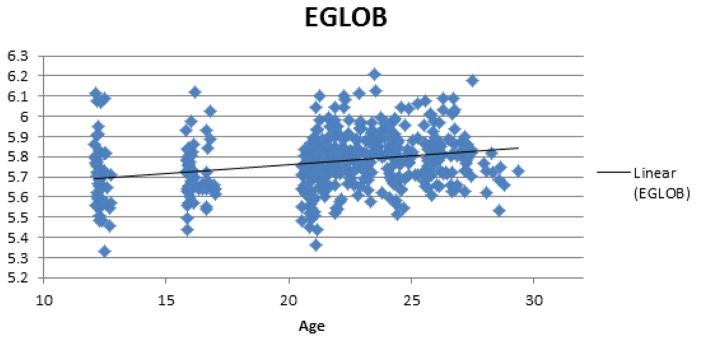
Figures 2 and 3 show scatterplots of the positive relationship between age and MOD and EGLOB, respectively. MOD showed both linear and non-linear age trends, but for EGLOB, only linear age trends were detected.
Figure 2.
Plot showing positive relationship between age and MOD, and the age*sex interaction.
Figure 3.
Plot showing positive relationship between age and EGLOB.
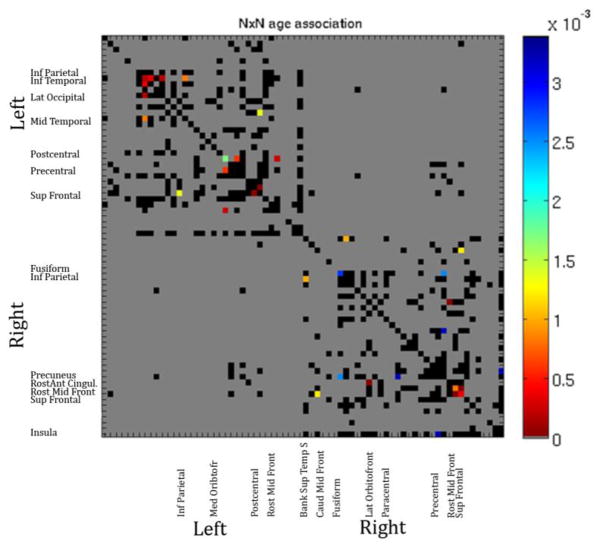
We also tested for age effects on each element in the original 70×70 fiber density matrices used to compute the graph theory metrics. We only tested connections present in >95% of our subjects. The p map generated from this analysis of age effects is shown in Figure 4. Gray boxes are those not tested (not present in >95% of subjects), black boxes are those tested but not significant.
Figure 4.
P map for fitted linear age effects on elements of the 70×70 fiber density matrix. Colors correspond to the p value as indicated. The overall map passes FDR.
4. DISCUSSION
We found positive relationships between age and two standard graph theory measures of brain structural connectivity. EGLOB increased linearly across development, which agrees with the one prior study on this topic in a small sample across a similar age range [8]. MOD showed both linear and non-linear increases across development, with a significant age by sex interaction – males showed a strong upward trend in MOD with age while the trendline for females was essentially flat.
Adults had more highly connected structural networks (data not shown), but their networks still had higher global efficiency and higher modularity. Increasing modularity with age indicates that sub-networks are becoming more clearly defined. These results suggest that networks are simultaneously becoming more integrated and more segregated. This balance is what distinguishes small-world networks from other network topologies.
The significant age by sex interaction seen in modularity indicates that males and females had different developmental trajectories. This is indeed what we see in Figure 2 – in fact, males may be driving the age effect.
The 70×70 fiber density analysis was restricted to only fibers found in >95% of subjects, so it may not reflect connections that were added or lost over the course of development, just those that were consistently present and changed. Changes with age were largely decreases in fiber density, perhaps reflecting the well-established process of pruning connections over development. Some connections are favored through experience, and are potentiated, while others are pruned, if they are not reinforced [1].
One limitation of the current study is the uneven sampling of different age groups; cohorts were available for assessment at 12 and 16 but not in between. Nonparametric regression models may be advantageous to derive empirical p-values for the fitted regression coefficients, but are unlikely to materially affect the conclusions as age effects are strong.
5. CONCLUSION
The period from adolescence to adulthood is marked by increases in the integration (or global efficiency) of structural networks, and increases in segregation, as seen in increased modularity. Regardless of age, the recovered brain networks showed a small-world topology. This study also offers a first step in developing statistical criteria for aberrant anatomical brain connectivity, and deviant trajectories of maturation, from childhood to adulthood.
Acknowledgments
Supported by the NIH (R01 HD050735, T32 MH073526-06), and the National Health and Medical Research Council (NHMRC 486682, 1009064), Australia. Genotyping was supported by NHMRC (389875). Algorithm development was supported by NIH R01 grants EB008432, EB008281, EB007813 and P41 RR013642.
References
- 1.Huttenlocher Morphometric study of human cerebral cortex development. Neuropsychologia. 1990;28:517–527. doi: 10.1016/0028-3932(90)90031-i. [DOI] [PubMed] [Google Scholar]
- 2.Kochunov, et al. Fractional anisotropy of water diffusion in cerebral white matter across the lifespan. Neurobiology of Aging. 2010;30:1149–1155. doi: 10.1016/j.neurobiolaging.2010.01.014. [DOI] [PMC free article] [PubMed] [Google Scholar]
- 3.Sporns, et al. Organization, development and function of complex brain networks. Trends in Cogn Sci. 2004;8:418–425. doi: 10.1016/j.tics.2004.07.008. [DOI] [PubMed] [Google Scholar]
- 4.Dosenbach, et al. Prediction of individual brain maturity using fMRI. Science. 329:1358–1361. doi: 10.1126/science.1194144. [DOI] [PMC free article] [PubMed] [Google Scholar]
- 5.Rubinov, Sporns Complex brain networks: graph theoretical analysis of structural and functional systems. Nature Reviews Neuroscience. 2009;10:186–198. doi: 10.1038/nrn2575. [DOI] [PubMed] [Google Scholar]
- 6.Bullmore, Bassett Brain graphs: Graphical models of the human brain connectome. Reviews in Advance. 2010:1–37. doi: 10.1146/annurev-clinpsy-040510-143934. [DOI] [PubMed] [Google Scholar]
- 7.Bassett, Bullmore Small-world brain networks. The Neuroscientist. 2006;12(6):512–523. doi: 10.1177/1073858406293182. [DOI] [PubMed] [Google Scholar]
- 8.Hagmann, et al. White matter maturation reshapes structural connectivity in the late developing human brain. PNAS. 2010;107:19067–72. doi: 10.1073/pnas.1009073107. [DOI] [PMC free article] [PubMed] [Google Scholar]
- 9.de Zubicaray, et al. Meeting the challenges of neuroimaging genetics. Brain Imaging and Behavior. 2008;2:258–263. doi: 10.1007/s11682-008-9029-0. [DOI] [PMC free article] [PubMed] [Google Scholar]
- 10.Jahanshad, et al. ISBI. 2011. High angular resolution diffusion imaging (HARDI) tractography in 234 young adults reveals greater frontal lobe connectivity in women; pp. 1–5. [Google Scholar]
- 11.Desikan, et al. An automated labeling system for subdividing the human cerebral cortex on MRI scans into gyral based regions of interest. NeuroImage. 2006;31:968–980. doi: 10.1016/j.neuroimage.2006.01.021. [DOI] [PubMed] [Google Scholar]
- 12.Aganj, et al. A Hough transform global probabilistic approach to multiple-subject diffusion MRI tractography. Med Image Analysis. 2011;15:414–425. doi: 10.1016/j.media.2011.01.003. [DOI] [PMC free article] [PubMed] [Google Scholar]
- 13.Sporns. Networks of the Brain. The MIT Press; Cambridge, MA: 2011. [Google Scholar]
- 14.Benjamini, Hochberg Controlling the false discovery rate: a practical and powerful approach to multiple testing. J R Stat Soc B. 1995;57:289–300. [Google Scholar]


