Abstract
Human brain connectivity is disrupted in a wide range of disorders – from Alzheimer’s disease to autism – but little is known about which specific genes affect it. Here we conducted a genome-wide association for connectivity matrices that capture information on the density of fiber connections between 70 brain regions. We scanned a large twin cohort (N=366) with 4-Tesla high angular resolution diffusion imaging (105-gradient HARDI). Using whole brain HARDI tractography, we extracted a relatively sparse 70×70 matrix representing fiber density between all pairs of cortical regions automatically labeled in co-registered anatomical scans. Additive genetic factors accounted for 1–58% of the variance in connectivity between 90 (of 122) tested nodes. We discovered genome-wide significant associations between variants and connectivity. GWAS permutations at various levels of heritability, and split-sample replication, validated our genetic findings. The resulting genes may offer new leads for mechanisms influencing aberrant connectivity and neurodegeneration.
Index Terms: genetics, high angular resolution diffusion imaging (HARDI), cortical surfaces, twin modeling, human connectome
1. INTRODUCTION
The human brain is a complex network of structural and functional interconnections, with diverse regions activated during functional tasks. Advanced diffusion imaging methods, which track the diffuson of water along the brain’s axons, can reveal dense microstructural fiber bundles connecting anatomically distinct cortical and subcortical regions. Such connections are remodeled throughout development [1] and deteriorate in diseases such as Alzheimer’s disease [2]. While initial investigations have examined the degree of genetic involvement in functional connectivity, genetic contributions to the brain’s structural connectivity, i.e. the proportions and densities of axonal fibers connecting cortical subregions, have yet to be explored.
The degree of genetic influence on a particular trait can be determined by studying twins. Twin studies have long been used to determine the heritability (proportion of variance explainable by genetic variation) of human traits. Some studies have begun to estimate the heritability of DTI-derived measures of fiber integrity and its asymmetry as well as other neuroimaging measures [3–6]. Proportions of variance due to genes versus environment can be inferred by fitting structural equation models (SEMs) to data from different types of twins--monozygotic (MZ) twins share all their genes while dizygotic (DZ) twins share, on average, half.
In a large family cohort comprised of 366 individuals from 223 families, we used high angular resolution diffusion imaging (HARDI) at high magnetic field (4 Tesla) along with anatomical MRI to delineate cortical regions into areas of known structure and functionality [7]. We also mapped out white matter fiber pathways using high angular-resolution HARDI tractography. In this work, we define connectivity as the proportion of total fibers traced in the brain that intersect a specific pair of cortical regions – this may include connections within or between hemispheres. The connectivities of all pairs of regions are compiled into symmetric matrices, in which each matrix element (x,y) is the proportion of fibers connecting brain regions x and y.
To determine the genetic influences contributing to the density of each cortical connection, we fitted a SEM to connectivity matrices extracted from 46 pairs of MZ and 64 pairs of DZ twins. If a connection was significantly influenced by genetic factors, we followed through with a genome-wide association test to identify specific genetic variants associated with the proportion of fiber densities at that connection. The sample was split in half to allow replication of discovered associations in non-overlapping samples.
2. METHODS
2.1. Subjects and Image Acquisition
Subjects included 92 young adult monozygotic (MZ) twins (46 pairs) and 128 dizygotic (DZ) twins (64 pairs) along with 146 non-twin siblings and unpaired twins with caucasian ancestry. In total, images from 366 right-handed young adults (mean age: 23.5 years, SD 2.0) were included, from a 5-year research project examining healthy young adult twins with MRI and DTI [8]. Genomic DNA was analyzed on the Human610-Quad BeadChip (Illumina) according to the manufacturers protocols (Infinium HD Assay; Super Protocol Guide; Rev. A, May 2008).
Anatomical and 105-gradient (11 b0, 94 direction) high angular resolution diffusion imaging (HARDI) whole-brain MRI scans were acquired on a high magnetic field (4T) Bruker Medspec MRI scanner. T1-weighted images were acquired with an inversion recovery rapid gradient echo sequence. For imaging parameters, please see [4].
2.2. A/C/E Heritability Analysis of Connectivity
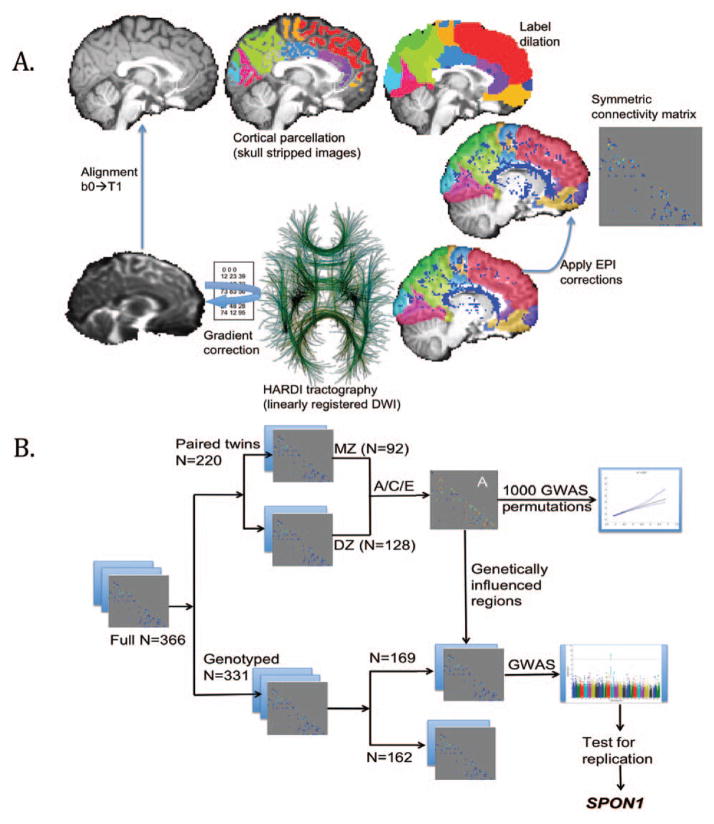
NxN structural connectivity matrices were created as in [9] with a pipeline shown in Fig 1A. A covariance matrix Sg was obtained for every matrix element in the connection matrix within the pairs for each of the two types of twins (identical or fraternal). A structural equation model (SEM) was then fitted to compare the observed and expected covariances (under different degrees of heritability) to estimate the proportion of the variance attributable to additive genetic (A), shared environmental (C) and unique environmental (E) components of variance [10]: Z = Aa + Cc + Ee. Z can be any quantitative phenotypic trait, in this case the fiber count proportion at a particular matrix element. A, C, and E are latent (unobserved) variables and a, c, e are each parameter’s weights determined by optimizing S via full information maximum likelihood estimation (FIML). The variance components combine to create the total observed inter-individual variance, and sum to 1:a2 + c2 + e2 = 1. This SEM uses FIML: with a χ2 null distribution to estimate genetic versus environmental contributions to the observed variance, where m is the number of twin pairs per group (49 for MZ and 65 for DZ), Sg is the observed covariance matrix for each twin group g, and Σg is the expected covariance matrix for group g, with α=1 for the MZ group and α=0.5 for DZ, as MZ twins share all their genes while dizygotic (DZ) twins share, on average, half:
Figure 1.
a) NxN connectivity matrix design workflow; b) workflow for genetic association analysis in independent non-overlapping samples (for split-sample replication of genetic hits).
In SEM, the χ2 goodness of fit measure determines a p-value for all specified regions of interest (elements of the matrix) where the test was performed. This value indicates that the model is a good fit to the data if p>0.05 (this is the opposite of the usual convention that rejects models or hypotheses). To determine the significance of the the A or C factors, the χ2 goodness-of-fit values of the model are compared to those for a model excluding that factor (i.e., to a C/E model to determine the significance of the additional A factor; A/E model to determine the significance of C), giving: , where χ2 IDF−1 denotes the inverse of the cumulative distribution function for a chi-squared distributed variable with one degree of freedom. p(C) is computed analogously. In this case, low p-values express significant improvements when adding a factor. This is consistent with the more standard convention for p-values, and allows us to assess the resulting uncorrected p-value maps using the false discovery rate (FDR) method [11].
OpenMX software [12] was implemented in R (http://www.r-project.org/) for calculating the A/C/E parameters. The covariates sex, age, and total brain volume (TBV) were added to the model, and 95% CIs for the A term were computed.
2.3. Genome-wide associations across the matrix
Genome-wide associations were performed at each of the 90 valid (out of 122) matrix elements (after filtering out connections which are not heritable (a2 < 0.01) or not present in at least 95% of the subjects) using emmaX - a mixed model approach - controlling for age, sex, and TBV [13]. Connections with a heritability estimate of < 1% were excluded to limit the search region to connections where we can estimate some degree of genetic interation. EmmaX accounts for the familial relatedness between subjects through the use of a kinship matrix describing the genetic similarities between all pairs of subjects. Analysis was limited to those single nucleotide polymorphisms (SNPs) with a minor allele frequency (MAF) greater than 0.1. 428,287 SNPs were tested.
2.4. Establishing significance thresholds
A significance threshold of 7×10⁻⁹ was established for genome-wide significance for reasons described below. We determined significance levels for association tests by first estimating the total number of independent tests performed. Linkage disequilibrium (LD) leads to correlation among the 428,287 SNPs and when two genotyped SNPs are in high LD, each test is not completely independent. By first estimating the effective number of independent tests we can avoid using an unduly conservative significance criterion. Due to linkage disequilibrium, the effective number (Meff) of SNPs tested [14] was 214,578. The same logic can also be applied to the matrix elements tested. Clearly an off-diagonal element is not independent of the entries in the same row and column. For a matrix element, C(x,y), representing the total proportions of fibers connecting cortical regions x and y, this value is not fully independent of matrix elements (x,x) and (y,y) corresponding to the total proportions of tracts crossing each cortical region x and y, respectively. While a total of 90 connections were evaluated, 33 of those connections lie on the diagonal corresponding to different regions on the cortex and might be expected to be independent components (although not necessarily), while off diagonal elements are clearly dependent on two regions. Similarly, a principal components analysis of the 90 matrix elements using information from the twins in the A/C/E model reveals that 29 components are sufficient to explain 95% of the variance in the sample. A Bonferroni correction on the number of independent samples would be 0.05/(33*214,578)= 7.06×10⁻⁹ or 0.05/(29*214,578)= 8.04×10⁻⁹, respectively. We chose the more conservative 7×10⁻⁹ as our threshold for genome-wide significance, which we show is acceptable through extensive permutations to find the null distribution of association statistics. Other GWA-studies of multiple traits have used the false discovery rate (FDR) procedure to find the appropriate correction threshold for one analysis across the genome [15]. For comparison, we performed a similar analysis using FDR on the p-values obtained from the 90 traits to obtain a correction threshold of 7.58×10⁻⁹ for the full cohort GWAS.
2.5. Modeling null distributions for GWAS
At each of the 90 accepted nodes in the connectivity matrix, a GWAS was performed for the 220 twins used in the A/C/E structural equation model. To determine any potential differences in the null distributions with respect to the degree of the additive genetic component, GWAS was performed 1000 times on permuted matrices. When conducting these permutations, each subject’s covariates (age, sex, and TBV) remained true to its source, while the matrix elements were permuted in a manner that ensured preservation of family structure. Values for MZ twin pairs were only permuted with each other, while the DZ twin pairs were permuted separately. Within each permutation, within-twin pair rearrangements were also allowed to maximize permutations.
2.6. Split-sample GWAS
While all families are participants in the same study, each family is genetically unique, so we were able to split our large sample into two unique subgroups in order to provide a genetically independent sample for replicating the effect of any suggestive genetic variants on brain structural connectivity. A schematic workflow, of the processing and statistical pipeline, is presented in Fig 1B. The groups were split according to unique subject identification numbers. All members of the same family were assigned to the same group. No significant differences were seen between groups with respect to sex (p = 0.91) or TBV (p = 0.06). As the study was deliberately designed to sample young adults in the narrow age-range 21–30, although mean differences were minimal, there was a significant difference in age as calculated through a two-sided t-test of the populations (p = 1.2×10⁻¹⁸; mean Group 1 = 24.4; mean Group 2 = 22.6).
3. RESULTS
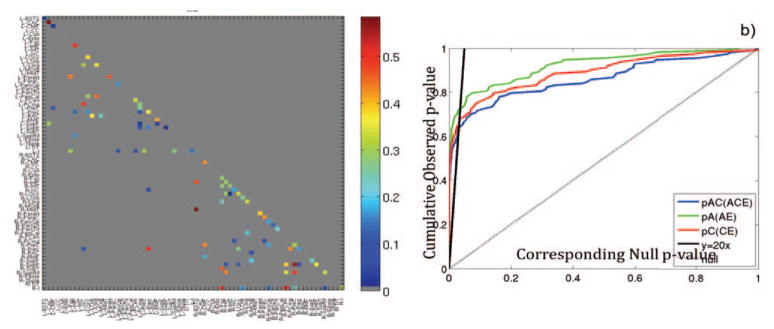
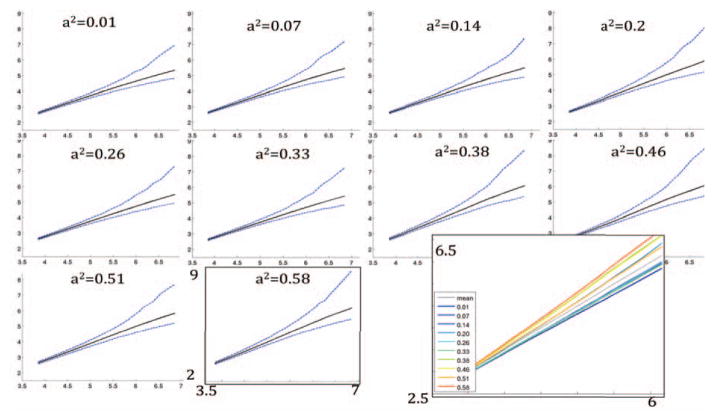
Fig. 2 shows regions for which the A/C/E model was found to fit the data well and a2 >1% as well as CDF plots of describing the significance of ACE, and sub-models with respect to the E model. Fig 3 shows the null distribution of GWA statistics at 10 connections with increasing levels of heritability. We note in general that when preserving the family structure, as is done in this case, the choice of more highly heritable connections tended to produce permutations with on average lower p-values. Across all 1000 permutations of the 10 connections, 251 SNPs had a p-value falling below the 7×10⁻⁹ genome-wide significance threshold, which suggests that the expected number of false positives over all 90 regions in the group is on average is 90×0.0251 = 2.26 (where we found 4).
Figure 2.
Genetic analysis of a sample of 46 monozygotic twin pairs and 64 dizygotic twin pairs, through the A/C/E structural equation model, breaks down the observed variance in structural neural connectivity into variance components describing the contribution of additive genetic effects (A), shared environmental effects (C), and unique individual variance or measurement error (E). For nodes where the A/C/E model fits the data well, the value of a2 is shown for each node in a). Regions are only displayed if a2 was higher than 1%. We show through cumulative distribution function (CDF) plots, b), that the A/C/E model significantly improves upon the E model (the model derived if we assume the entire brain network is attributable to unique environmental attributes); the A/E and C/E models each fit better than the E model.
Figure 3.
At connections with increasing levels of heritability, from 1% to 58% (a–j), 1000 GWASs were conducted on permutations of the twin NxN matrices used for the A/C/E heritability analysis. The −log10 of the lowest 1000 p-values of each permutation are plotted against the −log10 expected ordered p-values for the same number of tests. The solid black line represents the mean of the ordered p-values, while the dashed blue lines represent the 0.025 and 0.975 point-wise quantiles of the ordered p-values. The mean of the ordered p-values of all the 10 plots (solid black line in each), are plotted together in k) against the −log10 expected ordered p-values. −log10 p-values tend to be higher as heritability of the trait is increased, suggesting the benefits of pre-screening connections for heritability, before running GWAS.
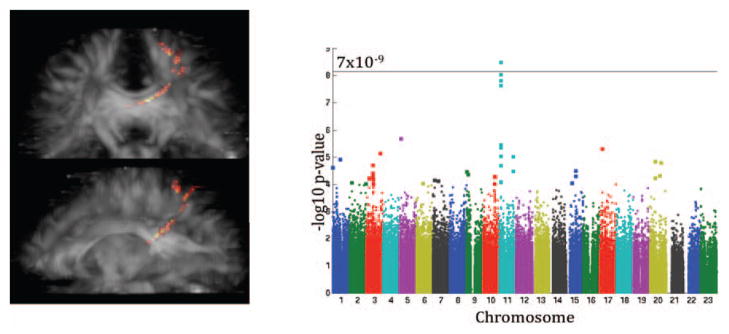
Our GWAS of the connectivity in Group 1 showed a genome-wide significant (p = 3.23×10⁻⁹) association within the SPON1 gene. The contribution of this variant was then assessed in Group 2 at the same node. The association was replicated in the second group to again show significant (p = 0.0021) reductions (un-standardized slope of regression, βGroup1 = −0.0022, βGroup2 = −0.0015) in the white matter fiber density for connections between the left posterior cingulate and the left superior parietal lobe.
For exploratory purposes, we combined the two groups to perform a GWAS at all 90 nodes as before. With 331 genotyped subjects (out of 366 subjects overall with matrices computed), the statistical power for genetic association is greatly increased; however, we are no longer able to provide a sample for replication. 4 SNPs were found to be significant: 3 in SPON1 and one in DLGAP2. A stronger association for the SPON1 variants is presented in the full group for the same connection, with an additional variant in the DLGAP2 gene showing significant associations with the proportion of fibers connecting the right superior parietal lobe and the right post-central region of the cortex. Manhattan plots for the 2 nodes where variants reached genome-wide significance are presented in Fig 5.
Figure 5.
In the full group (N=331), we conducted a GWAS at every connection, leading to two genetic loci reaching genome-wide significance (p < 7×10⁻⁹) at two connections. Manhattan plots are shown for the a) connection between the L superior parietal cortex and the L posterior cingulate where variants in SPON1 were significant, b) connection between the R superior parietal cortex and R post-central cortex, where DLGAP2 was found to have genome-wide significant associations.
4. DISCUSSION
In this study, we used 94-direction HARDI in 366 individuals at 4 Tesla, to trace fiber tracts throughout the entire brain using an orientation distribution function (ODF) based tractography method [16]. We used automatically extracted cortical labels to compute cortical connectivity matrices based on the proportion of fiber counts. Expanding on a twin design, we conducted the first-ever genetic and genome-wide association analysis of the connectivity matrices.
The nodes where genome-wide significant associations were discovered include the connections between the left superior parietal lobe and the left posterior cingulate (SPON1) and those between the right superior parietal lobe and the right post-central cortex (DLGAP2). Through our A/C/E analysis, we were able to attribute 7.1% and 38.6% of the observed variance in these two connections, respectively, to additive genetic components. Our previous analysis as demonstrated the reliability of these matrices [17]. Variants found in this study may have particular significance to genetic mechanisms underlying physiological pathways, rather than affecting the global white matter fiber density. Corrections for performing a genome-wide search (and tests across each element of the NxN matrix) are also highlighted in this study.
Figure 4.
A genome-wide significant association to connectivity was found in Group 1 (Ndiscovery=169) and replicated in an independent sample, Group 2 (Nreplication=162). The association was found for the density of connections between the left posterior cingulate and the left superior parietal lobe, shown in a). The Manhattan plot of the GWAS of this connection is shown in b). The threshold for significance was set to 7×10⁻⁹ (see text for justification).
Acknowledgments
This work was supported by NIH grant R01 HD050735 and NHMRC (Australia) grant 496682, R01 EB008281, and P41 RR013642, and NLM T15 LM07356.
References
- 1.Jolles DD, et al. A comprehensive study of whole-brain functional connectivity in children and young adults. Cereb Cortex. 2011 Feb;21:385–91. doi: 10.1093/cercor/bhq104. [DOI] [PubMed] [Google Scholar]
- 2.Thomason ME, Thompson PM. Diffusion imaging, white matter, and psychopathology. Annu Rev Clin Psychol. 2011 Apr;7:63–85. doi: 10.1146/annurev-clinpsy-032210-104507. [DOI] [PubMed] [Google Scholar]
- 3.Chiang MC, et al. Genetics of brain fiber architecture and intellectual performance. J Neurosci. 2009;29:2212–24. doi: 10.1523/JNEUROSCI.4184-08.2009. [DOI] [PMC free article] [PubMed] [Google Scholar]
- 4.Jahanshad N, et al. Genetic influences on brain asymmetry: a DTI study of 374 twins and siblings. Neuroimage. 2010 Aug 15;52:455–69. doi: 10.1016/j.neuroimage.2010.04.236. [DOI] [PMC free article] [PubMed] [Google Scholar]
- 5.Thompson PM, et al. Genetic influences on brain structure. Nat Neurosci. 2001 Dec;4:1253–8. doi: 10.1038/nn758. [DOI] [PubMed] [Google Scholar]
- 6.Kochunov P, et al. Genetics of microstructure of cerebral white matter using diffusion tensor imaging. Neuroimage. 2010 Nov 15;53:1109–16. doi: 10.1016/j.neuroimage.2010.01.078. [DOI] [PMC free article] [PubMed] [Google Scholar]
- 7.Desikan RS, et al. An automated labeling system for subdividing the human cerebral cortex on MRI scans into gyral based regions of interest. Neuroimage. 2006;31:968–80. doi: 10.1016/j.neuroimage.2006.01.021. [DOI] [PubMed] [Google Scholar]
- 8.de Zubicaray GI, et al. Meeting the Challenges of Neuroimaging Genetics. Brain Imaging Behav. 2008 Dec 1;2:258–263. doi: 10.1007/s11682-008-9029-0. [DOI] [PMC free article] [PubMed] [Google Scholar]
- 9.Jahanshad N, et al. Sex differences in the Human Connectome: 4-Tesla high angular resolution diffusion tensor imaging (HARDI) tractography in 234 young adult twins. presented at the ISBI; Chicago, IL. 2011. [Google Scholar]
- 10.Rijsdijk FV, Sham PC. Analytic approaches to twin data using structural equation models. Brief Bioinform. 2002 Jun;3:119–33. doi: 10.1093/bib/3.2.119. [DOI] [PubMed] [Google Scholar]
- 11.Benjamini Y, Hochberg Y. Controlling the False Discovery Rate - a Practical and Powerful Approach to Multiple Testing. Journal of the Royal Statistical Society Series B-Methodological. 1995;57:289–300. [Google Scholar]
- 12.Boker S, et al. OpenMx: An Open Source Extended Structural Equation Modeling Framework. Psychometrika. 2011 Apr;76:306–317. doi: 10.1007/s11336-010-9200-6. [DOI] [PMC free article] [PubMed] [Google Scholar]
- 13.Kang HM, et al. Variance component model to account for sample structure in genome-wide association studies. Nat Genet. 2010 Apr;42:348–54. doi: 10.1038/ng.548. [DOI] [PMC free article] [PubMed] [Google Scholar]
- 14.Gao X, et al. Avoiding the high Bonferroni penalty in genome-wide association studies. Genet Epidemiol. 2010 Jan;34:100–5. doi: 10.1002/gepi.20430. [DOI] [PMC free article] [PubMed] [Google Scholar]
- 15.Sabatti C, et al. Genome-wide association analysis of metabolic traits in a birth cohort from a founder population. Nat Genet. 2009 Jan;41:35–46. doi: 10.1038/ng.271. [DOI] [PMC free article] [PubMed] [Google Scholar]
- 16.Aganj I, et al. A Hough transform global probabilistic approach to multiple-subject diffusion MRI tractography. Med Image Anal. 2011 Aug;15:414–25. doi: 10.1016/j.media.2011.01.003. [DOI] [PMC free article] [PubMed] [Google Scholar]
- 17.Jahanshad N, et al. 4-Tesla High Angular Resolution Diffusion Tractography Analysis of the Human Connectome in 234 Subjects: Sex Differences and EPI Distortions Effects. ISMRM; Montréal, Canada. 2011. [Google Scholar]


