Abstract
Mixed cryoglobulinemia (MC) is the most common extrahepatic manifestation of chronic hepatitis C virus (HCV) infection. Although the formation of inflammation-triggering immune complexes is driven by clonal expansions of autoreactive B-cells we paradoxically found total B-cell numbers reduced in HCV-infected patients with MC. HCV patients with MC (n=17) also displayed a reduced number and a reduced frequency of naïve B-cells compared to HCV-infected patients without MC (n=19), HBV-infected patients (n=10) and uninfected controls (n=50). This was due to an increased sensitivity of naïve B-cells to apoptosis resulting in a reduction in the size of the naïve B-cell subset. In addition, four-fold expansion and skewing (lower T1/T2-ratio) of the immature B-cell subset was noted in MC patients suggesting that apoptosis of naïve B-cells triggered the release of B-cell precursors from the bone marrow in an attempt to maintain normal B-cell numbers.
Following treatment of MC with the B-cell-depleting antibody Rituximab, the size of all B-cell subsets, the T1/T2-ratio and cyroglobulin levels normalized. Cryoglobulin levels correlated with in vivo proliferation of T2 B-cells, suggesting a link between the skewing of the T1/T2-ratio and the formation of immune complexes.
Conclusion
This study provides insight into the mechanisms maintaining B-cell homeostasis in HCV-induced MC, and the ability of Rituximab therapy to restore normal B-cell compartments.
Keywords: HCV, liver disease, B-cells, cryoglobulin
Introduction
Chronic Hepatitis C virus (HCV) infection is associated with extrahepatic manifestations that include B-cell disorders. Mixed cryoglobulinemia (MC), the most common of these B-cell abnormalities, is characterized by clonal proliferation of B-cells and the formation of cold-precipitable cryoglobulin complexes composed of IgM antibodies with rheumatoid factor (RF) activity [reviewed in (1, 2)]. Cryoglobulins can be detected in 30–50% of chronically HCV-infected patients. About 10–15% of these patients will develop small vessel vasculitis, glomerulonephritis and neuropathy due to immune complex deposition in small blood vessels and activation of the complement cascade, and about 10% will develop B-cell non-Hodgkin lymphoma (2).
Despite activation and clonal expansion of B-cells in chronic HCV infection the number of B-cells in the blood does not increase (3, 4), and surprisingly we found it to be reduced in HCV-infected patients with MC. To investigate the mechanisms of B-cell homeostasis in the presence of large numbers of clonal B-cells, we performed a cross-sectional study on B-cell subsets of HCV patients with and without MC. B-cells of hepatitis B virus (HBV)-infected patients and uninfected blood donors were studied as controls. We also performed a prospective study to investigate whether B-cell homeostasis of HCV-infected patients with MC can be restored.
Treatment of HCV-associated MC has focused on reducing immune complex levels by targeting HCV load (which is thought to serve as an antigenic stimulus for the formation of cryoglobulins) through antiviral therapy with pegylated interferon (IFN) and ribavirin (5). However, less than 50% of treated patients show a sustained virologic response and the underlying B-cell disorder persists in patients in whom antiviral therapy fails. Rituximab, a drug developed for treating B-cell lymphoma, has been evaluated as an alternative treatment in symptomatic patients who do not respond to antiviral therapy. Rituximab, a chimeric murine/human monoclonal antibody that targets the CD20 antigen on the surface of all mature B-cells except long-lived plasma cells, and on some immature B-cells (6), triggers B-cell death through direct lysis and complement-dependent or antibody-dependent cytotoxicity, resulting in the near complete depletion of circulating B-cells. Recovery of B-cells commences approximately 6 months after cessation of therapy with B-cell numbers and cryoglobulin levels normalizing within six additional months (6).
Our study provides mechanistic data explaining alterations in B-cell subset size in chronic HCV patients with and without MC in comparison to HBV-infected patients and uninfected controls. Additionally we provide novel insight into the effect of Rituximab on the immature B-cell compartment.
Materials and Methods
Study participants
36 patients with chronic hepatitis C with (n=17) and without MC (n=19, table I), 10 patients with chronic HBeAg+ HBV infection and 50 uninfected blood donors gave written informed consent to study protocols that conformed to the ethical guidelines of the 1975 Declaration of Helsinki and were approved by the NIDDK or NIAID institutional review boards. Patients had either never been treated for chronic hepatitis or failed standard treatment more than 1 year prior to this study. HCV RNA levels were determined by Cobas Amplicor HCV Monitor v2.0 (Roche, Pleasanton, CA), cryoglobulins levels were measured in the NIH clinical pathology department.
Table I.
Demographics of HCV-infected patients without and with MC
| HCV-infected patients Without MC | HCV-infected patients with MC | |
|---|---|---|
| Subjects | 19 | 17 |
| Age [median year (IQR)] | 55 (43–59) | 54 (47–57) |
| Gender (male: female) | 14:5 | 12:5 |
| Genotype 1% | 95 | 79 (3 patients unknown) |
| HCV RNA [median IU/mL (IQR)] | 1.5×10⁶ (3×10⁵ – 3.9×10⁶) | 6.3×10⁵ (6.6×10⁴ – 2.2×10⁶) |
| ALT [median (IQR)] | 66 (51–94) | 51 (45–75) |
| Cryoglobulin % [median (IQR)] | 0 | 10 (4–20) |
Rituximab treatment
Eligibility for treatment with 375 mg/m2 of Rituximab (Genentech, San Francisco, CA) weekly for 4 weeks included HCV infection with MC, vasculitis in at least one organ, and failure or inability to tolerate IFN-α/ribavirin treatment (7). Leukopacks were collected prior to, and 4 and 12 months after treatment, and 50 ml blood was drawn 2, 6, 8 and 10 months after cessation of treatment.
B-cell analysis
Cryopreserved, thawed peripheral blood mononuclear cells (PBMC) were treated with Live/Dead Fixable Violet dye (Invitrogen, Carlsbad, CA) and stained with antibodies to CD19, CD20, CD10, CD27 and CD21 (BD Biosciences, San Jose, CA), and to CD14, CD3 and CD56 (Biolegend, San Diego, CA). B-cell lymphoma-2 (Bcl-2; US Biologicals, Swampscott, MA) and Ki-67 (Millipore, Billerica, MA) intracellular stains were performed using BD Cytofix/Cytoperm kits (BD Biosciences). Samples were analyzed on an LSRII flow cytometer using FACSDiva 6.1 (BD Biosciences) and FlowJo software (TreeStar Inc., Ashland, OR).
B-cell apoptosis assay
CD19+ B-cells of greater than 95% purity were obtained by negative bead selection (Miltenyi Biotec, Auburn, CA). Immature and mature B-cell subsets (greater than 90% purity) were subsequently separated using EasySep® Human CD10 Positive Selection kit (Stem Cell Technologies, Vancouver, BC), incubated at 106 cells/mL in RPMI1640 with 10% fetal bovine serum (US Bio-Technologies, Pottstown, PA), 10 mM HEPES, 100 IU/mL penicillin, 100 μg/mL streptomycin, and 2 mM L-glutamine (Mediatech, Herndon, VA) for 24h, then stained as above, fixed, permeabilised and stained with antibodies to cleaved caspases 3 and 8 (Cell Signaling Technologies, Danvers, MA) and D4-GD1 (Imgenex, San Diego, CA).
Statistics
Prism 5 (GraphPad software Inc, La Jolla, CA) was used to perform (i) Kruskal-Wallis test followed by Dunn’s post-test for analysis of 3 or more groups, and (ii) Mann Whitney test for analysis of two groups. P values of less than 0.05 were considered significant.
Results
Frequency and number of naïve mature B-cells are decreased in HCV-infected patients with MC
Multicolor flow cytometry was used to phenotype B-cells of HCV-infected patients with and without MC in comparison to control groups of chronic, HBeAg+ HBV-infected patients and uninfected blood donors. HBV-infected patients were studied to assess general changes in B-cell percentages and phenotype during chronic hepatitis.
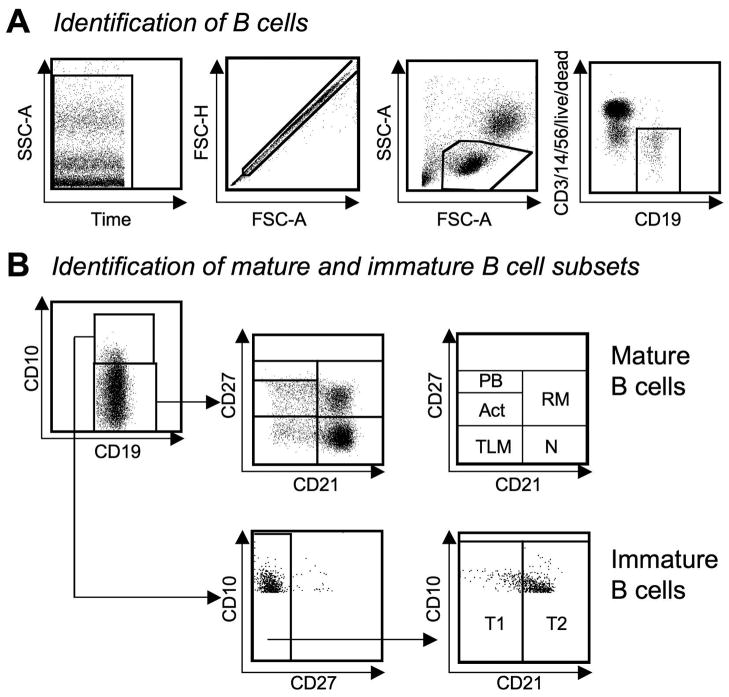
After setting time, single cell and lymphocyte gates, CD19+ B-cells were selected and dead cells, T-cells, NK cells and macrophages were excluded (Fig. 1A). CD19+ B-cells were divided into mature and immature subsets based on CD10 expression (Fig. 1B). CD10− mature B-cells were further divided into plasmablasts, activated, tissue-like memory, resting mature and naïve B-cells based on CD21 and CD27 expression. CD10+CD27− immature transitional B-cells were classified as T1 and T2 cells based on CD21 expression to mark distinct stages of differentiation.
Fig. 1. Analysis of B-cells by flow cytometry.
(A) B-cells were identified using time, single cell and lymphocyte and CD19+ gates. Dead cells, T-cells, NK cells and macrophages were excluded.
(B) CD19+ B-cells were grouped into CD10− mature and CD10+ immature subsets. Mature B-cells were classified into plasmablasts (PB), activated (Act), tissue-like memory (TLM), naïve (N) and resting memory (RM) B-cells based on CD21 and CD27 expression. Immature transitional (CD10+CD27−) B-cells were classified as CD21− T1 or CD21+ T2 cells. Gates were based on fluorescence-minus-one controls.
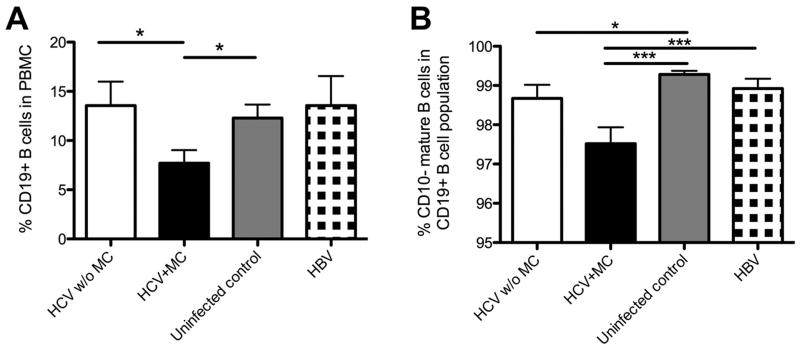
Based on reports of clonal B-cell expansions we expected an increased B-cell frequency in the presence of MC. However, whereas white blood cell counts and absolute lymphocyte counts did not differ among patients and uninfected controls (Suppl. Fig. 1A, B) the frequency of CD19+ B-cells was significantly lower in HCV-infected patients with MC (7.7±1.3%) than in those without MC (13.6±2.4%, p<0.05) and uninfected controls (12.3±1.4%, p<0.05) (Fig. 2A). HCV-infected patients with and without MC also differed in absolute numbers of CD19+ B-cells (103.6±26.9/μL versus 299.2±58.8/μL, p<0.05) (Suppl. Fig. 1C).
Fig. 2. HCV-infected patients with MC display reduced percentages of CD19+ B-cells and CD19+ CD10− mature B-cells.
(A) Percentage of CD19+ B-cells in PBMC.
(B) Percentage of CD10− mature B-cells in the CD19+ B-cell population. Mean±SEM are shown. *p<0.05, ***p<0.001.
In addition to the reduced size of the CD19+ B-cell population, the frequency of CD19+CD10− mature B-cells was lower in HCV-infected patients with MC (97.5±0.4%) than in HCV-infected patients without MC (98.7±0.3%, p=0.07), uninfected controls (99.3±0.1%, p<0.001) and HBV-infected patients (98.9±0.3%, p<0.001, Fig. 2B). This was consistent with a decreased absolute number of CD19+CD10− mature B-cells in the blood of HCV-infected patients with MC (101.5±26.5/μL) compared to HCV-infected patients without MC (294.1±58.3/μL, p=0.05, Suppl. Fig 1D).
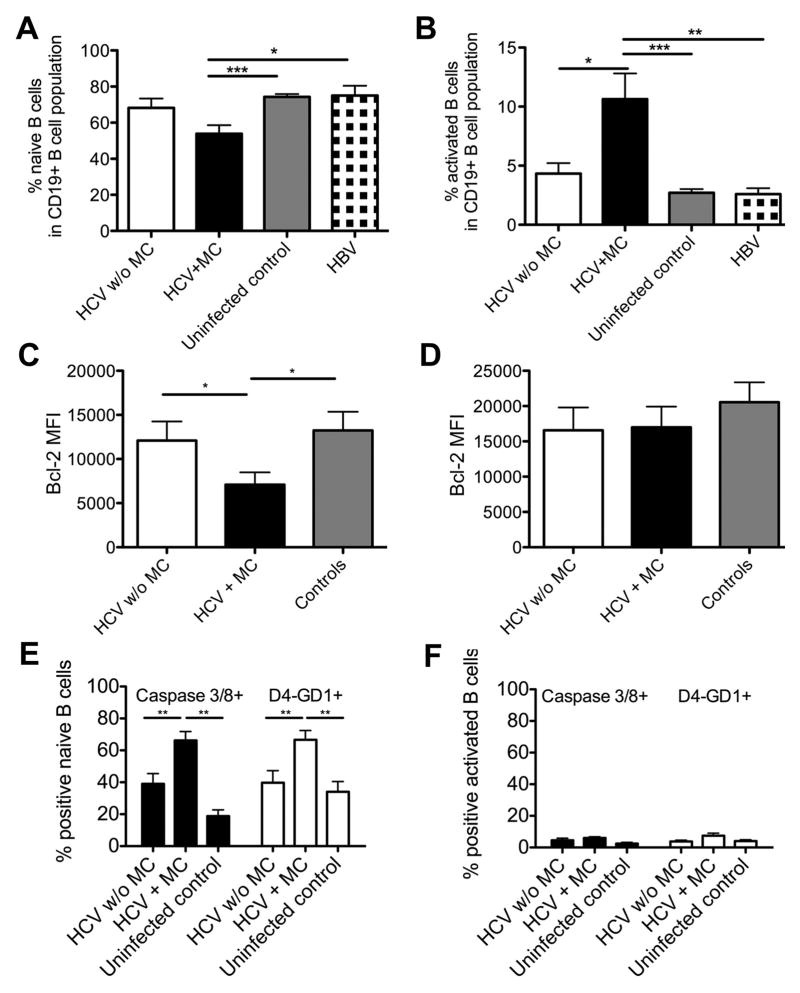
We next studied the size of individual mature B cell subsets and detected no change in the percentage or absolute number of resting memory cells, tissue-like memory cells or plasmablasts. However, HCV-infected patients with MC displayed a significantly reduced frequency of naïve B-cells (53.9±4.7%), the largest mature B-cell subset, as compared to HBV-infected patients (75±5.4%, p<0.001) and uninfected controls (74.3±1.6%, p<0.05, Fig. 3, Fig. 4A). This was recapitulated in a reduction of the absolute number of naïve mature B-cells in HCV-infected patients with MC (50.6±17.7/μL) compared to those without MC (221.8±48.7/μL, p<0.001) and those with HBV infection (151.9±33.3/μL, p<0.05, Suppl. Fig. 1E).
Fig. 3. FACS dot plots displaying mature B-cell subsets of representative patients.
Gates and abbreviations as in Fig. 1.
Fig. 4. HCV-infected patients with MC display reduced a percentage of naïve B-cells and an increased percentage of activated B-cells with differential sensitivity to apoptosis.
(A–B) Percentage of CD21+CD27− naive B-cells (A) and CD21−CD27+ activated B-cells (B) in the mature B-cell subset.
(C–D) MFI of the antiapoptotic protein Bcl-2 in naive (C) and activated/memory B-cells (D).
(E–F) Percentage of caspase 3/caspase 8-double-positive and D4-GD1-positive B-cells in naive (E) and activated/memory B-cell subsets (F) following overnight culture in the absence of growth factors and cytokines. Mean±SEM are shown. *p<0.05, **p<0.01, ***p<0.001. There is a trend towards a lower frequency of naïve B-cells in HCV-infected patients with MC as compared to HCV-infected patients without MC (p=0.06).
In contrast to the decreased frequency and number of naïve B-cells, the relative size of the activated mature B-cell subset was increased in HCV-infected patients with MC (10.6±2.1%) compared to HCV-infected patients without MC (4.3±0.8%, p<0.05), HBV-infected patients (2.6±0.5%, p<0.001) and uninfected controls (2.7±0.3%, p<0.0001, Fig. 3, Fig. 4B). This was expected because cryoglobulins are produced by clonally expanded activated B-cells (8). However, this increased frequency did not result in an increased absolute number of activated B-cells (Suppl. Fig. 1F).
Naïve B-cells of HCV-infected patients with MC display an increased apoptosis susceptibility
To investigate the reasons for the decreased frequency and number of naïve B-cells we examined their susceptibility to apoptosis. Naïve B-cells expressed significantly less antiapoptotic protein Bcl-2 [mean fluorescence intensity (MFI) 7096] in HCV-infected patients with MC than in HCV-infected patients without MC (MFI 12095, p<0.05) and uninfected controls (MFI 13240, p<0.05, Fig. 4C) whereas activated B-cells did not exhibit differential expression levels of Bcl-2 (Fig. 4D).
To confirm the functional relevance of differential Bcl-2 expression, B-cells were isolated and immature B-cells removed by CD10-positive selection. The resulting B-cell population was cultured overnight without growth factors or cytokines and mature B-cell subsets were analyzed for apoptosis. Naive B-cells of HCV-infected patients with MC expressed higher levels of activated caspase 3 and 8 than those of HCV-infected without MC and uninfected controls (p<0.01, Fig. 4E). Apoptosis of naïve B-cells from HCV patients with MC was confirmed by increased expression of D4-GD1, a substrate of active caspase 3, when compared to naïve B-cells of HCV-infected without MC and uninfected controls (p<0.01, Fig. 4E). Furthermore, caspase 3, caspase 8 and D4-GD1 MFI were increased in naïve B-cells of HCV-infected patients with MC compared to uninfected controls and HCV patients without MC (not shown). In contrast, caspase 3 and 8 and the caspase 3 substrate D4-GD1 were not differentially expressed in CD27+ activated/memory B-cells of HCV-infected patients with and without MC and uninfected controls (Fig. 4F).
Of note, it was not possible to distinguish between naïve and tissue-like memory B-cells in this assay as dying cells downregulate CD21. However, even if we could not formally exclude the presence of apoptosis-prone, CD21− tissue-like memory cells, they were unlikely to account for the large percentage (approx. 70%) of apoptotic cells in the culture because they compromise only a small (<5%) fraction CD19+ B-cells, which translates to at most 10% of the cells in culture. Thus, naïve B-cells from HCV patients with MC were more susceptible to apoptosis, which is reflected in their reduced percentage and number. Since naïve B-cells make up the largest fraction of the mature B-cell compartment (approx. 75%) their reduced frequency may contribute to the observed reduction in CD19+ B-cell numbers of HCV-infected patients with MC.
The size of the immature B-cell subset is increased in HCV-infected patients with MC
To investigate whether apoptosis of naive mature B-cells caused compensatory changes in the immature subset, we studied immature transitional B-cells, which link the pro-B-cell compartment in the bone marrow to the mature B-cell compartment in the spleen (9). Immature B-cells that emigrate from the bone marrow to the spleen are defined as transitional B-cells and can be distinguished from mature B-cells by the presence of CD10 and absence of CD27 (Fig. 1B). They gain expression of CD21 during their transition to mature B-cells, and thus can be further classified into CD21− T1 and CD21+ T2 subsets with T1 cells representing the developmentally earlier subset (9).
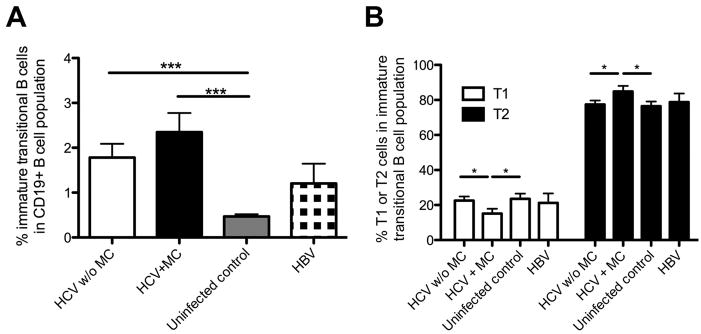
As shown in figure 5A, HCV-infected patients with and without MC displayed significantly more immature transitional B-cells within the CD19+ B-cell compartment than uninfected controls (1.2±0.27 and 2.5±0.43%, respectively, vs. 0.47±0.05%, p<0.001). This was not due to leukopenia or lymphopenia as all HCV-infected patients displayed normal leukocyte and lymphocyte counts (Suppl. Fig. 1A). Although the difference in the percentage of immature transitional B-cells between HCV-infected patients with and without mixed cryoglobulinemia did not reach statistical significance, HCV-infected patients with MC displayed a significantly reduced T1-cell and an increased T2-cell percentage in the immature transitional B-cell subset as compared to HCV-infected patients without MC resulting in a decreased T1/T2-ratio of 1:5 (p<0.05, Fig. 5B). In contrast, HCV-infected patients without MC maintained the same T1/T2-ratio of 1:3 as uninfected controls and HBV patients (Fig. 5B).
Fig. 5. HCV-infected patients with MC display an increased percentage of immature transitional B-cells with an altered T1/T2-ratio.
(A) Percentage of immature transitional CD19+CD10+CD27− B-cells in the CD19+ B-cell subset.
(B) Percentage of T1 (CD21−) and T2 (CD21+) cells within the immature transitional B-cell subset. Mean±SEM are shown. *p<0.05, ***p<0.001.
Thus, HCV infection results in an increased frequency of immature transitional B-cells, and in additional changes in the composition of the T1 and T2 subsets in the presence of MC. The expansion of immature B-cells in the presence of MC may represent a reaction to the decreased size of the mature naïve B-cell compartment. This hypothesis is consistent with a trend that immature transitional B-cells from HCV-infected patients with MC expressed higher levels of the proliferation marker Ki-67 than immature transitional B-cells from HCV patients without MC and uninfected controls (not shown).
Rituximab-induced depletion and regeneration of the B-cell compartment restores the T1/T2-ratio in the immature transitional B-cell subset
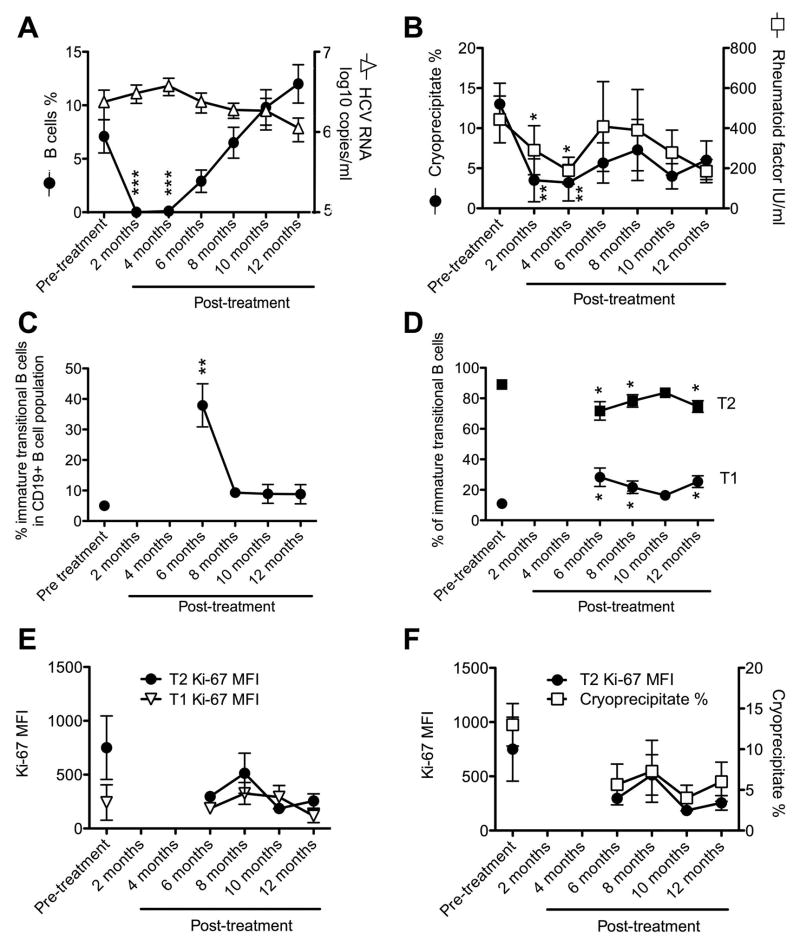
To determine how Rituximab treatment alters B-cell subset homeostasis we prospectively studied nine HCV-infected patients with MC prior to and up to 12 months after treatment with Rituximab. B-cell depletion to less than 0.05% of the circulating lymphocyte population was achieved in all 9 patients (Fig. 6A, p<0.01 compared to pre-treatment). The few B-cells that remained in the periphery were activated and resting memory B-cells but their numbers were extremely low (<0.0005% of all blood lymphocytes, not shown). Cryoglobulin and RF factor levels were significantly lower 2 and 4 months post-treatment than pre-treatment (p<0.01 and p<0.05, respectively, Fig. 5B) whereas HCV titers did not change by more than 1 log (Fig. 6A–B).
Fig. 6. Rituximab restores the T1/T2-ratio in MC patients.
HCV-infected patients with MC were studied prior to, during and after treatment with Rituximab for changes in HCV titer and percentage of B-cells (A), the kinetics of cryoglobulin and RF levels (B), the percentage of immature transitional B-cells within CD19+ B-cells (C), the percentage of T1 and T2 immature transitional B-cells (D), Ki-67 levels in T1 and T2 immature transitional B-cells (E), and the correlation of Ki-67 MFI of T2 immature transitional B-cells with the percentage of cryoglobulins (F). Mean±SEM are shown (n=9 patients). *p<0.05, **p<0.01, ***p<0.001 compared to pretreatment.
The recovery of CD19+ B-cells started approximately 6 months post treatment and reached pre-treatment levels within the following 4–6 months (Fig. 6A). Immune reconstitution was associated with a temporary expansion of immature transitional B-cells to almost 40% of all CD19+ B-cells 6 months post-treatment (p<0.01 compared to pre-treatment, Fig. 6C). This was associated with a lasting increase in the percentage of T1 cells (p<0.05) and a decrease in the percentage of T2 cells (p<0.05) thereby increasing the T1/T2-ratio from 1:5 pre-treatment to 1:3 as early as 6 months post-treatment (Fig. 6D). The increased T1/T2-ratio was not due to lymphopenia-induced proliferation of T1 cells because Ki67 expression remained stable in this immature B-cell subset (Fig. 6E). Rather, it was related to reduced T2 proliferation because Ki-67 expression tended to decrease in T2 cells (MFI 750±294 prior to treatment versus 255±43 six months after cessation of treatment, p=0.07, Fig. 6E). Even though this trend did not reach statistical significance in this small group of 9 patients it is strengthened by the correlation between T2 proliferation and cryoglobulin levels (Fig. 6F, p<0.05), which suggests a link between the skewing of the T1/T2-ratio and the formation of immune complexes.
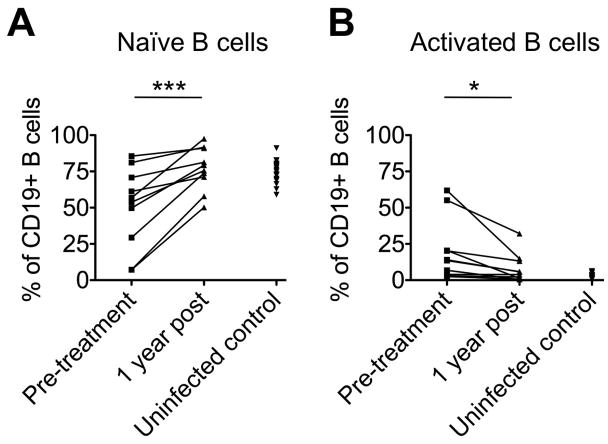
Importantly, the reconstituted mature B-cell subsets were more akin to those of uninfected controls MC as evidenced by high percentages of naïve B-cells and reduced percentages of activated B-cells (Fig. 7). Rituximab therefore not only reset the mature B-cell compartment but also removed the distortions in immature B-cell subsets that are typical for MC.
Fig. 7. Rituximab treatment normalizes mature B-cell subsets.
Paired analysis of the frequency of naïve (A) and activated B-cells (B) within the CD19+ B-cell population prior to and 12 months after Rituximab treatment, compared to the corresponding B-cell percentages in uninfected controls. *p<0.05, ***p<0.001.
Discussion
This study provides new insight into B-cell homeostasis in HCV-associated MC. While B-cell activation is a well-known feature of HCV infection (10) and clonal B-cell expansions are typical for HCV-associated MC (8), we found both the percentage and the absolute number of CD19+ B-cells to be significantly lower in the blood of HCV-infected patients with MC than in HCV-infected patients without MC and uninfected controls (Fig. 2, Suppl. Fig. 1). Why are B-cell numbers decreased in the presence of clonally expanded B-cells that drive the disease? Charles et al. suggested that many clonally expanded B-cells are anergic and undergo apoptosis (11). However, anergy does not explain the continuous inflammation and is difficult to reconcile with the observed increased percentage of activated B-cells (Fig. 3, 4). Racanelli et al. suggested that CD27+ mature B-cells terminally differentiate into noncycling antibody-producing cells in HCV infection (10). However, their study did not differentiate between CD27+ mature B-cell subsets and did not compare HCV-infected patients with and without MC.
Here, we offer an alternative explanation based on our observation that naïve B-cells of HCV-infected patients with MC were highly susceptible to apoptosis whereas activated/memory B-cells were resistant (Fig. 4). This process was enhanced in MC because naïve B-cells of HCV-infected patients with MC expressed significantly less Bcl-2 than those of HCV-infected patients without MC (Fig. 4). Furthermore, they significantly increased both caspase 3 and 8 expression in vitro (Fig. 4), suggesting death was instigated by a Bid-mediated mechanism that links intrinsic and extrinsic apoptosis pathways (12). These results provide mechanistic data on the death of naïve B-cells to a previous study by Cacoub et al. who reported a decreased naïve B-cell frequency in untreated MC patients but did not examine the underlying mechanism (13), nor study absolute B-cell numbers or patients with other liver diseases. Furthermore, we analyze a neglected subset of B-cells, the immature B-cells. This subset becomes increasingly important following treatment with Rituximab as during the initial stages of B cell reconstitution these cells comprise the majority of B-cells and following their maturation will form the new mature B cell compartment.
As naïve B-cells comprise approximately 70% of all B-cells, their rapid turnover may trigger the release of immature B-cells from the bone marrow, accounting for the observed increase in the percentage of immature transitional B-cells in HCV patients with and without cryoglobulinemia as compared to uninfected controls (Fig. 5). An increased proportion of immature B-cells has also been observed in HIV infection in correlation with CD4+ T-cell deficiency (14) and IL-7 levels (14, 15). In contrast to HIV infection, there was no significant change in T-cell percentages in HCV-infected patients with and without MC as compared to uninfected controls (not shown). Based on the observed reduction of CD19+ B-cell percentages and numbers (Fig. 2, Suppl. Fig. 1), and the increased apoptosis susceptibility of their main fraction, the naïve B-cell population (Fig. 4), we propose that the increase in immature B-cells is due to a secondary egress from the bone marrow to compensate for the B-cell loss in the periphery. This process may be mediated by BAFF, a B-cell growth factor that is elevated in the plasma of HCV patients (16, 17).
A potential weakness of our study was the use of frozen and thawed rather than freshly isolated PBMC. However, omission of the freezing step was not feasible as symptomatic mixed cryoglobulinemia is a rare condition and only a few patient samples could be collected per year. To keep variations in experimental conditions to a minimum (e.g. changes in MFI due to alterations in laser power of the flow cytometer), all PBMC samples were frozen and studied collectively within a short time period using the same protocol and experimental conditions. Even though the percentage of differentiated B-cells may have decreased due to freezing/thawing of the PBMC, we were still able to see differences in B cell populations among individual patient groups and changes in B cell percentages in patients whose PBMC samples were collected over time and studied retrospectively.
The observed enhanced B-cell apoptosis may appear inconsistent with the increased lymphoma risk of MC patients (18). However, we do not believe this is the case as we found only the naïve, but not the activated/memory B-cell subset to be prone to apoptosis. Indeed, it is well established that the pathogenic B-cells in MC are memory B-cells with a restricted immunoglobulin repertoire (8), and the same cells are found in HCV-associated lymphoma (2). How these cells are generated has been a contentious subject for many years. It has been suggested that HCV induces malignancy by infecting B-cells (19) but this has been challenged as other investigators have been unable to detect HCV in B-cells ex vivo and after B-cell expansion in vitro (20). Moreover, the HCV titer did not significantly increase after B-cell depletion with Rituximab (Fig. 6), which is inconsistent with B-cells harboring significant amounts of virus. Alternative suggestions include B cell stimulation by HCV core and E2 (10, 21–23), but this also cannot explain the restricted repertoire of pathogenic B-cells in HCV-related MC. Thus, we favor the hypothesis that a combination of multiple factors including chronic antigen stimulation (23), elevated B-cell growth factor expression (17) and genetic predisposition (24) trigger B-cell clonal expansion.
Rituximab therapy is an alternative treatment approach for MC patients who have failed antiviral therapy. All patients enrolled in our study responded effectively to Rituximab (7), as B-cells were undetectable within 2 month (Fig. 6) and recovered 6–12 months after cessation of therapy. Prior to treatment, HCV-infected patients with MC displayed not only an increased frequency of immature transitional B-cells in the blood but also an altered ratio of T1 to T2 immature transitional B-cells. Uninfected controls generally have a 1:3 ratio of T1:T2 immature transitional B-cells but this ratio decreased to 1:5–1:6 in HCV-infected patients with MC. The altered T1:T2 ratio was not linked to apoptosis as immature B-cells from HCV-infected patients with MC expressed lower levels of Bcl-2 than those of HCV-infected patients without MC and uninfected controls (not shown). Rather, it was related to cryoglobulin levels, which decreased in parallel with the in vivo proliferation rate (as measured by Ki67 levels) of T2 immature transitional B-cells (Fig. 6).
Thus, we propose a model in which infection with HCV induces apoptosis of naïve mature B-cells resulting in an increased size of the immature B-cell subset. This process is accelerated in the presence of MC. Furthermore, MC promotes the proliferation of T2 immature transitional B-cells resulting in a decreased T1/T2-ratio. Treatments that reduce cryoglobulin levels such as Rituximab restore a normal T1/T2-ratio with reduced proliferation of T2 immature transitional B-cells. These data may provide a mechanistic explanation for the observed maintenance of normal B cell numbers and the increase in immature transitional B-cells in the blood of chronic HCV patients with MC.
Supplementary Material
Acknowledgments
Financial Support: This study was supported by the NIAID, NIH intramural research program and the NIDDK, NIH intramural research program.
The authors thank Catherine Rehm and Laura Heytons for the collection of patient samples during rituximab therapy.
Abbreviations
- HCV
hepatitis C virus
- MC
mixed cryoglobulinemia
- RF
rheumatoid factor
- IFN-α
interferon-α
- HBV
hepatitis B virus
- PBMC
peripheral blood mononuclear cell
- Bcl-2
B-cell lymphoma-2
- MFI
mean fluorescence intensity
References
- 1.Agnello V, Chung RT, Kaplan LM. A role for hepatitis C virus infection in type II cryoglobulinemia. N Engl J Med. 1992;327:1490–1495. doi: 10.1056/NEJM199211193272104. [DOI] [PubMed] [Google Scholar]
- 2.Charles ED, Dustin LB. Hepatitis C virus-induced cryoglobulinemia. Kidney Int. 2009;76:818–824. doi: 10.1038/ki.2009.247. [DOI] [PMC free article] [PubMed] [Google Scholar]
- 3.Oliviero B, Cerino A, Varchetta S, Paudice E, Pai S, Ludovisi S, Zaramella M, et al. Enhanced B-cell differentiation and reduced proliferative capacity in chronic hepatitis C and chronic hepatitis B virus infections. J Hepatol. 2011;55:53–60. doi: 10.1016/j.jhep.2010.10.016. [DOI] [PubMed] [Google Scholar]
- 4.Herkel J, Carambia A. Let it B in viral hepatitis? J Hepatol. 2011;55:5–7. doi: 10.1016/j.jhep.2010.12.027. [DOI] [PubMed] [Google Scholar]
- 5.Saadoun D, Resche-Rigon M, Thibault V, Piette JC, Cacoub P. Antiviral therapy for hepatitis C virus--associated mixed cryoglobulinemia vasculitis: a long-term followup study. Arthritis Rheum. 2006;54:3696–3706. doi: 10.1002/art.22168. [DOI] [PubMed] [Google Scholar]
- 6.Reff ME, Carner K, Chambers KS, Chinn PC, Leonard JE, Raab R, Newman RA, et al. Depletion of B cells in vivo by a chimeric mouse human monoclonal antibody to CD20. Blood. 1994;83:435–445. [PubMed] [Google Scholar]
- 7.Sneller MC, Hu Z, Langford CA. A randomized controlled trial of rituximab following failure of antiviral therapy for hepatitis C virus-associated cryoglobulinemic vasculitis. Arthritis Rheum. 2012;64:835–842. doi: 10.1002/art.34322. [DOI] [PMC free article] [PubMed] [Google Scholar]
- 8.Charles ED, Green RM, Marukian S, Talal AH, Lake-Bakaar GV, Jacobson IM, Rice CM, et al. Clonal expansion of immunoglobulin M+CD27+ B cells in HCV-associated mixed cryoglobulinemia. Blood. 2008;111:1344–1356. doi: 10.1182/blood-2007-07-101717. [DOI] [PMC free article] [PubMed] [Google Scholar]
- 9.Loder F, Mutschler B, Ray RJ, Paige CJ, Sideras P, Torres R, Lamers MC, et al. B cell development in the spleen takes place in discrete steps and is determined by the quality of B cell receptor-derived signals. J Exp Med. 1999;190:75–89. doi: 10.1084/jem.190.1.75. [DOI] [PMC free article] [PubMed] [Google Scholar]
- 10.Racanelli V, Frassanito MA, Leone P, Galiano M, De Re V, Silvestris F, Dammacco F. Antibody production and in vitro behavior of CD27-defined B-cell subsets: persistent hepatitis C virus infection changes the rules. J Virol. 2006;80:3923–3934. doi: 10.1128/JVI.80.8.3923-3934.2006. [DOI] [PMC free article] [PubMed] [Google Scholar]
- 11.Charles ED, Brunetti C, Marukian S, Ritola KD, Talal AH, Marks K, Jacobson IM, et al. Clonal B cells in patients with hepatitis C virus-associated mixed cryoglobulinemia contain an expanded anergic CD21low B-cell subset. Blood. 2011;117:5425–5437. doi: 10.1182/blood-2010-10-312942. [DOI] [PMC free article] [PubMed] [Google Scholar]
- 12.Luo X, Budihardjo I, Zou H, Slaughter C, Wang X. Bid, a Bcl2 interacting protein, mediates cytochrome c release from mitochondria in response to activation of cell surface death receptors. Cell. 1998;94:481–490. doi: 10.1016/s0092-8674(00)81589-5. [DOI] [PubMed] [Google Scholar]
- 13.Saadoun D, Rosenzwajg M, Landau D, Piette JC, Klatzmann D, Cacoub P. Restoration of peripheral immune homeostasis after rituximab in mixed cryoglobulinemia vasculitis. Blood. 2008;111:5334–5341. doi: 10.1182/blood-2007-11-122713. [DOI] [PubMed] [Google Scholar]
- 14.Malaspina A, Moir S, Chaitt DG, Rehm CA, Kottilil S, Falloon J, Fauci AS. Idiopathic CD4+ T lymphocytopenia is associated with increases in immature/transitional B cells and serum levels of IL-7. Blood. 2007;109:2086–2088. doi: 10.1182/blood-2006-06-031385. [DOI] [PMC free article] [PubMed] [Google Scholar]
- 15.Malaspina A, Moir S, Ho J, Wang W, Howell ML, O’Shea MA, Roby GA, et al. Appearance of immature/transitional B cells in HIV-infected individuals with advanced disease: correlation with increased IL-7. Proc Natl Acad Sci U S A. 2006;103:2262–2267. doi: 10.1073/pnas.0511094103. [DOI] [PMC free article] [PubMed] [Google Scholar]
- 16.Sugalski JM, Rodriguez B, Moir S, Anthony DD. Peripheral blood B cell subset skewing is associated with altered cell cycling and intrinsic resistance to apoptosis and reflects a state of immune activation in chronic hepatitis C virus infection. J Immunol. 2010;185:3019–3027. doi: 10.4049/jimmunol.1000879. [DOI] [PMC free article] [PubMed] [Google Scholar]
- 17.Landau DA, Rosenzwajg M, Saadoun D, Klatzmann D, Cacoub P. The B lymphocyte stimulator receptor-ligand system in hepatitis C virus-induced B cell clonal disorders. Ann Rheum Dis. 2009;68:337–344. doi: 10.1136/ard.2007.085910. [DOI] [PubMed] [Google Scholar]
- 18.Ivanovski M, Silvestri F, Pozzato G, Anand S, Mazzaro C, Burrone OR, Efremov DG. Somatic hypermutation, clonal diversity, and preferential expression of the VH 51p1/VL kv325 immunoglobulin gene combination in hepatitis C virus-associated immunocytomas. Blood. 1998;91:2433–2442. [PubMed] [Google Scholar]
- 19.Sansonno D, Tucci FA, Lauletta G, De Re V, Montrone M, Troiani L, Sansonno L, et al. Hepatitis C virus productive infection in mononuclear cells from patients with cryoglobulinaemia. Clin Exp Immunol. 2007;147:241–248. doi: 10.1111/j.1365-2249.2006.03272.x. [DOI] [PMC free article] [PubMed] [Google Scholar]
- 20.Marukian S, Jones CT, Andrus L, Evans MJ, Ritola KD, Charles ED, Rice CM, et al. Cell culture-produced hepatitis C virus does not infect peripheral blood mononuclear cells. Hepatology. 2008;48:1843–1850. doi: 10.1002/hep.22550. [DOI] [PMC free article] [PubMed] [Google Scholar]
- 21.Maillard P, Lavergne JP, Siberil S, Faure G, Roohvand F, Petres S, Teillaud JL, et al. Fcgamma receptor-like activity of hepatitis C virus core protein. J Biol Chem. 2004;279:2430–2437. doi: 10.1074/jbc.M311470200. [DOI] [PubMed] [Google Scholar]
- 22.Rosa D, Saletti G, De Gregorio E, Zorat F, Comar C, D’Oro U, Nuti S, et al. Activation of naive B lymphocytes via CD81, a pathogenetic mechanism for hepatitis C virus-associated B lymphocyte disorders. Proc Natl Acad Sci U S A. 2005;102:18544–18549. doi: 10.1073/pnas.0509402102. [DOI] [PMC free article] [PubMed] [Google Scholar]
- 23.Quinn ER, Chan CH, Hadlock KG, Foung SK, Flint M, Levy S. The B-cell receptor of a hepatitis C virus (HCV)-associated non-Hodgkin lymphoma binds the viral E2 envelope protein, implicating HCV in lymphomagenesis. Blood. 2001;98:3745–3749. doi: 10.1182/blood.v98.13.3745. [DOI] [PubMed] [Google Scholar]
- 24.De Re V, Caggiari L, De Vita S, Mazzaro C, Lenzi M, Galli M, Monti G, et al. Genetic insights into the disease mechanisms of type II mixed cryoglobulinemia induced by hepatitis C virus. Dig Liver Dis. 2007;39 (Suppl 1):S65–71. doi: 10.1016/s1590-8658(07)80014-4. [DOI] [PubMed] [Google Scholar]
Associated Data
This section collects any data citations, data availability statements, or supplementary materials included in this article.


