

Abstract
Incidence of kidney cancer is on the rise, and a better understanding of molecular mechanisms involved in the cancer invasion and metastasis is required for the development of curative therapeutics. In this study, we report that the proinflammatory cytokine prostaglandin E2 (PGE2) induces the malignant SN12C, but not benign HK2 kidney cell invasion. The PGE2 increases SN12C cell invasion through a signal pathway that encompasses EP2 and EP4, Akt, small GTPase RalA and Ral GTP inactivator RGC2. The results support the idea that targeted interference of EP2/EP4 signal to RalA GTP may provide benefit to patients diagnosed with advanced kidney cancer.
Keywords: renal cell carcinoma, cell invasion, inflammation, PGE2, Ral
Introduction
Kidney cancer is the most lethal genitourinary cancer and renal cell carcinoma (RCC), the most common type of kidney cancer, accounts for about 3% of all cancer diagnoses in the USA each year (1). In 2011, an estimated 60,920 Americans were diagnosed with kidney and renal pelvis cancer and 13,120 died from the disease (1). Five major RCC subtypes are recognized based on histopathologic appearance, including clear cell, papillary, chromophobe, oncocytoma and collecting-duct (2). Often, RCC is resistant to conventional cytotoxic and radiation therapies, although targeted therapies are effective in some cases (3, 4). RCCs are usually detected locally, although about one third of patients present with disseminated cancer (5) that eventually leads to patient mortality (6). Hence, the early detection and interference with the cancer metastasis are crucial factors to improve patient overall and progression-free survival.
Emerging evidence supports a role for inflammation in tumorigenesis (7, 8), and the proinflammatory cytokine prostaglandin E2 (PGE2) impacts both the cancer cells and reactive stroma in the tumor microenvironment (9). Prostaglandins are endogenously produced by cytosolic phospholipase A2-mediated release of arachidonic acid from phospholipids that, in turn, is metabolized by cyclooxygenase (COX) enzymes (10). Of significance, expression of COX2 and PGE2 is substantially increased in diseased tissues of patients diagnosed with cancer (11–13), and PGE2 is the predominant prostaglandin in the kidney. Four cognate receptors named EP1, EP2, EP3 and EP4 (10, 14) transduce PGE2’s effects on target cells. These receptors belong to the G protein-coupled receptor (GPCR) family and, in most cells, activated EP1 couples to Gq and induces the activation of protein kinase C consequent to intracellular Ca+2 mobilization. EP3 couples to Gi and inhibits accumulation of adenosine 3′,5′-cyclic monophosphate (cAMP), whereas EP2 and EP4 couple to Gs and promote the synthesis of cAMP (14). In addition, Gβγ subunits transduce PGE2-initiated signals leading, for example, to transactivation of epidermal growth factor receptor (EGFR) and its downstream signaling networks (15). Hence, the PGE2-EP pairs transduce multiple and specific signals in target cells.
Available evidence demonstrates a role for PGE2 and its receptors in cancer cell growth and invasion. For instance, in the tumor milieu PGE2 may act directly upon the epithelial cancer cells to influence their growth rate and invasion (16, 17), or on hematopoietic (9) and endothelial (18, 19) cells in the stroma to regulate local immune suppression and angiogenesis, respectively. In this study, we investigated contribution of PGE2 and its cognate receptors to kidney cancer cell invasion. The results show that PGE2 promotes the cancer, but not benign kidney cell invasion of a Matrigel matrix through small GTPase RalA protein. Stimulation with PGE2 leads to Akt-mediated and phosphorylation-dependent inactivation of the Ral GTPase activating protein (GAP) complex 2 (RGC2), a Ral inactivator (20). Use of complementary pharmacologic ligand agonist and antagonist and biologic small interfering RNA (siRNA) reagents implicates EP2, EP4, Akt, RGC2 and RalA in the PGE2-induced kidney cancer cell invasion. Together, these studies identify a new PGE2 → EP2/EP4 → Akt → RGC2 → RalA signal transduction cascade that promotes the kidney cancer cell invasion, and provide rationale for the targeting of components of this pathway to limit advanced kidney cancer morbidity and mortality.
Results
PGE2 induces invasion of SN12C renal cancer cells
Stimulation of non-kidney cancer cells with PGE2 induces the cell proliferation, survival, and migration (11). We tested whether activation of endogenous EPs with PGE2 also regulates the invasion of malignant SN12C, or benign and immortalized HK2 human kidney cells. Treatment with PGE2 enhanced the invasion of SN12C cells of a Matrigel matrix as detected with the transwell invasion assay (Fig. 1A, 1B). Distinctly, the similar treatment of benign HK2 cells with PGE2 not only failed to increase, but in fact decreased the cell invasion (Fig. 1A, 1B). These effects of PGE2 on the invasion of both SN12C and HK2 cells were dose-dependent suggesting a receptor-mediated response. The treatment with EGF promoted invasion of both SN12C and HK2 cells (Fig. 1A). To exclude the possibility that PGE2 impacts the kidney cell invasion by affecting rate of cell proliferation (21), we stained cells with trypan blue and counted viable, trypan blue-excluding cells using a hemocytometer under light microscopy. Results shown in Figure 1C demonstrate the lack of PGE2 effect on the growth rate of SN12C or HK2 cells (within the same time frame used to examine the cell invasion), prompting the conclusion that PGE2 specifically stimulates invasiveness of the renal cancer SN12C cells.
Fig. 1. PGE2 promotes SN12C renal cancer cell invasion.

(A) Effect of PGE2 on the invasion of malignant SN12C and benign HK2 kidney cells. Equal number of SN12C and HK2 cells were starved overnight and allowed to invade Matrigel-coated transwell filters in the presence, or absence, of PGE2 (nM) or EGF (20 nM) for 18 hr. Cells that invaded the matrix and migrated to the bottom side of the filter were stained with Diff-Quik. Cells in four randomly-selected fields were counted using a phase-contrast microscope and are presented as percent change in comparison to control not-treated (NT) samples. Each point represents the mean ± S.E.M. of values obtained from three independent experiments performed in duplicate, and * P < 0.05 versus corresponding not-treated samples. (B) Representative microscopic images of migrated cells. (C) Effect of PGE2 on the kidney cell proliferation. Cells were stimulated, or not, with PGE2 (50 nM) for 24 hr at 37°C, detached and incubated with 0.1% trypan blue stain solution. Cells excluding the dye were counted under light microscopy with a hemocytometer. Each point represents the mean ± S.E.M. of values obtained from three independent experiments.
RalA activation correlates with invasion of SN12C cells
PGE2 promotes the SN12C cancer cell invasion albeit the mechanisms involved remain incomplete. Expression levels of attachment proteins that regulate cell migration and invasion vary among RCC cell lines (22), suggesting existence of cell type-specific invasive mechanisms. Recently, we reported that PGE2-promoted RCC7 cell invasion of collagen is mediated through EP4 and small GTPase Rap proteins (23).
Emerging evidence suggests a role for Ras-like small GTPase Ral (RalA and RalB) proteins in certain types of cancer cell invasion and metastasis (24–26). Activated Ral is bound to GTP and we determined the effect of PGE2 stimulation on Ral•GTP levels with a GST pull down assay using the Ral-binding domain (RBD) of Ral-binding protein 1 (RalBP1). In SN12C cells, RalA was activated by PGE2 in a dose-dependent manner and reached maximal effects (35% of total RalA) at a concentration of 10 nM (Fig. 2A, 2B). On the other hand, RalB was not appreciably activated in these cells following a similar treatment with PGE2 (Fig. 2A, 2B). EGF stimulation promoted activation of RalA (59.8%) as well as RalB (22.1%) in the SN12C cells (Fig. 2A, 2B). The activation pattern of RalA (Fig. 2A) correlates with the PGE2-induced invasion of SN12C cells (Fig. 1A), suggesting involvement of RalA GTP in the PGE2-induced kidney cancer cell invasion.
Fig. 2. Effect of PGE2 on Ral activation.

(A) PGE2 increases the RalA•GTP but not RalB•GTP expression levels in cancer SN12C cells. SN12C cells were treated, or not, for 5 min with the indicated concentration of PGE2 (in nM) or EGF (20 ng/ml). Cell lysates were used in pull-down assays using GST-RalBP1-RBD fusion protein conjugated to glutathione agarose beads. Protein complexes on beads were washed four times (twice in lysis buffer, once in lysis buffer containing 500 mM NaCl, and once more in lysis buffer). Levels of RalA•GTP, RalB•GTP, and total RalA, RalB and Actin proteins were determined using anti-RalA, anti-RalB, and anti-Actin antibodies. Shown are representative blots from a single experiment. (B) Quantitative analysis of RalA•GTP and RalB•GTP levels in SN12C cells. (C) Effect of PGE2 treatment on RalA•GTP and RalB•GTP expression in benign HK2 cells. Levels of Ral•GTP proteins were determined exactly as described under A. (D) Quantitative analysis of RalA•GTP and RalB•GTP levels in HK2 cells. For results shown in panels B and D, data are presented as a percent of Ral•GTP over total Ral (in the whole cell lysate) and each point represents the mean ± S.E.M. of values obtained from at least three independent experiments. * P < 0.05 versus corresponding control not-treated (NT) samples.
In benign HK2 kidney cells, PGE2 exerted a distinct effect on the Ral activation response (Fig. 2C, 2D). Whereas PGE2 induced the modest RalA activation (only 10% of total RalA), it prompted a substantial increase in the RalB•GTP levels (about 40% of total RalB). EGF treatment exhibited a similar response; EGF promoted the modest RalA (10.8%) but robust RalB (43.4%) activation (Fig. 2C, 2D). Under steady-state conditions the fraction of RalA•GTP in HK2 cells (about 3% of total RalA) was substantially less than that in the SN12C cells (about 20% of total RalA), whereas the fraction of RalB•GTP was similar in both cell types (about 20% of total RalB). Collectively, these results establish a correlation between PGE2-induced SN12C cell invasion (Fig. 1A) and RalA activation (Fig. 2B), and an inverse relationship between RalB•GTP levels (Fig. 2D) and inhibition of HK2 cell invasion (Fig. 1A). Whereas EGF and PGE2 induce the similar RalA and RalB activation in SN12C cells (Fig. 2), only EGF could promote the HK2 cell invasion (Fig. 1), suggesting involvement of distinct mechanisms of EGF- and PGE2-mediated cell invasion. Although RalA and RalB are highly homologous and are known to share downstream effectors (27), our results suggest distinct and non-redundant functions for active RalA and RalB in the kidney cancer cell invasion.
RalA is required for SN12C cell invasion
To provide direct evidence for involvement of RalA in the PGE2-induced cell invasion, we knocked down expression of endogenous RalA with siRNA in SN12C (Fig. 3A) and HK2 (Fig. 3B) cells. The SN12C cells with knocked down expression of RalA failed to invade following stimulation with PGE2 (Fig. 3C). On the other hand, the knockdown of RalB (Fig. 3D) or RalA (Fig. S1A) in HK2 cells did not impact the PGE2-induced decrease in the cell invasion. These results lead to the conclusion that RalA mediates the PGE2-regulated SN12C, but not HK2 cell invasion.
Fig. 3. Effect of RalA knockdown on SN12C cell invasion.

Knockdown of endogenous RalA in SN12C (A) and HK2 (B) cells. Cells were transiently transfected with control siRNA (siCon), RalA or RalB siRNA for 24 hr followed by starvation for another 24 hr. Expression of RalA and Actin were determined by Western blot, and the levels of detected Actin served as a control for total protein loading. Requirement of RalA in the PGE2-induced SN12C (C) and HK2 (D) cell invasion. Cells transfected with control siRNA (siCon), RalA or RalB siRNA were analyzed for PGE2 (50 nM) effect on cell invasion. Data are presented as percent change in comparison to not-treated (NT) samples and each point represents the mean ± S.E.M. of values obtained from three independent experiments. * P < 0.05 versus corresponding not-treated (NT) samples.
PGE2 activates RalA through EP2 and EP4
PGE2 exerts its effects on target cells through at least four cognate receptors named EP1, EP2, EP3 and EP4. To begin to determine identity of EP(s) responsible for the PGE2-induced RalA activation, SN12C cells were treated with PGE2 (non-selective EP agonist), sulprostone (selective EP1/EP3 agonist), butaprost (selective EP2 agonist), or PGE1-OH (selective EP4 agonist) alone, or in combination with AH6809 (selective EP1/EP2/EP3 antagonist) or AH23848 (selective EP4 antagonist). Treatment with PGE2 induced a significant increase in the levels of GTP-bound RalA, which was marginally attenuated when the cells were pre-treated with either AH23848 or AH6809, but was completely inhibited when cells were pre-treated with both antagonists (Fig. 4A, 4B). The treatment with sulprostone had no effect on the RalA•GTP levels (Fig. S1B, S1C), excluding the possible involvement of EP1 or EP3. Consistent with the conclusion that EP2 and EP4 mediate the RalA•GTP expression, treatment with butaprost or PGE1-OH induced the AH6809- and AH23848-senstive, respectively, RalA activation (Fig. 4A, 4B).
Fig. 4. EP2 and EP4 mediate the SN12C cell invasion.

(A) Effect of EP ligand agonists and antagonists on RalA•GTP expression, RGC2 phosphorylation, and Akt phosphorylation. Cells were pre-treated with AH6809 or AH23848 for 30 min prior to stimulation with PGE2 (50 nM), butaprost (1 μM), or PGE1-OH (10 nM) for additional 5 min. RalA•GTP levels were determined with pull down assay. SN12C cell lysates were used to determine phosphorylation content of RGC2 (on Ser 486 and Thr 715 residues) and Akt (on Ser 473) by Western blot. Expression of total Akt is presented to demonstrate the equal protein loading among the different samples. (B) Quantitation of RalA•GTP, phospho-Akt and phospho-Ser486-RGC2. Band intensities were quantified and are presented as percent change in RalA•GTP, phospho-Akt, or phospho-RGC2 (Ser486) bands intensities, compared to corresponding not-treated samples that are arbitrarily assigned 100%. Numbers for the x-axes correspond to sample designation in A. (C) Effect of EP ligand agonists and antagonists on SN12C cell invasion. Cells were treated as in A and analyzed for invasion. Values for y-axis are percent change in comparison to not-treated (NT) samples. For panels B and C, each point represents the mean ± S.E.M. of values obtained from three independent experiments. * P < 0.05 versus corresponding vehicle control-treated samples.
To provide evidence that EP2 and EP4 play a role not only in RalA•GTP expression but also in the actual SN12C cell invasion, cells were treated with complementary EP-specific ligand agonists and antagonists. Results show that whereas the treatment with PGE2, PGE1-OH, or butaprost increased the SN12C cell invasion, the similar treatment with sulprostone did not (Fig. 4C), implying a role for EP2 and EP4, but not EP1 or EP3 in the cell invasion. The butaprost-mediated SN12C cell invasion was attenuated by AH6809, and invasion stimulated by PGE1-OH was specifically inhibited by AH23848. Either antagonist alone could only partially inhibit the PGE2-stimulated cell invasion, while the combination of both antagonists abolished the effect of PGE2 on the cell invasion (Fig. 4C). Together, these results exclude a role for EP1 or EP3, and confirm requirement of EP2 and EP4 in the PGE2-induced SN12C cell invasion, mirroring EP2 and EP4 roles in the PGE2-regulated RalA activation.
G proteins, including Ral, cycle between inactive, GDP-bound state, and active, GTP-bound state. Ral-specific guanine exchange factors (GEFs) facilitate the exchange of GDP for GTP, and the hydrolysis of GTP to GDP is mediated by specific Ral GTPase activating proteins (GAPs). Hence, increased levels of RalA•GTP may occur as a result of RalGEF activation or RalGAP inactivation. A recent report showed that the stimulation of cells (that do not express activating mutation of Ras) with insulin leads to increased levels of Ral•GTP due to inactivation of the RalGAP RGC2 as a result of RGC2 phosphorylation by Akt (20). SN12C cells do not appear to express activated Ras (28) and we tested whether PGE2 promotes the RalA•GTP as a result of RGC2 inactivation consequent to phosphorylation by Akt. Data presented in Figure 4A and 4B demonstrate the PGE2-induced RalA•GTP coincides with the PGE2-induced Akt and RGC2 phosphorylation. Together, these results suggest that PGE2 may increase the SN12C cell invasion via an EP2/EP4 → Akt → RGC2 → RalA•GTP signaling cascade.
PGE2 induces the Akt-mediated RGC2 phosphorylation
To provide evidence for a direct role of Akt in the PGE2-induced RalA•GTP consequent to RGC2 phosphorylation, SN12C cells were treated with PGE2 in the presence or absence of the phosphatidylinositol 3-OH kinase (PI3K) inhibitor LY294002. Treatment with PGE2 induced the time-dependent increase in RalA•GTP levels, and Akt and RGC2 phosphorylation, reaching maximal effects after 5 min of stimulation (Fig. 5A, 5B). Remarkably, the treatment with PGE2 promoted the significant increase in Akt and RGC2 phosphorylation levels after 2 min of stimulation, but increased the RalA•GTP levels only after 5 min of stimulation, establishing Akt and RGC2 phosphorylation precedes the RalA•GTP expression. Pre-treatment of cells with LY294002 abrogated the PGE2-induced Akt and RGC2 phosphorylation and subsequent RalA•GTP accumulation (Fig. 5A, 5B). Significantly, the treatment with LY294002 also abrogated the PGE2-induced SN12C cell invasion (Fig. 5C). Confirmatory experiments using knockdown of endogenous Akt genes (Fig. 5D) evidenced a similar decrease in the PGE2-induced SN12C cell invasion (Fig. 5E), demonstrating a crucial role for activated Akt in the PGE2-induced kidney cancer cell invasion.
Fig. 5. PGE2 activates RalA and SN12C cell invasion through Akt.

(A) Inhibition of PI3K with LY294002 attenuates the PGE2-induced RalA•GTP expression. SN12C cells were pretreated with LY294002 (50 μM) for 2 hr followed by treatment with PGE2 (50 nM) for the indicated time (min). Cell lysates were analyzed for expression of RalA•GTP by pull-down assay, as described. The cell lysates were also analyzed for expression of phospho-Akt, total Akt, phospho-RGC2, and total RGC2 by Western blot. (B) Quantitative analysis of RalA•GTP, phospho-Akt and phospho-Ser486-RGC2. Calculations were performed exactly as described in Fig. 4B. Each point represents the mean ± S.E.M. of values obtained from three independent experiments. * P < 0.05 versus corresponding vehicle control treated samples. Numbers for the x-axis correspond to sample designation in A. (C) Effect of LY294002 on the PGE2-induced SN12C cell invasion. Cells were pretreated with LY294002 for 2 hr followed by addition of PGE2 for additional 16 hr. Cell invasion of Matrigel matrix was performed using the transwell assay. Each point represents the mean ± S.E.M. of values obtained from three independent experiments. * P < 0.05 versus vehicle control not-treated (NT) samples. LY, LY294002. (D) Knockdown of Akt genes. SN12C cells were transiently transfected with control siRNA (siCon) or siRNA targeting Akt1, Akt2 or Akt3 genes for 24 hr followed by starvation for another 24 hr. Expression of individual Akt genes was determined by quantitative PCR. Each point represents the mean ± S.E.M. of values obtained from three independent experiments. * P < 0.05 versus siCon-transfected cells. (E) Effect of Akt expression on PGE2-regulated SN12C invasion. Cells transfected with control siRNA (siCon), Akt1, Akt2 or Akt3 siRNA were analyzed for PGE2 effect on cell invasion. Data are presented as percent change in comparison to siRNA-transfected and not-treated (NT) samples and each point represents the mean ± S.E.M. of values obtained from three independent experiments. * P < 0.05 versus corresponding siRNA-transfected and not-treated (NT) samples.
RGC2 is required for RalA activation and SN12C cell invasion
To investigate if RGC2 forms a critical link between PGE2-induced Akt phosphorylation and RalA activation, we knocked down expression of endogenous RGC2 gene with siRNA. In the RalA activity assay, the knockdown of RGC2 expression increased basal RalA•GTP levels by about 60%, similar to the magnitude achieved with PGE2 stimulation (Fig. 6A, 6B). The decrease in RGC2 expression showed no impact on the basal or PGE2-induced Akt phosphorylation levels (Fig. 6A, 6B). For cell invasion, the knockdown of RGC2 expression increased basal SN12C cell invasion by about 70%, in a manner similar to the PGE2-induced effect (Fig. 6C). Together, these results suggest that PGE2 induces the SN12C cell invasion via a mechanism that involves RGC2.
Fig. 6. Role of RGC2 in the PGE2-induced SN12C cell invasion.
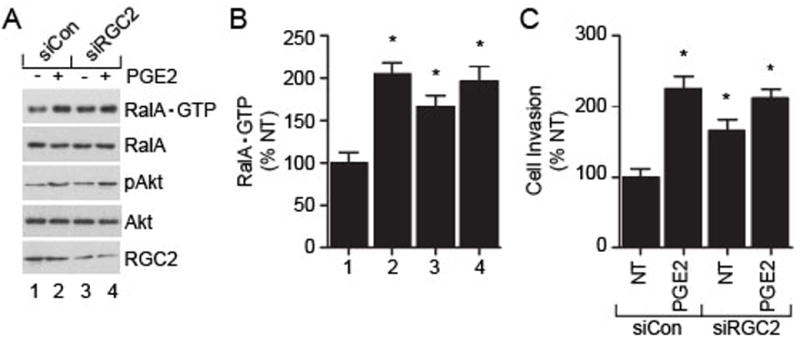
SN12C cells were transfected with control siRNA (siCon) or RGC2 siRNA (siRGC2) for 24 hr followed by incubation in starvation medium for additional 36 hr. (A) Cells were divided and analyzed for expression of RalA•GTP by pull-down assay and phospho-Akt by Western blot. (B) Quantitation of RalA•GTP. Calculations were performed exactly as described in Fig. 2. Each point represents the mean ± S.E.M. of values obtained from three independent experiments, and * P < 0.05 versus corresponding vehicle control (1) treated samples. Numbers for the x-axis correspond to sample designation in A. (C) Role of RGC2 in the PGE2-induced SN12C cell invasion. Cells transfected with control siRNA (siCon) or RGC2 siRNA were treated with PGE2 (50 nM) for 18 hr and analyzed for invasion. For data shown in panels B and C, each point represents the mean ± S.E.M. of values obtained from three independent experiments. * P < 0.05 versus corresponding not-treated (NT) control samples.
Discussion
Cancer-related deaths are due, in large part, to the cancer cell dissemination to distal organs. In the case of kidney cancer, the prognosis of patients diagnosed with metastatic disease and treated with targeted therapies remains modest with a median of about 40 months (3, 29, 30). Surgical resection of the malignant tissue may be curative for localized low-grade cancer, but management options for patients suffering from locally advanced or metastatic disease are not curative (3), providing rationale to identify mechanisms involved in the cancer initiation and metastasis as a prerequisite for discovering effective therapeutics. The principal finding of this study is that the proinflammatory cytokine PGE2 promotes malignant, but not benign kidney cell invasion by activating cognate receptors EP2 and EP4 that, in turn, transduce signals to activate small GTPase RalA. The signaling cascade connecting stimulated EP2 and EP4 to RalA includes PI3K/Akt and the RalA inactivator RGC2. Activated Akt phosphorylates RGC2 leading to the blunting of RGC2’s function to hydrolyze enzymatically active RalA•GTP to inactive RalA•GDP.
A causative link between persistent inflammation and cancer is becoming increasingly clear (7, 8). Indeed, tumor growth and progression is subject to regulation not only by the malignant cancer cells themselves, but also by the surrounding tumor microenvironment that encompasses activated fibroblasts, enhanced angiogenesis and infiltrating inflammatory cells. Tumor cells acquire the ability to generate local immune suppression (through the secretion of factors) that is commonly associated with cancer inflammation. A frequent occurrence in cancer is upregulated expression of COX2 that produces proinflammatory mediators, including PGE2 (11). Specifically, expression levels of COX2 and PGE2 are increased in kidney cancer and indicate poor prognosis and reduced survival time. In this study, we showed that PGE2 impacts the malignant SN12C, but not benign HK2 human kidney cells, justifying the opportunity to target (specific) PGE2 signal networks for the treatment of patients with kidney cancer.
PGE2 exerts its effects on target cells by activating four cognate receptors and our results implicate EP2 and EP4 in the PGE2-induced RalA activation and SN12C cell invasion. Both EP2 and EP4 couple to Gs proteins (10, 14), and the best studied Gαs effectors are adenylyl cyclases that produce cAMP leading to the activation of protein kinase A. Stimulation of SN12C cells with PGE2 led to the activation of PKA as evidenced by the phosphorylation of VASP protein (Fig. S2), a PKA substrate (31). However, the inhibition of PKA activity with H89 (32) had no effect on the PGE2-induced RalA•GTP expression, or Akt and RGC2 phosphorylation (Fig. S2), excluding a possible role for PKA in the PGE2-regulated SN12C cell invasion.
A preponderance of evidence demonstrates a role for activated Akt in cancer cell migration and invasion (33). Recently, it was reported that activated Akt phosphorylates the RalGAP RGC2 leading to its inactivation (20) and consequent increased levels of Ral•GTP. In non-kidney cells, EPs transduce Akt activating signals through Gβγ subunits that may directly activate PI3Kγ (16), or indirectly activate PI3Kα/β through, for example, transactivation of EGFR (15, 34). Our results show that stimulation of SN12C kidney cancer cells with PGE2 promotes the EP2- and EP4-mediated Akt activation and RGC2 phosphorylation. Hence, PGE2 may regulate Ral•GTP levels through Akt-dependent inactivation of its GTPase activating protein RGC2. Inhibition of PI3K activation or knockdown of endogenous Akt expression should, at least in theory, mask the RGC2 phosphorylation and inactivation thereby leading to increased Ral•GDP levels. Consistent with this conclusion, our results show that the inhibition of Akt activation attenuates the SN12C cell invasion.
Like other GTPases, Ral signaling is controlled by activators in the form of RalGEFs and inactivators in the form of RalGAPs. In cancer cells that express Ras activating mutations, Ral is largely activated through Ras effectors RalGEFs (24). However, less information is available regarding Ral activation in cancer cells that do not express active Ras. Our results show that stimulation of endogenous EPs leads to the Ral activation through inactivation of its RalGAP RGC2. In the case of other small GTPases that are involved in cell transformation or invasion, inactivation or downregulation of their specific GAPs has been suggested to promote tumorigenesis. For example, inactivation mutation of Rap1GAP contributes to several types of malignancies (35). It remains to be determined whether decreased expression and/or inactivation mutations of RGC2 are causative of kidney cancer cell invasion.
An interesting result in our studies is the finding that PGE2 promotes invasion of malignant SN12C, but not benign HK2 cells. Reasons for the observed discriminate effects of PGE2 on these two human kidney cell lines remains unclear. Using real-time PCR analysis, we observed that while both cell lines expressed similar levels of EP1 and EP3 genes, SN12C cells expressed more EP4 but less EP2 genes, in comparison to the HK2 cells (Fig. S3). Hence, it is possible that the ratio of EP4/EP2 may be a determinant in the cell’s invasive response to PGE2. In addition, we also observed that RalA and RalB expression levels and activation states are distinct among the two cell lines. We found that RalB expression is higher in the benign HK2 than in the cancerous SN12C kidney cells (data not shown). Under basal conditions, RalB activity is about 20% of total RalB in both cell lines and, therefore, the steady-state RalB•GTP levels are higher in the HK2, compared to SN12C cells. Also, total RalA and steady-state RalA GTP levels are higher in the SN12C (20%) than HK2 (<5%) cells. Our results, therefore, suggest that RalA activity is dominant in the SN12C cells and RalB activity is dominant in the HK2 cells, consistent with the role of RalA in prostate cancer cell metastasis (25) but in contrast to its role in pancreatic cancer cells that express activating Ras mutations (24) where RalB exerts the chief effect on the cancer cell metastasis. Altogether, these observations lend support to the idea that distinct cancer types with underlying specific genetic alterations may employ specific Ral isoforms to support their invasion and metastasis.
In summary, we have uncovered a PGE2-controlled signaling pathway that regulates the kidney cancer cell invasion. The involved signal pathway contains drug-targeting intermediates, including Akt, RGC2 and RalA that may be used to benefit patients with advanced disease. Also, EP2 and EP4 signals may be interdicted with specific ligand antagonists as GPCRs have proven to be viable drug targets (36). Hence, the combined targeted inhibition of EP2 and EP4 activation and rescued activation of RGC2 may improve prognosis of patients diagnosed with advanced kidney cancer.
Materials and Methods
Materials
Antibodies were obtained as follows: anti-RalA, anti-RalB, anti-phospho-Akt, anti-Akt, and anti-βActin from Cell Signaling; and all secondary antibodies from Pierce. Anti-RGC2 and anti-phospho-RGC2 antibodies were kindly provided by Dr. A. Saltiel (Univ Michigan). Chemicals were obtained as follows: PGE2, PGE1-OH, sulprostone, butaprost, AH23848 and AH6809 from Cayman Chemical. Control and targeted siRNAs were from Dharmacon.
Cell culture
Tissue culture media DMEM, F12K and RPMI 1640, and fetal bovine serum (FBS) were obtained from Cellgro and HyClone, respectively. Renal SN12C (carcinoma) and HK2 (normal) cells were obtained from the National Cancer Institute and American Type Culture Collection, respectively. SN12C cells were maintained in DMEM/F12 and HK2 in RPMI 1640, both supplemented with FBS (10%), penicillin (100 units/mL) and streptomycin (100 μg/mL), at 37°C in a humidified 95% air and 5% CO2 atmosphere. Corresponding medium lacking FBS but containing penicillin and streptomycin was used for cell starvation. All cells were maintained at 60% to 80% density and were used from passage 11 to passage 25. On-target plus™ siRNA Smartpools™ (Dharmacon) were used for transient gene knockdown. Briefly, cells at 40% confluency were transfected with Dharmafect reagent containing 20 nM siRNA and cultured for 2 days prior to further manipulations.
Ral activation assay
Ral activation was determined using an established pull-down method based on the specific binding of a GST-RalBP1-RBD fusion protein to the active, GTP-bound form of Ral. Briefly, whole cell lysates were centrifuged at 13,000 × rpm for 12 min at 4°C and the supernatant was removed and assayed for protein concentration. The GST-tagged RalBP1-RBD protein was expressed in BL21 cells, purified using glutathione sepharose 4B beads. Equal amount of GST-RalBP1-RBD was added to equal amount of cell extracts. Mixtures were incubated for 1 hr at 4°C, washed twice with cell lysis buffer (50 mM Tris-HCl, pH 7.4, 150 mM NaCl, 5 mM MgCl2, 15% (v/v) glycerol, 1% (v/v) NP40, and protease inhibitor cocktail (Sigma)), once with lysis buffer containing 500 mM NaCl and once again with lysis buffer, and boiled in Laemmli sample buffer. The precipitated proteins were analyzed by Western blotting. For quantitative analyses, band intensities were digitized with a flatbed scanner, quantified with ImageJ software (NCBI), and levels of activated Ral proteins are presented as the ratio of Ral•GTP signal to the corresponding total Ral signal.
Western blotting
Appropriately treated cells were washed with PBS and lysed in lysis buffer. The samples were denatured in Laemmli sample buffer, resolved on 10% or 15% SDS-polyacrylamide gels, transferred to PVDF membranes (Millipore), and immunoblotted with the indicated antibody in blocking buffer (4% BSA-PBST). The antibodies were used at the following dilutions: RalA, 1:2,000; RalB, 1:2,000; Actin, 1:100,000; Akt, 1:2,000; phospho-Ser473-Akt, 1:1,000; RGC2, 1:1,000; phospho-Ser486-RGC2, 1:1,000; and phospho-Thr715-RGC2, 1:1,000. Immunoblots were visualized using the ECL plus (GE Lifesciences) or SuperSignal West Pico chemiluminescence (Pierce) reagents.
Invasion assay
Cell invasion assays were done using 8-μm pore transwell chambers coated with Matrigel according to the manufacturer instructions (BD Bioscience). Briefly, SN12C or HK2 cell monolayers at 60–80% confluency were starved for 36 hr, detached using HyQtase (Hyclone), washed and resuspended in starvation medium, and added to the transwell chambers (5 × 10⁴ cells/well). Starvation medium containing the indicated reagent was added to the lower chambers and cells were cultured at 37°C for 18 hr. Where indicated, the EPs antagonists were added 30 min before stimulation with prostaglandins. Cells were fixed and stained with Diff-Quik stain solution (Siemens). Cells that remained at the top of filter were removed with a cotton swab and migrated cells were counted through a 20× objective lens with an Axioskop microscope (Zeiss).
Statistical analysis
All data are presented as the mean ± SEM of, at least, three independent experiments. The data were analyzed with one-way ANOVA and Tukey post-test to determine statistical significance. All statistical analyses were done and all graphs were generated using GraphPad Prism 5.0 software (GraphPad). The x and y labels of all presented data were prepared using Adobe Illustrator CS5 (Adobe).
Supplementary Material
Acknowledgments
We thank our colleagues for providing valuable reagents and the NCI for providing the SN12C cancer cells. We also thank Ms. E. Grigson and Ms. K. Durst for editorial assistance, and Dr. Z. Nie for reading and commenting on the manuscript. This work was supported, in part, by US National Institutes of Health grant R01 CA129155 (to Y.D.).
Footnotes
Author Contributions
Z.L., Y.Z., W.K. and Y.D. designed the experiments. Z.L., Y.Z. and W.K. performed all experiments in this work. Z.L. and Y.D. wrote the paper.
Competing Interest Statement
The authors declare no competing financial interests.
References
- 1.Siegel RWE, Brawley O, Jemal A. The impact of eliminating socioeconomic and racial disparities on premature cancer deaths. CA Cancer J Clin. 2011;61:212–36. doi: 10.3322/caac.20121. [DOI] [PubMed] [Google Scholar]
- 2.Young AN, Dale J, Yin-Goen QQ, Harris WB, Petros JA, Datta MW, et al. Current trends in molecular classification of adult renal tumors. Urology. 2006;67:873–80. doi: 10.1016/j.urology.2005.11.042. [DOI] [PubMed] [Google Scholar]
- 3.Sun M, Lughezzani G, Perrotte P, Karakiewicz PI. Treatment of metastatic renal cell carcinoma. Nat Rev Urol. 2010;7:327–38. doi: 10.1038/nrurol.2010.57. [DOI] [PubMed] [Google Scholar]
- 4.Biswas S, Eisen T. Immunotherapeutic strategies in kidney cancer - when TKIs are not enough. Nat Rev Clin Oncol. 2009;6:478–87. doi: 10.1038/nrclinonc.2009.91. [DOI] [PubMed] [Google Scholar]
- 5.Schlesinger-Raab A, Treiber U, Zaak D, Holzel D, Engel J. Metastatic renal cell carcinoma: Results of a population-based study with 25 years follow-up. Eur J Cancer. 2008;44:2485–95. doi: 10.1016/j.ejca.2008.07.039. [DOI] [PubMed] [Google Scholar]
- 6.Murai M, Oya M. Renal cell carcinoma: etiology, incidence and epidemiology. Curr Opin Urol. 2004;14:229–33. doi: 10.1097/01.mou.0000135078.04721.f5. [DOI] [PubMed] [Google Scholar]
- 7.Balkwill F, Mantovani A. Cancer and inflammation: Implications for pharmacology and therapeutics. Clin Pharmacol Therap. 2010;87:401–6. doi: 10.1038/clpt.2009.312. [DOI] [PubMed] [Google Scholar]
- 8.Grivennikov SI, Greten FR, Karin M. Immunity, inflammation, and cancer. Cell. 2010;140:883–99. doi: 10.1016/j.cell.2010.01.025. [DOI] [PMC free article] [PubMed] [Google Scholar]
- 9.Eruslanov E, Daurkin I, Vieweg J, Daaka Y, Kusmartsev S. Aberrant PGE(2) metabolism in bladder tumor microenvironment promotes immunosuppressive phenotype of tumor-infiltrating myeloid cells. Int Immunopharmacol. 2011;11:848–55. doi: 10.1016/j.intimp.2011.01.033. [DOI] [PMC free article] [PubMed] [Google Scholar]
- 10.Hao CM, Breyer MD. Physiological regulation of prostaglandins in the kidney. Ann Rev Physiol. 2008;70:357–77. doi: 10.1146/annurev.physiol.70.113006.100614. [DOI] [PubMed] [Google Scholar]
- 11.Wang DZ, Dubois RN. Eicosanoids and cancer. Nat Rev Cancer. 2010;10:181–93. doi: 10.1038/nrc2809. [DOI] [PMC free article] [PubMed] [Google Scholar]
- 12.Pugh S, Thomas GAO. Patients with adenomatous polyps and carcinomas have increased colonic mucosal prostaglandin E2. Gut. 1994;35:675–8. doi: 10.1136/gut.35.5.675. [DOI] [PMC free article] [PubMed] [Google Scholar]
- 13.Asano T, Shoda J, Ueda T, Kawamoto T, Todoroki T, Shimonishi M, et al. Expressions of cyclooxygenase-2 and prostaglandin E receptors in carcinoma of the gallbladder: Crucial role of arachidonate metabolism in tumor growth and progression. Clin Cancer Res. 2002;8:1157–67. [PubMed] [Google Scholar]
- 14.Sugimoto Y, Narumiya S. Prostaglandin E receptors. J Biol Chem. 2007;282:11613–7. doi: 10.1074/jbc.R600038200. [DOI] [PubMed] [Google Scholar]
- 15.Buchanan FG, Wang DZ, Bargiacchi F, DuBois RN. Prostaglandin E2 regulates cell migration via the intracellular activation of the epidermal growth factor receptor. J Biol Chem. 2003;278:35451–35457. doi: 10.1074/jbc.M302474200. [DOI] [PubMed] [Google Scholar]
- 16.LopezIlasaca M, Crespo P, Pellici PG, Gutkind JS, Wetzker R. Linkage of G protein-coupled receptors to the MAPK signaling pathway through PI 3-kinase gamma. Science. 1997;275:394–397. doi: 10.1126/science.275.5298.394. [DOI] [PubMed] [Google Scholar]
- 17.Sheng HM, Shao JY, Washington MK, DuBois RN. Prostaglandin E2 increases growth and motility of colorectal carcinoma cells. J Biol Chem. 2001;276:18075–18081. doi: 10.1074/jbc.M009689200. [DOI] [PubMed] [Google Scholar]
- 18.Wang DZ, Wang HB, Brown J, Daikoku T, Ning W, Shi Q, et al. CXCL1 induced by prostaglandin E2 promotes angiogenesis in colorectal cancer. J Exp Med. 2006;203:941–951. doi: 10.1084/jem.20052124. [DOI] [PMC free article] [PubMed] [Google Scholar]
- 19.Salcedo R, Zhang X, Young HA, Michael N, Wasserman K, Ma WH, et al. Angiogenic effects of prostaglandin E2 are mediated by up-regulation of CXCR4 on human microvascular endothelial cells. Blood. 2003;102:1966–1977. doi: 10.1182/blood-2002-11-3400. [DOI] [PubMed] [Google Scholar]
- 20.Chen XW, Leto D, Xiong TT, Yu GG, Cheng A, Decker S, et al. A Ral GAP complex links PI 3-kinase/Akt signaling to RalA activation in insulin action. Mol Biol Cell. 2011;22:141–152. doi: 10.1091/mbc.E10-08-0665. [DOI] [PMC free article] [PubMed] [Google Scholar]
- 21.Castellone MD, Teramoto H, Williams BO, Druey KM, Gutkind JS. Prostaglandin E2 promotes colon cancer cell growth through a Gs-axin-beta-catenin signaling axis. Science. 2005;310:1504–1510. doi: 10.1126/science.1116221. [DOI] [PubMed] [Google Scholar]
- 22.Kim WJ, Gersey Z, Daaka Y. Rap1GAP regulates renal cell carcinoma invasion. Cancer Lett. 2012 doi: 10.1016/j.canlet.2012.01.022. Epub. [DOI] [PMC free article] [PubMed] [Google Scholar]
- 23.Wu J, Zhang Y, Frilot N, Kim JI, Kim WJ, Daaka Y. Prostaglandin E2 regulates renal cell carcinoma invasion through the EP4 receptor-Rap GTPase signal transduction pathway. J Biol Chem. 2011;286:33954–33962. doi: 10.1074/jbc.M110.187344. [DOI] [PMC free article] [PubMed] [Google Scholar]
- 24.Lim KH, O’Hayer K, Adam SJ, Kendall SD, Campbell PM, Der CJ, et al. Divergent roles for RalA and RalB in malignant growth of human pancreatic carcinoma cells. Curr Biol. 2006;16:2385–2394. doi: 10.1016/j.cub.2006.10.023. [DOI] [PubMed] [Google Scholar]
- 25.Yin JJ, Pollock C, Tracy K, Chock M, Martin P, Oberst M, et al. Activation of the RaIGEF/Ral pathway promotes prostate cancer metastasis to bone. Mol Cell Biol. 2007;27:7538–7550. doi: 10.1128/MCB.00955-07. [DOI] [PMC free article] [PubMed] [Google Scholar]
- 26.Smith SC, Theodorescu D. The Ral GTPase pathway in metastatic bladder cancer: Key mediator and therapeutic target. Urol Oncol. 2009;27:42–47. doi: 10.1016/j.urolonc.2008.04.012. [DOI] [PMC free article] [PubMed] [Google Scholar]
- 27.Bodemann BO, White MA. Ral GTPases and cancer: Linchpin support of the tumorigenic platform. Nat Rev Cancer. 2008;8:133–140. doi: 10.1038/nrc2296. [DOI] [PubMed] [Google Scholar]
- 28.Ikediobi ON, Davies H, Bignell G, Edkins S, Stevens C, O’Meara S, et al. Mutation analysis of 24 known cancer genes in the NCI-60 cell line set. Mol Cancer Therap. 2006;5:2606–2612. doi: 10.1158/1535-7163.MCT-06-0433. [DOI] [PMC free article] [PubMed] [Google Scholar]
- 29.Bukowski RM. Prognostic factors for survival in metastatic renal cell carcinoma update 2008. Cancer. 2009;115:2273–2281. doi: 10.1002/cncr.24226. [DOI] [PubMed] [Google Scholar]
- 30.Motzer RJ, Hutson TE, Tomczak P, Michaelson MD, Bukowski RM, Rixe O, et al. Sunitinib versus interferon alfa in metastatic renal cell carcinoma. N Eng J Med. 2007;356:115–124. doi: 10.1056/NEJMoa065044. [DOI] [PubMed] [Google Scholar]
- 31.Halbrugge M, Walter U. Analysis, purification and properties of a 50000-dalton membrane-associated phosphoprotein from human platelets. J Chromatogr. 1990;521:335–343. doi: 10.1016/0021-9673(90)85057-3. [DOI] [PubMed] [Google Scholar]
- 32.Chijiwa T, Mishima A, Hagiwara M, Sano M, Hayashi K, Inoue T, et al. Inhibition of forskolin-induced neurite outgrowth and protein-phosphorylation by a newly synthesized selective inhibitor of cyclic AMP-dependent protein-kinase, N-[2-(P-Bromocinnamylamino)Ethyl]-5-Isoquinolinesulfonamide (H-89), of PC12d pheochromocytoma cells. J Biol Chem. 1990;265:5267–5272. [PubMed] [Google Scholar]
- 33.Dillon RL, Muller WJ. Distinct biological roles for the Akt family in mammary tumor progression. Cancer Res. 2010;70:4260–4264. doi: 10.1158/0008-5472.CAN-10-0266. [DOI] [PMC free article] [PubMed] [Google Scholar]
- 34.Luttrell LM, Daaka Y, Lefkowitz RJ. Regulation of tyrosine kinase cascades by G protein-coupled receptors. Curr Opin Cell Biol. 1999;11:177–183. doi: 10.1016/s0955-0674(99)80023-4. [DOI] [PubMed] [Google Scholar]
- 35.Hattori M, Minato N. Rap1 GTPase: Functions, regulation, and malignancy. J Biochem. 2003;134:479–484. doi: 10.1093/jb/mvg180. [DOI] [PubMed] [Google Scholar]
- 36.DeWire SM, Violin JD. Biased ligands for better cardiovascular drugs dissecting G protein-coupled receptor pharmacology. Circ Res. 2011;109:205–216. doi: 10.1161/CIRCRESAHA.110.231308. [DOI] [PubMed] [Google Scholar]
Associated Data
This section collects any data citations, data availability statements, or supplementary materials included in this article.